

13 Week Liquidity Commander - Google Sheet
Originally published: 30/01/2026 21:24
Last version published: 07/08/2026 12:43
Publication number: ELQ-59179-3
View all versions & Certificate
certified

13 Week Liquidity Commander - Google Sheet

Track your short-term cash flow across multiple scenarios to ensure you maintain the liquidity needed to survive.

Description

Running out of cash unexpectedly is the fastest way to stall business operations. This tool tracks your short-term cash flow across multiple scenarios to ensure you maintain the liquidity needed to survive. This spreadsheet is designed to be used in Google Sheets.


The Operational Friction

Relying on scattered, manual spreadsheets to track short-term cash flow often causes critical miscalculations. When business owners override complex waterfall formulas or fail to account for different market scenarios, they lose sight of their true survival runway. Without a centralized, multi-scenario projection model, an unexpected drop in revenue can quickly push a business below its minimum operating cash threshold.


The Mathematical & Structural Solution

This terminal delivers a uniform, protected interface that calculates your rolling 13-week cash balance safely. The underlying calculation framework is completely locked, preventing accidental formula deletion while instantly updating your dashboard metrics based on simple weekly inputs. To ensure immediate deployment, your purchase includes two supplementary documents:


  • The Operational User Guide: Provides step-by-step instructions so the user can deploy the tool immediately without staring at a confusing blank screen.
  • The Technical Spec Sheet: Fully exposes the background formulas, math, and logical architecture so the user has absolute trust in the calculations and knows exactly what is happening under the hood.


Core System Capabilities

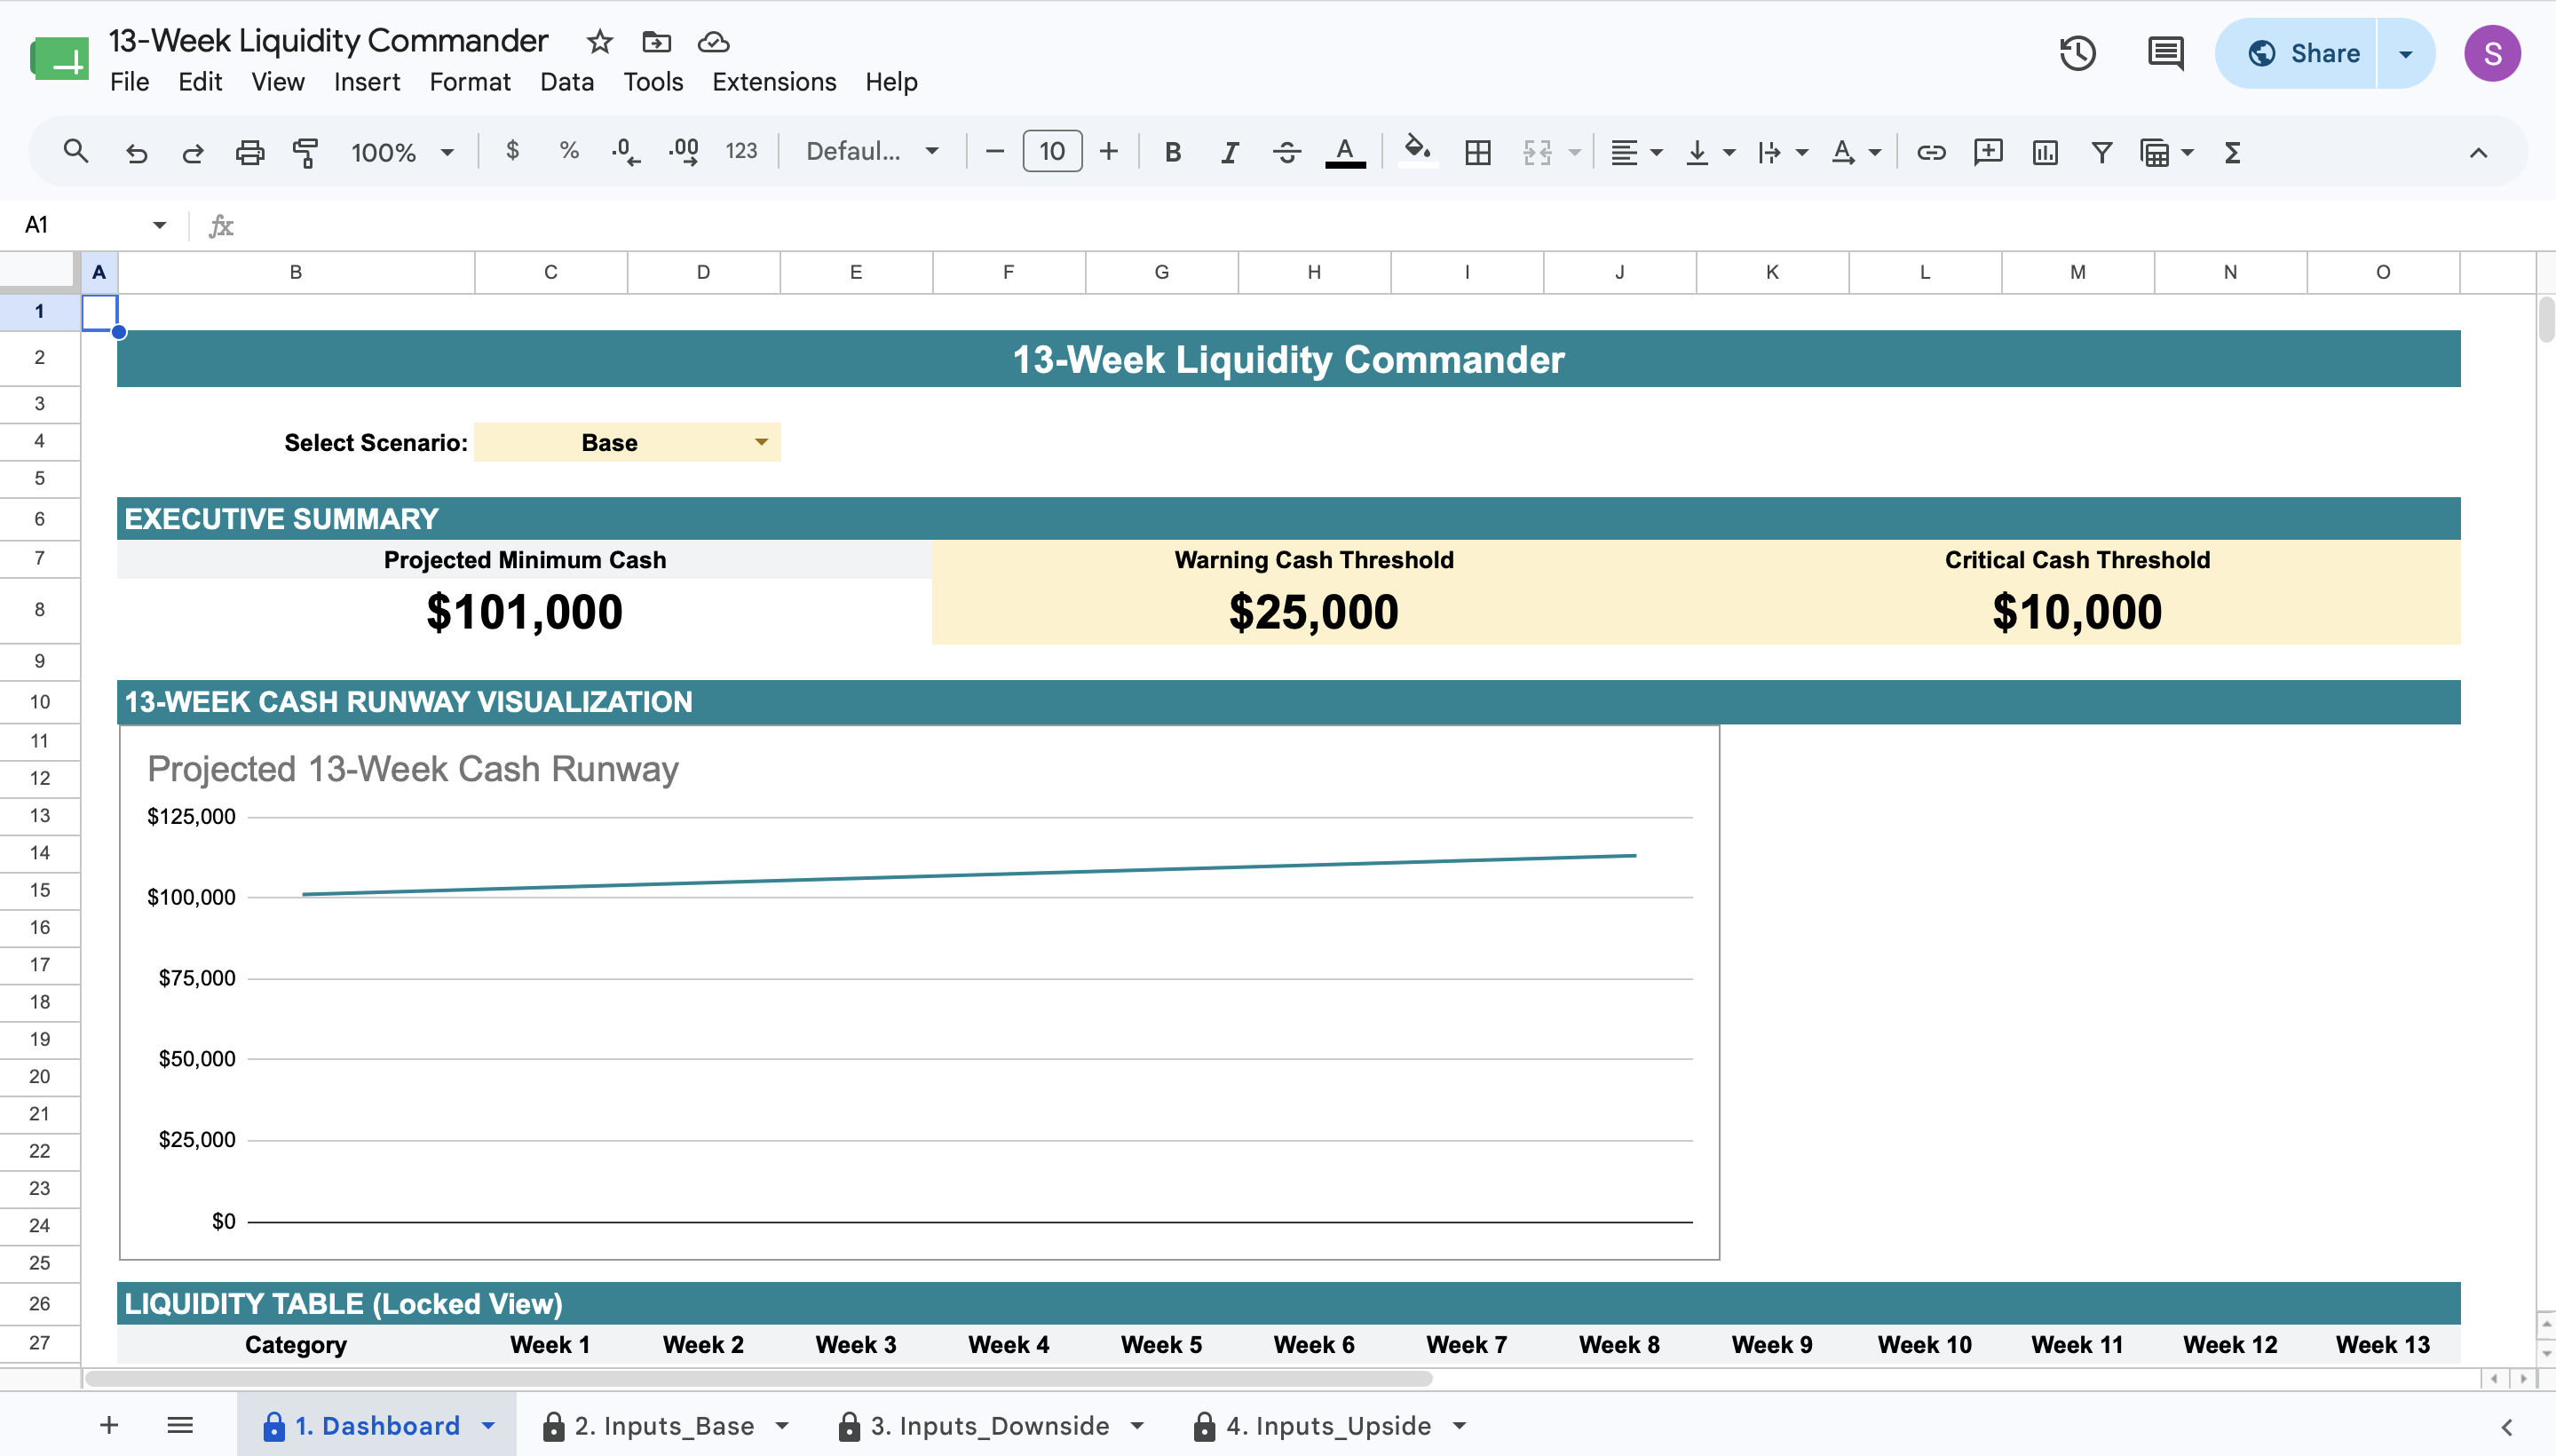
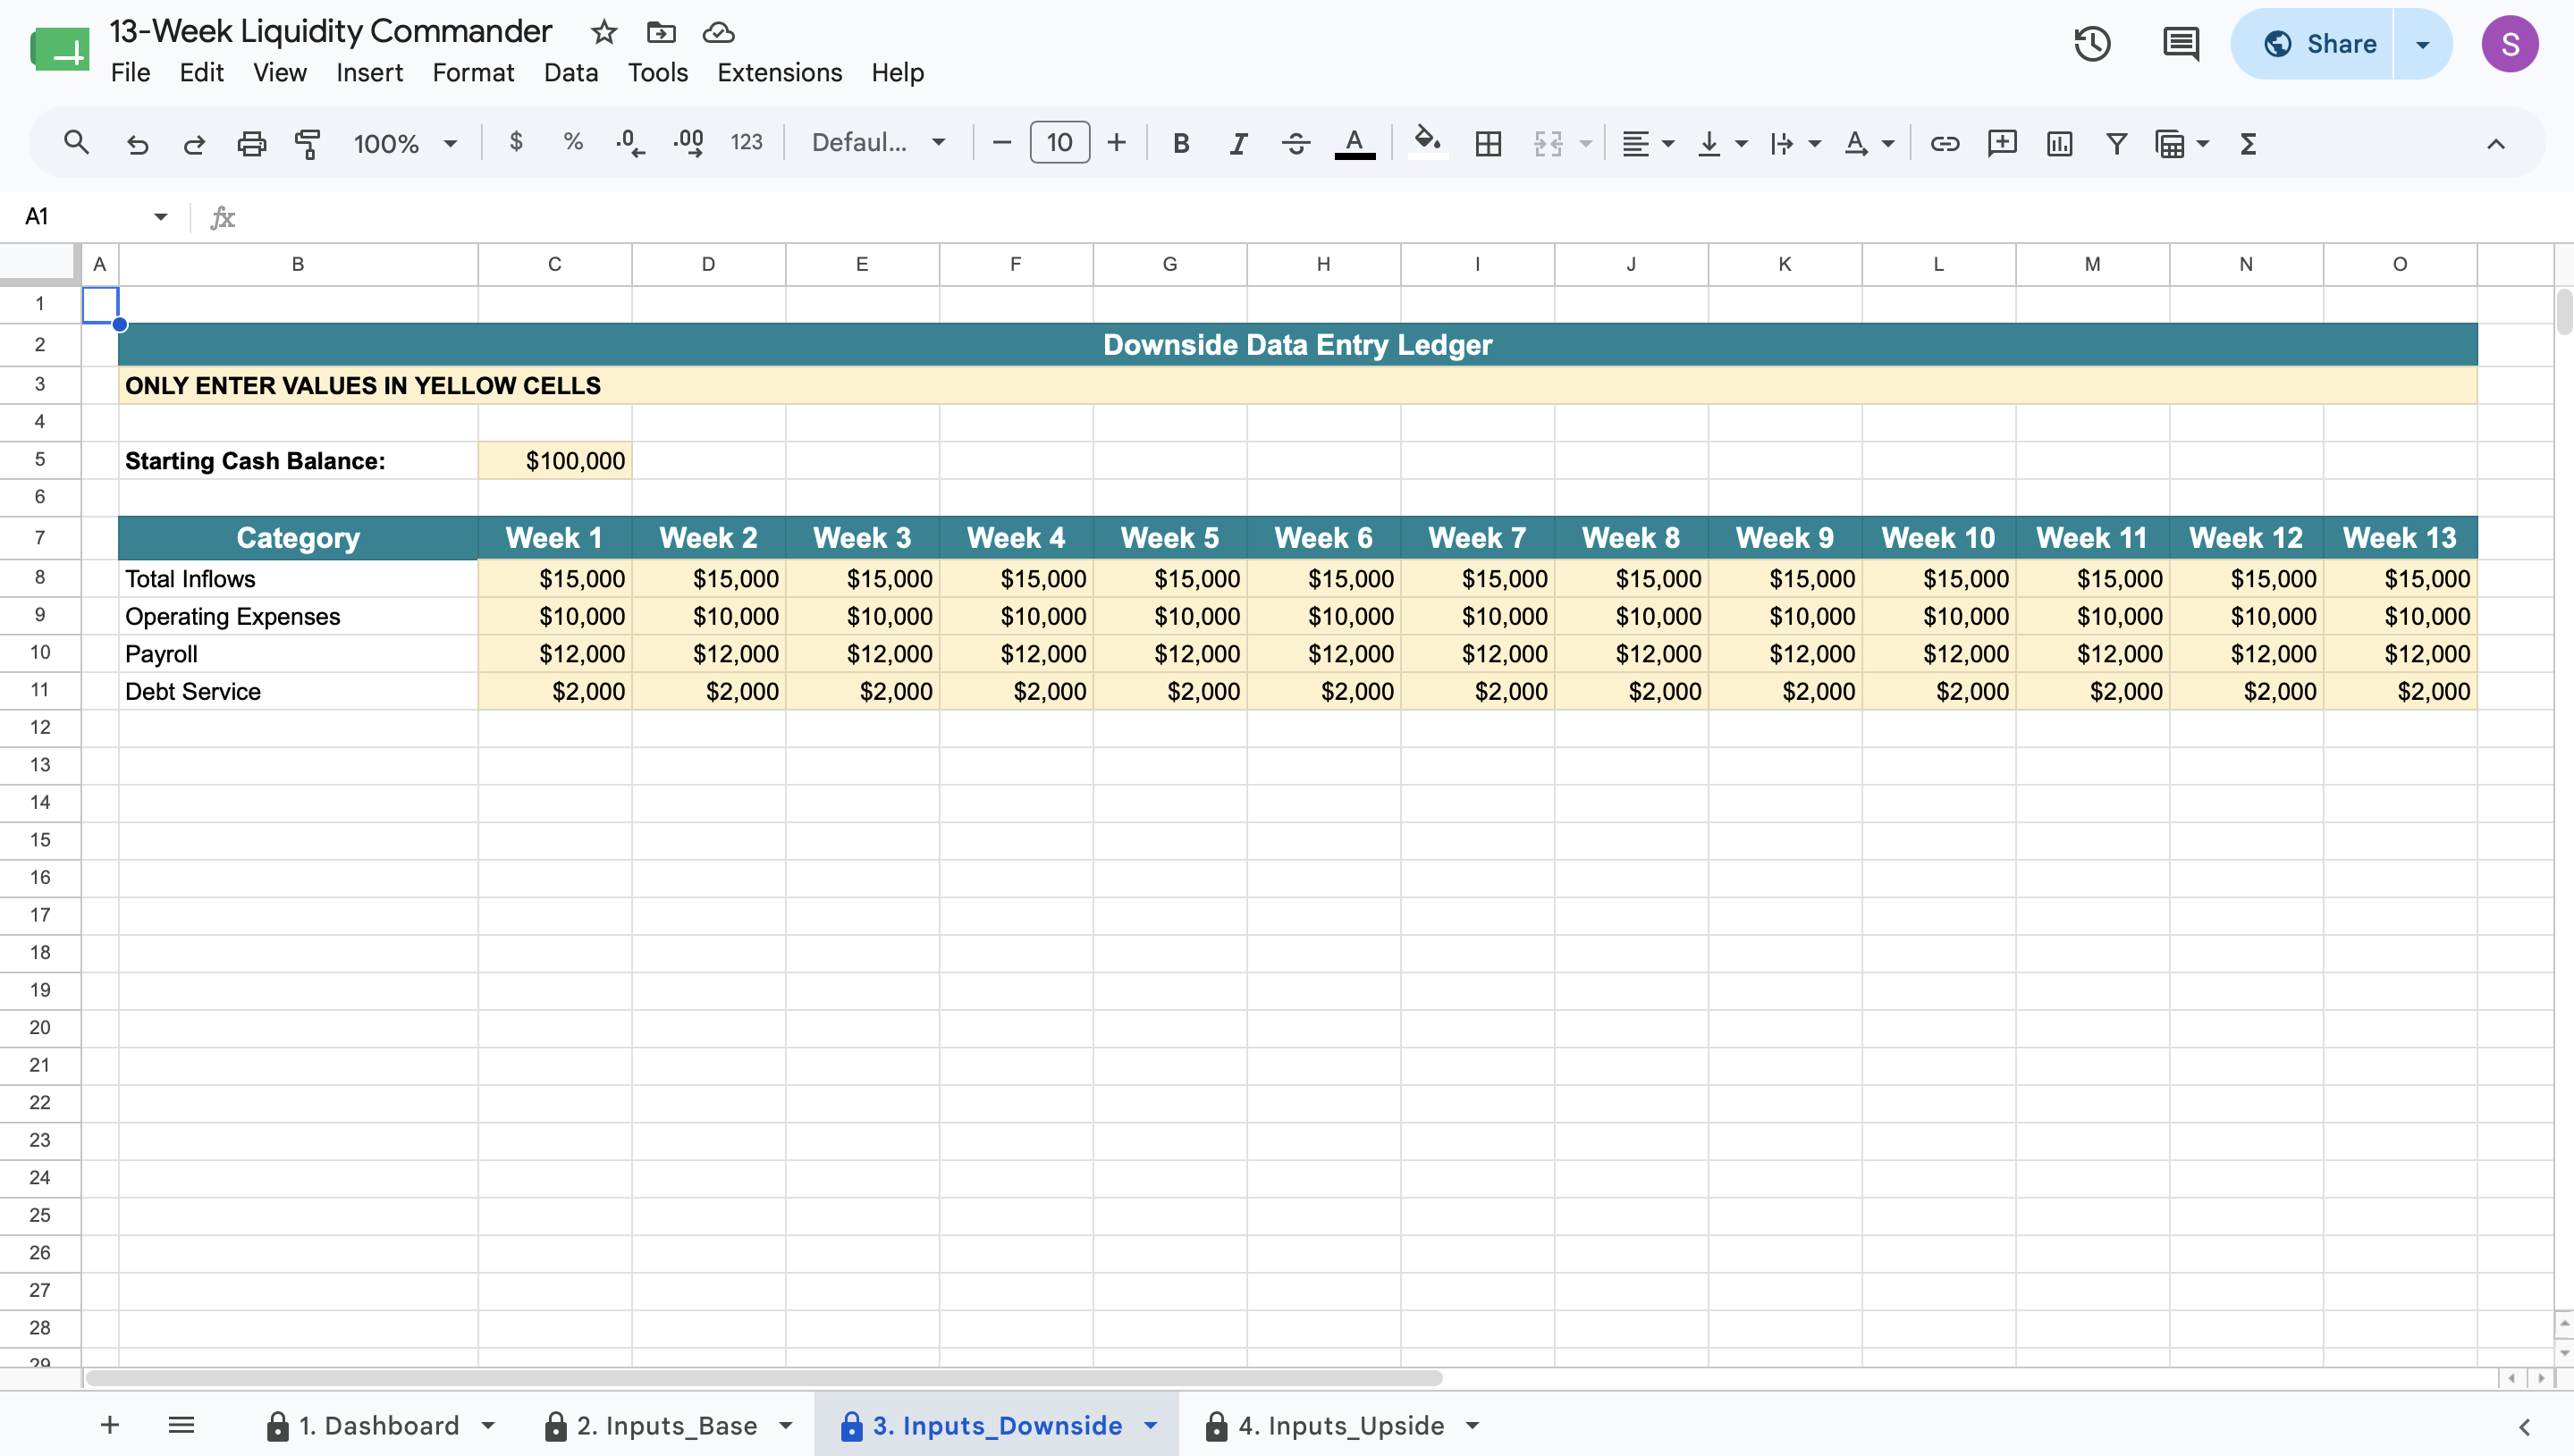
  • Dynamic Scenario Selector: Switch instantly between Base, Downside, and Upside data to evaluate different financial projections.
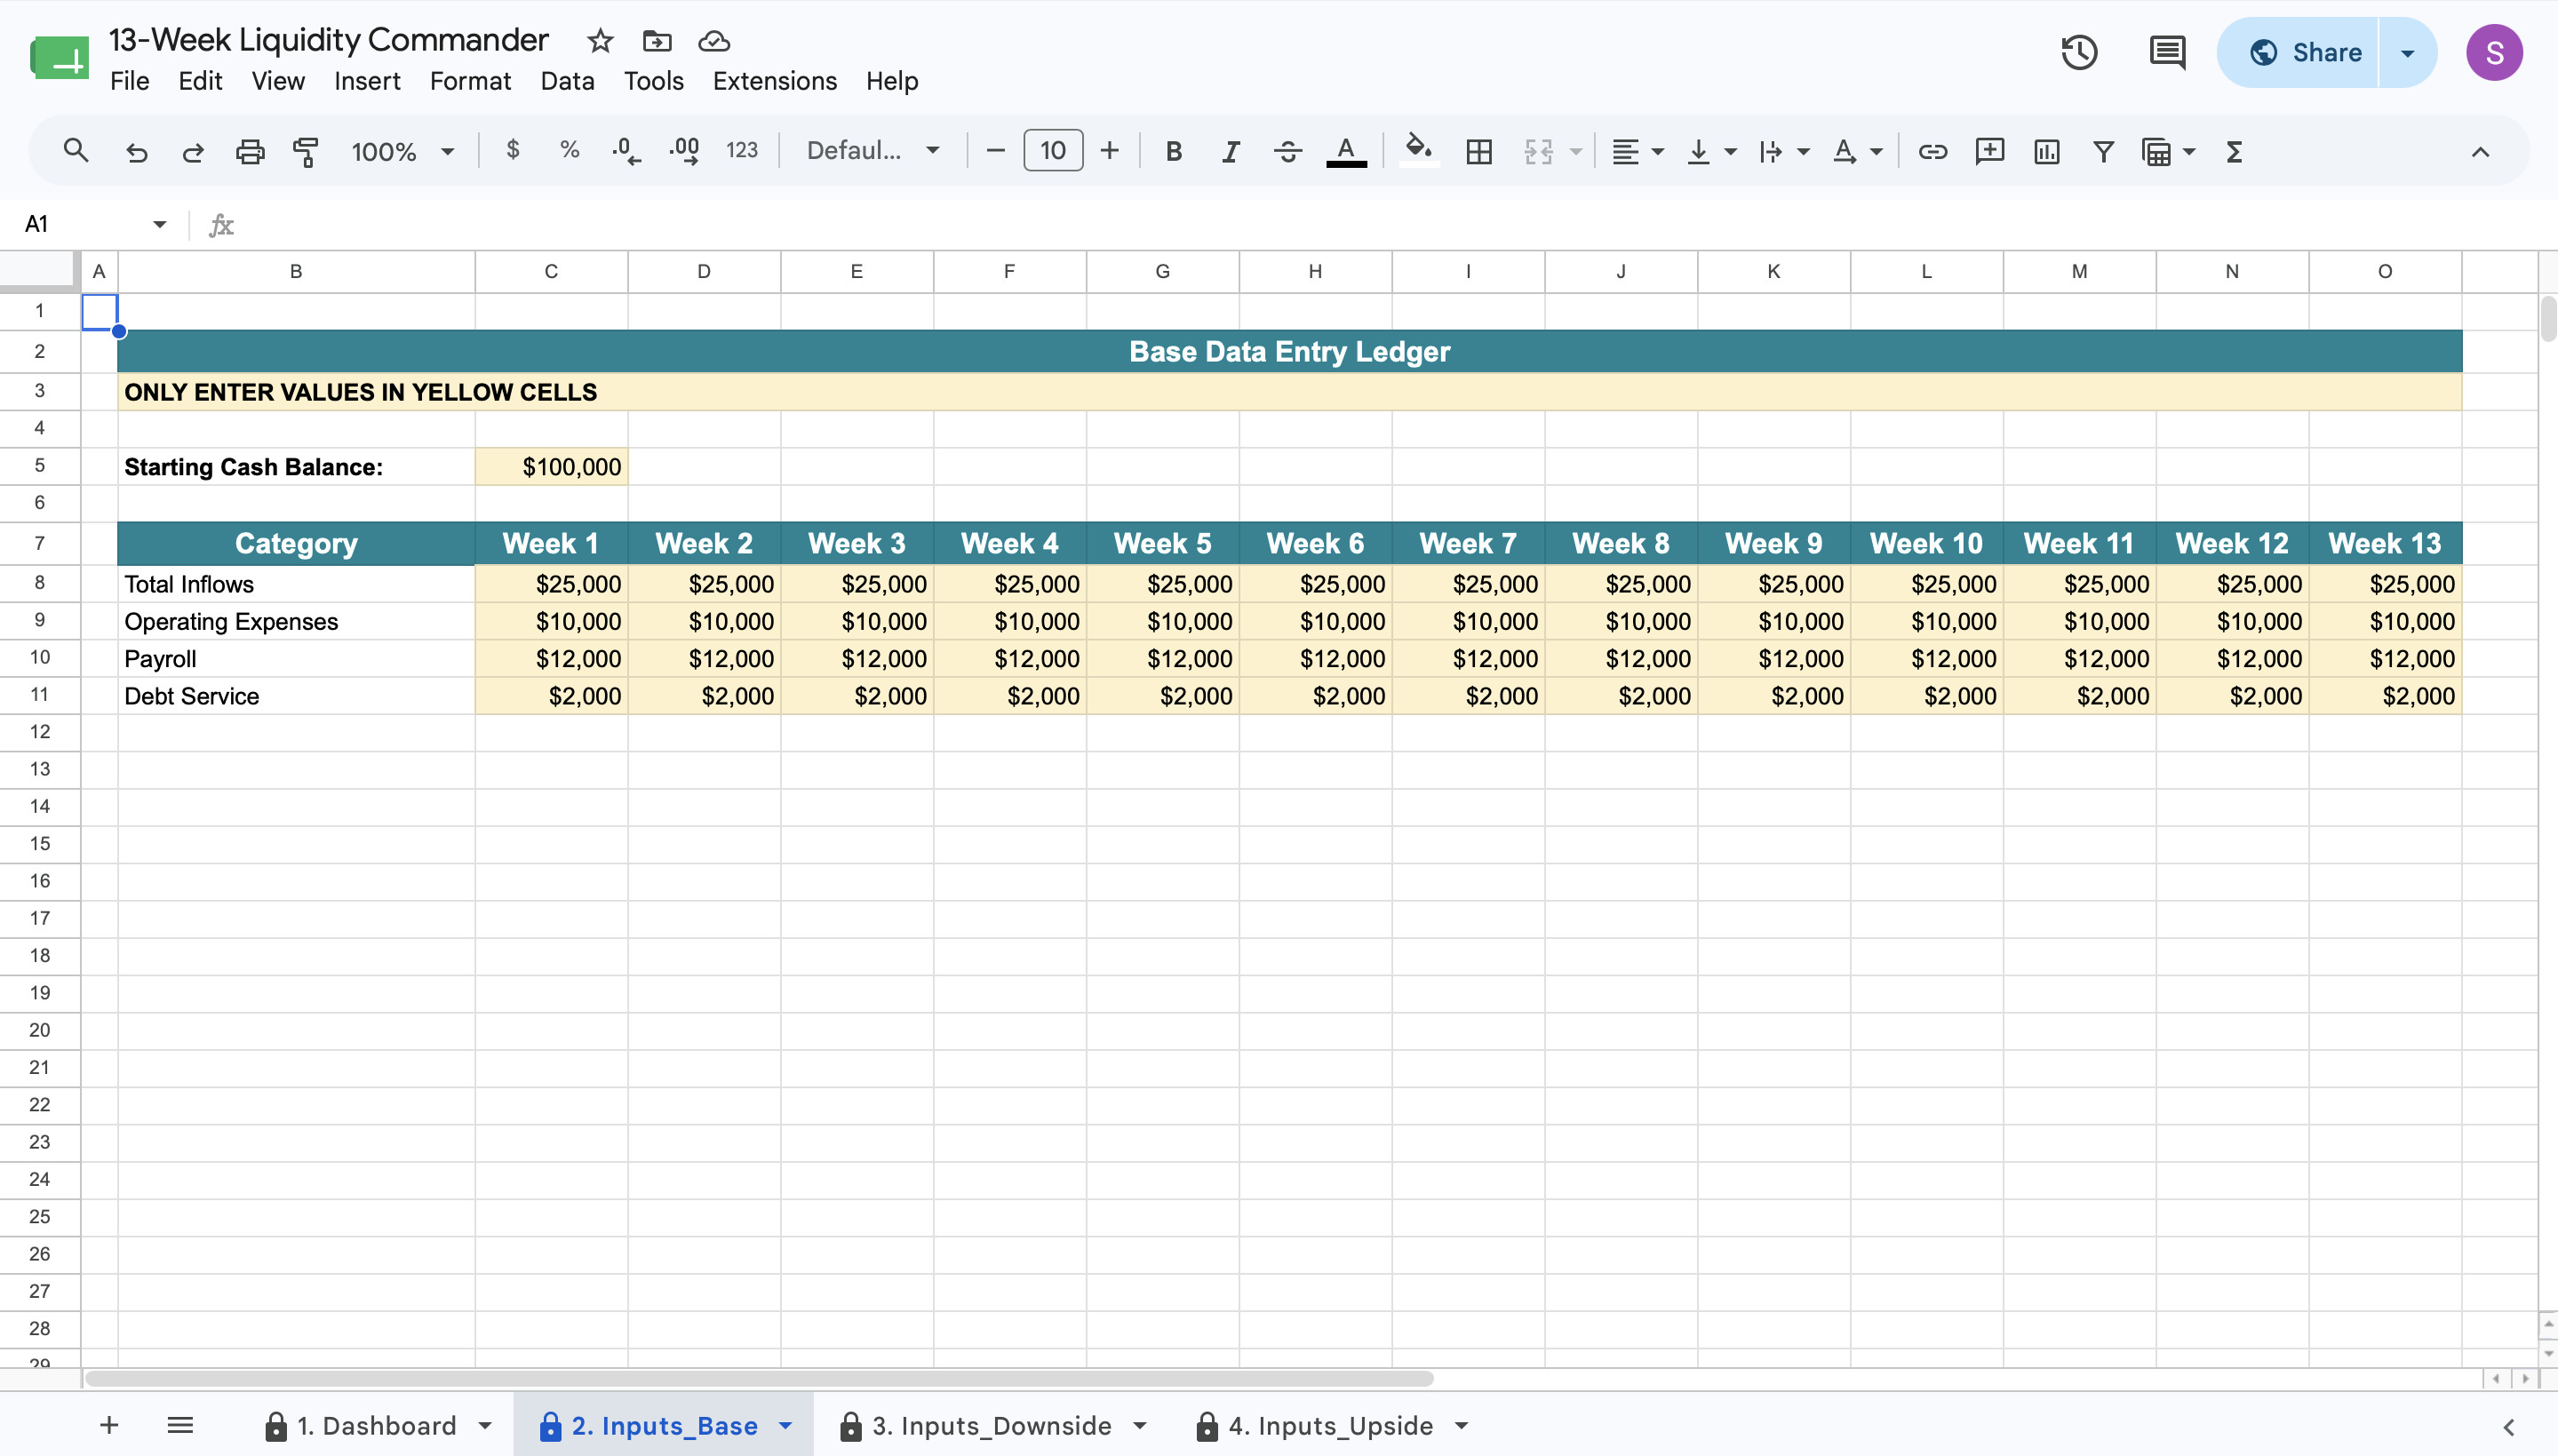
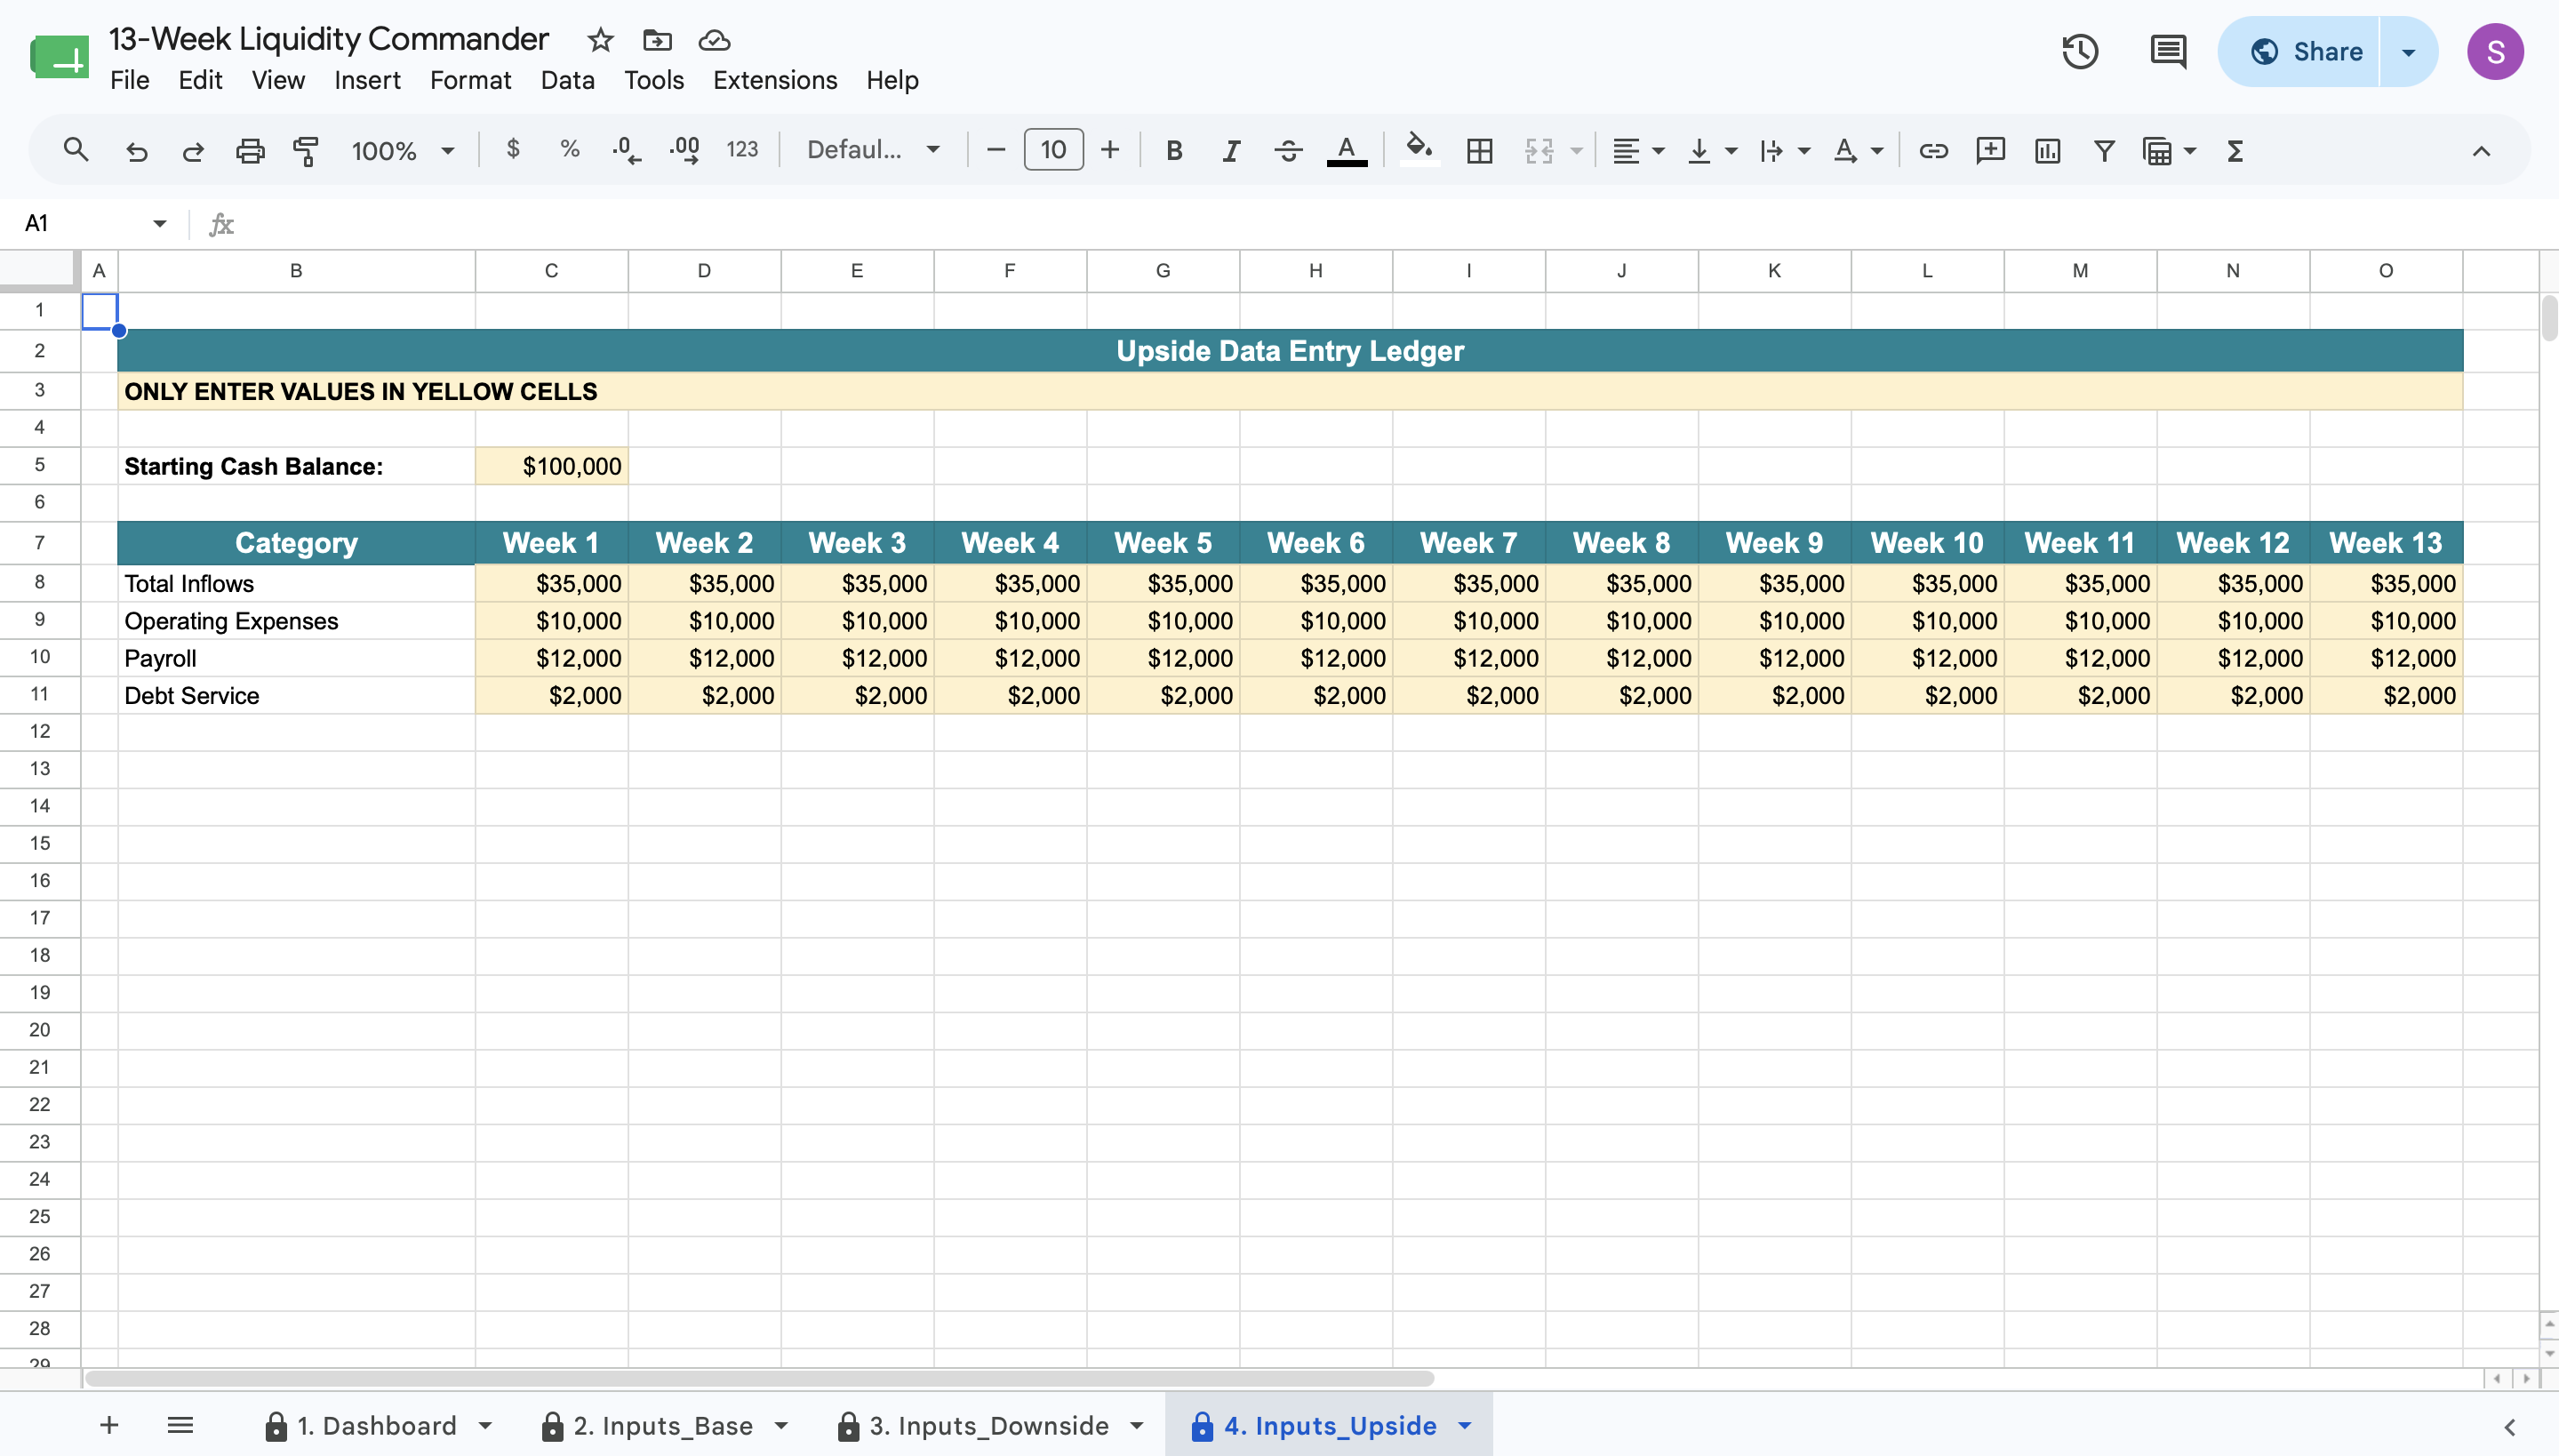
  • Three Scenario Ledgers: Log your expected inflows, operating expenses, payroll, and debt service for each scenario across a 13-week timeline.
  • Safety Threshold Alerts: Establish Warning and Critical cash thresholds to monitor your liquidity limits.
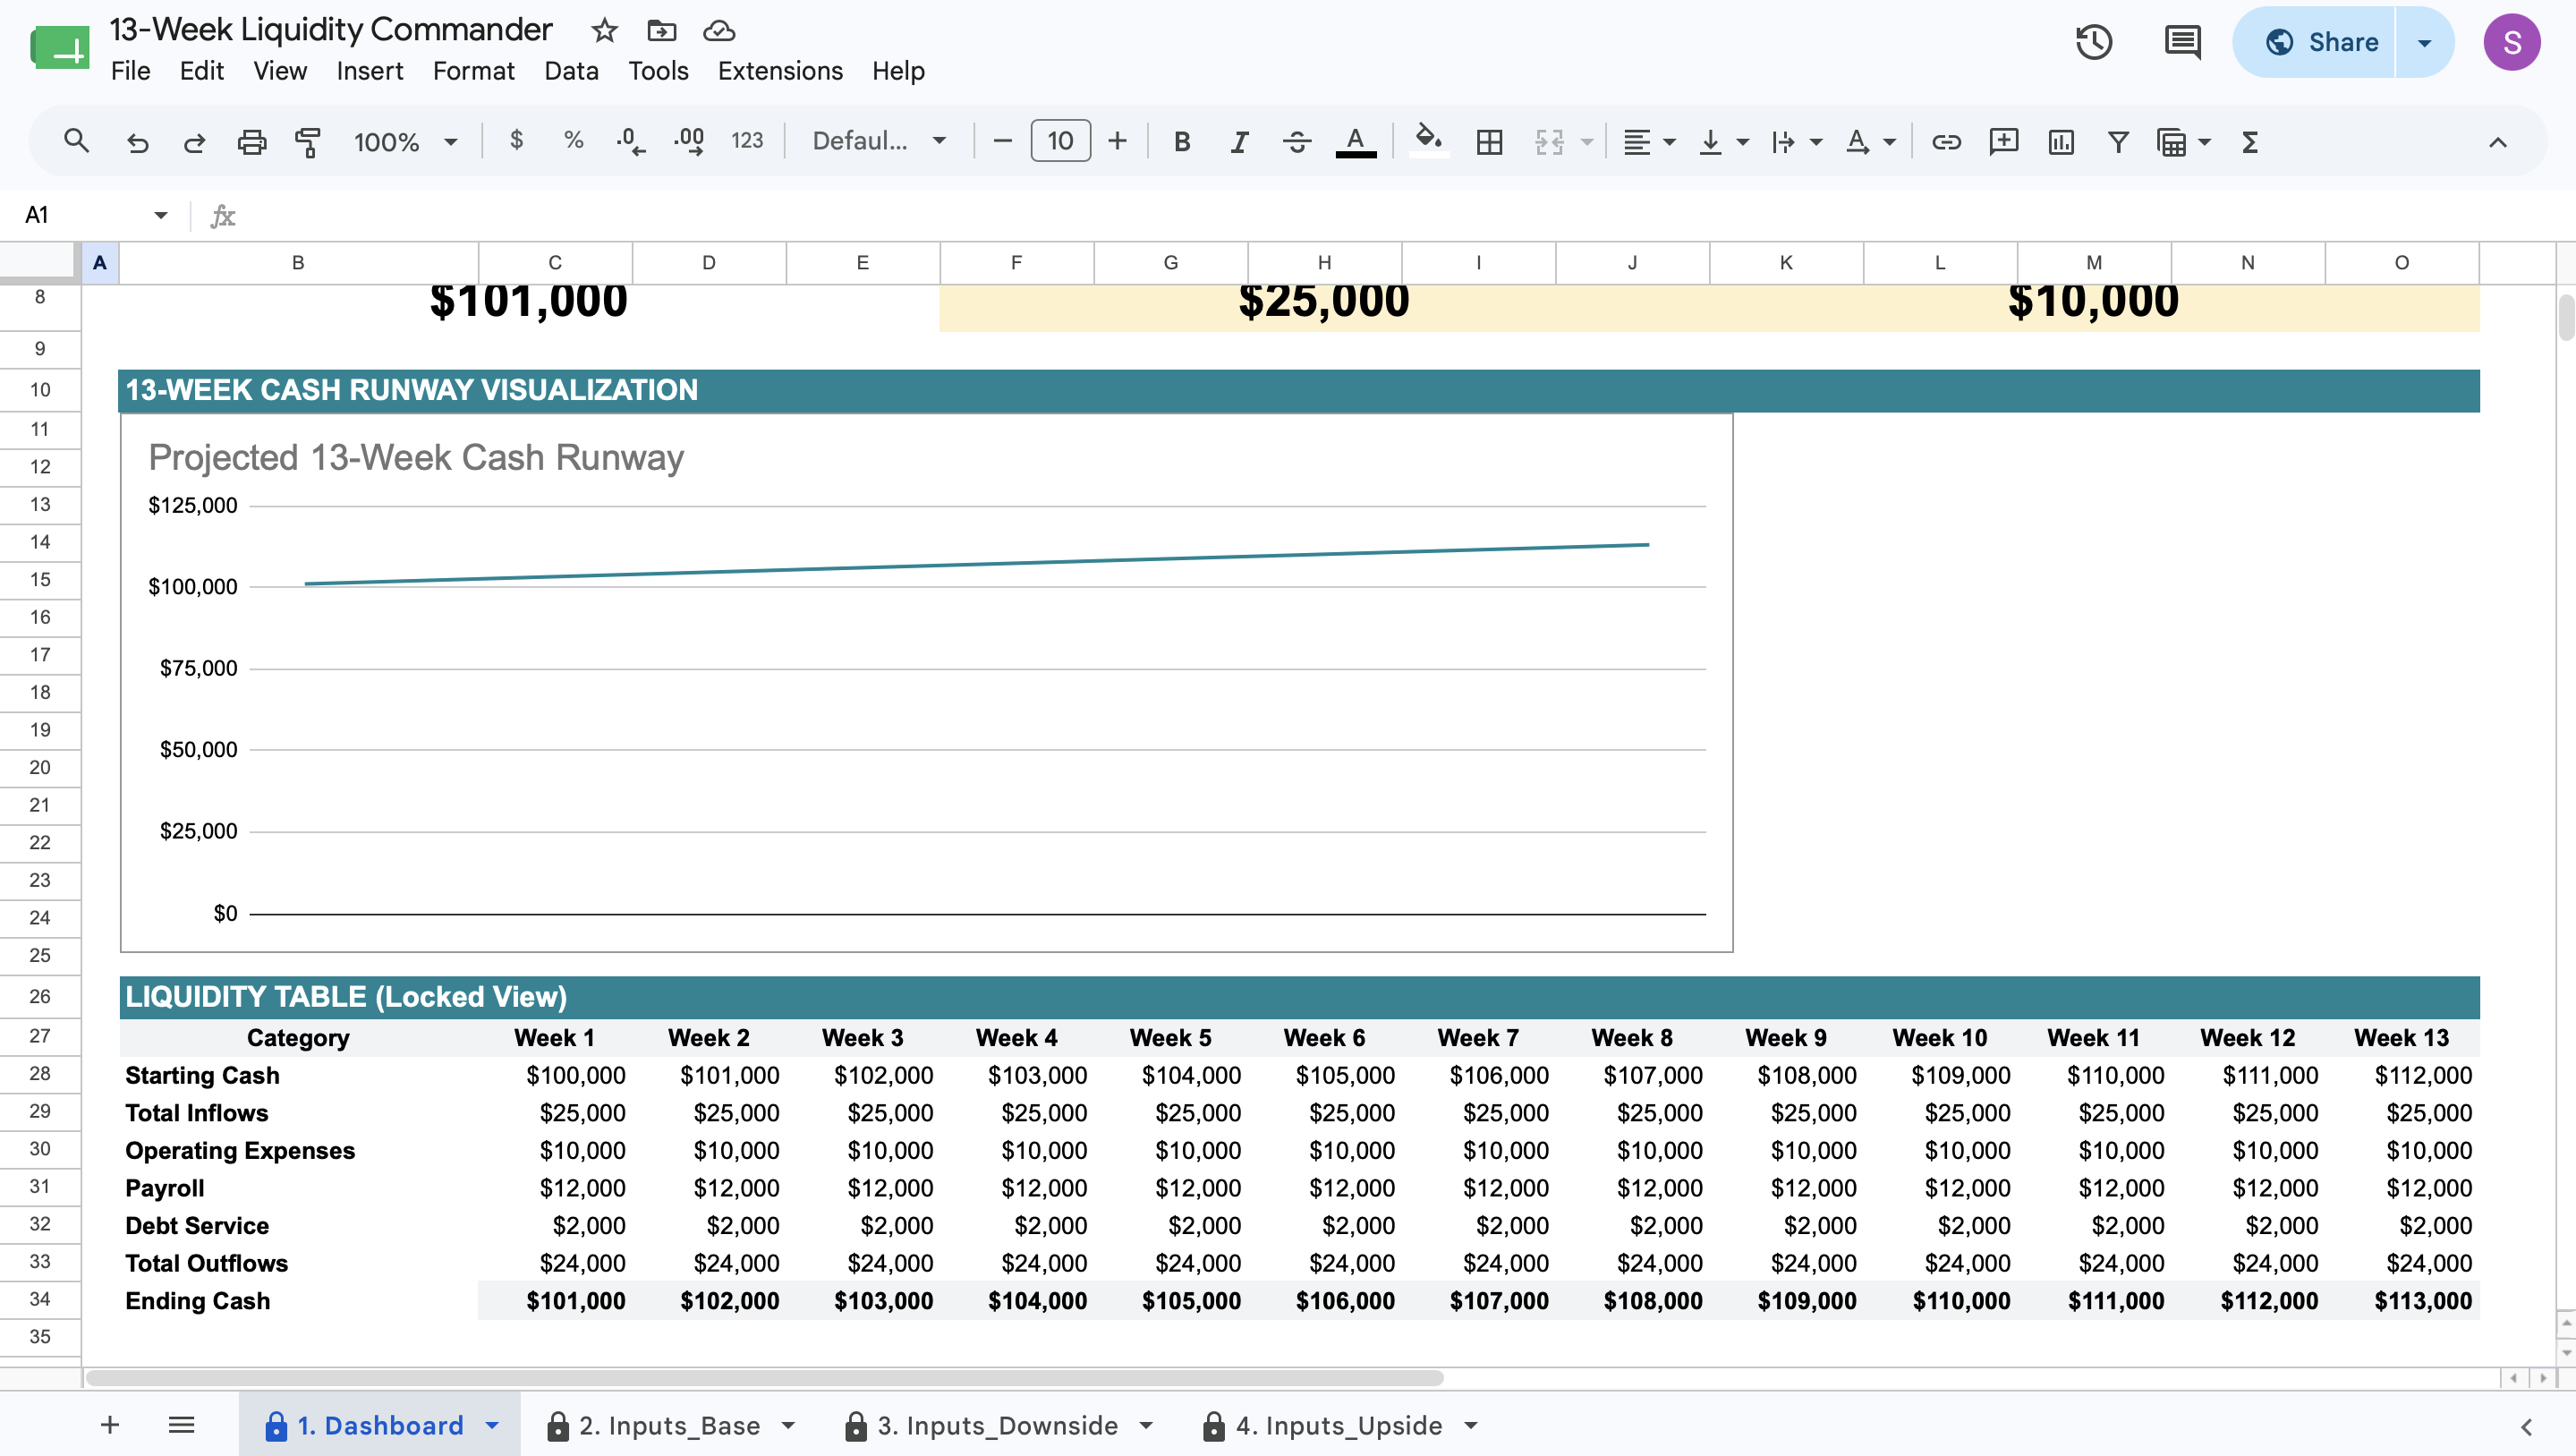
  • Projected Minimum Cash: Automatically identify the absolute lowest your cash balance will drop during the selected 13-week period.
  • Visual Runway Dashboard: Review a dynamic line chart and a locked waterfall table to track your week-by-week cash trajectory.


Deployment & Prerequisites

  • Included Assets: 1 Native Google Sheets Template, 1 Step-by-Step User Guide, 1 Technical Spec Sheet.
  • Format: Native Google Sheets Template
  • Prerequisites: A free Google Workspace or Gmail account (Not compatible with Microsoft Excel)
  • Time to Deploy: Under 15 minutes (Input your macro parameters into the yellow cells; calculations run automatically)

This Best Practice includes
1 User Guide (PDF), 1 Google Sheet

Acquire business license for $20.00 $5.00

Add to cart

Add to bookmarks

Discuss

Further information

Project your weekly cash runway over a rolling 13-week period.


Build distinct financial forecasts based on Base, Downside, and Upside scenarios.


Identify the lowest point your cash balance will drop during the forecasted period.


Provide executive visibility into cash survival using dynamic charts and data tables.

Operations teams needing a standardized template to model 13-week cash flow scenarios.


Business owners requiring a clear view of short-term liquidity to manage operational risks.


Finance leaders seeking a reliable, locked-down alternative to error-prone manual spreadsheets.

Not compatible with Microsoft Excel (requires Google Sheets).


Not a full long-term financial modeling tool (optimized for a 13-week rolling window).


Not a direct replacement for double-entry bookkeeping software.


0.0 / 5 (0 votes)

please wait...