
Originally published: 14/08/2020 17:40
Publication number: ELQ-79558-1
View all versions & Certificate
Publication number: ELQ-79558-1
View all versions & Certificate

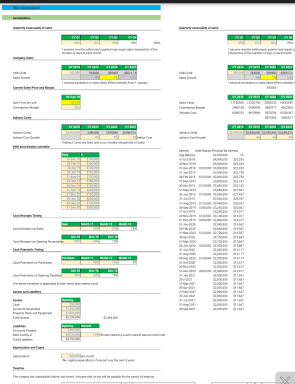
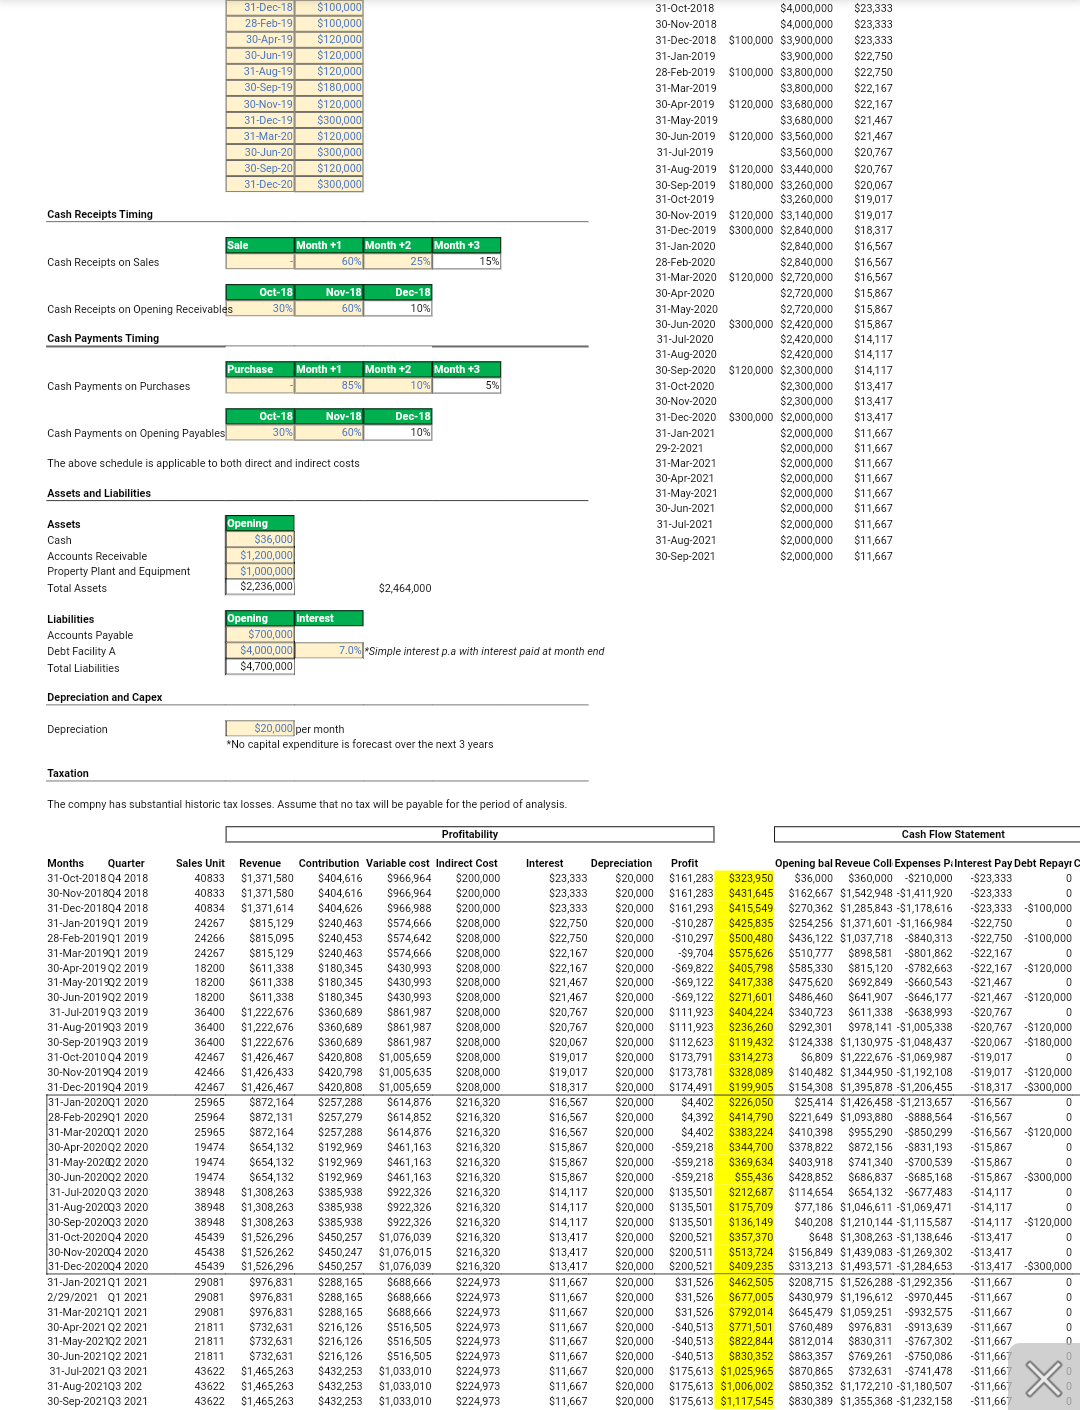
Sensitivity Analysis
What-if analysis in Microsoft Excel for anyone to use.
Financial Analyst with 13 years experience. Specialized in feasibility studies and financial plans.Follow
