Originally published: 06/12/2017 15:17
Publication number: ELQ-91116-1
View all versions & Certificate
Publication number: ELQ-91116-1
View all versions & Certificate

Excel Workbook for Calculating Revenues & Costs of Water Fabrication
This Excel Workbook provides models to help you calculate revenues and costs of water fabrication.
Description
This workbook presents spreadsheet models in excel that you can use to calculate revenues and the costs of water fabrication. The intention here is to provide an engineering analyst with the tools to evaluate the impact economically of process and equipment changes, process/equipment installation timing changes, changes in the time it takes to ramp up die yield, and manufacturing cycle time changes. Cash flows are computed for both cash flows for expenditures and revenues from fabrication.
Currently, the models make the assumption that the fabrication line operates a single process technology that will consist of up to 300 major process steps using max. 50 major kinds of process equipment. The user is able to compute revenues and costs for 1 out of 2 basic cases:
1. Wafer start volumes being pre-specified over a period of time
2. Equipment counts are pre-specified over a period of time
In the first case, reduced process times or higher equipment efficiencies will result in decreased investment in facilities and equipment to accommodate the wafer starts that have been pre-specified. Higher yields in this case will result in decreased investment costs as well as revenues that are higher for given wafer start volumes. In the second case, reduced process times or higher equipment efficiencies will result in higher wafer throughput for the given equipment set, and therefore both lower costs and higher revenues per wafer. Higher yields here will therefore result in a higher die throughput for the given equipment set and both lower costs and higher revenues per wafer.
An enhanced version of SEMATECH's Cost-resource Model is used to calculate the fab expenses. The model accounts for expenses generated by fab construction and operation. To compute die costs and wafer, all die and wafers produced throughout the technology's life, are all burdened with capital expenses equally. The main differences in comparison to CRM are:
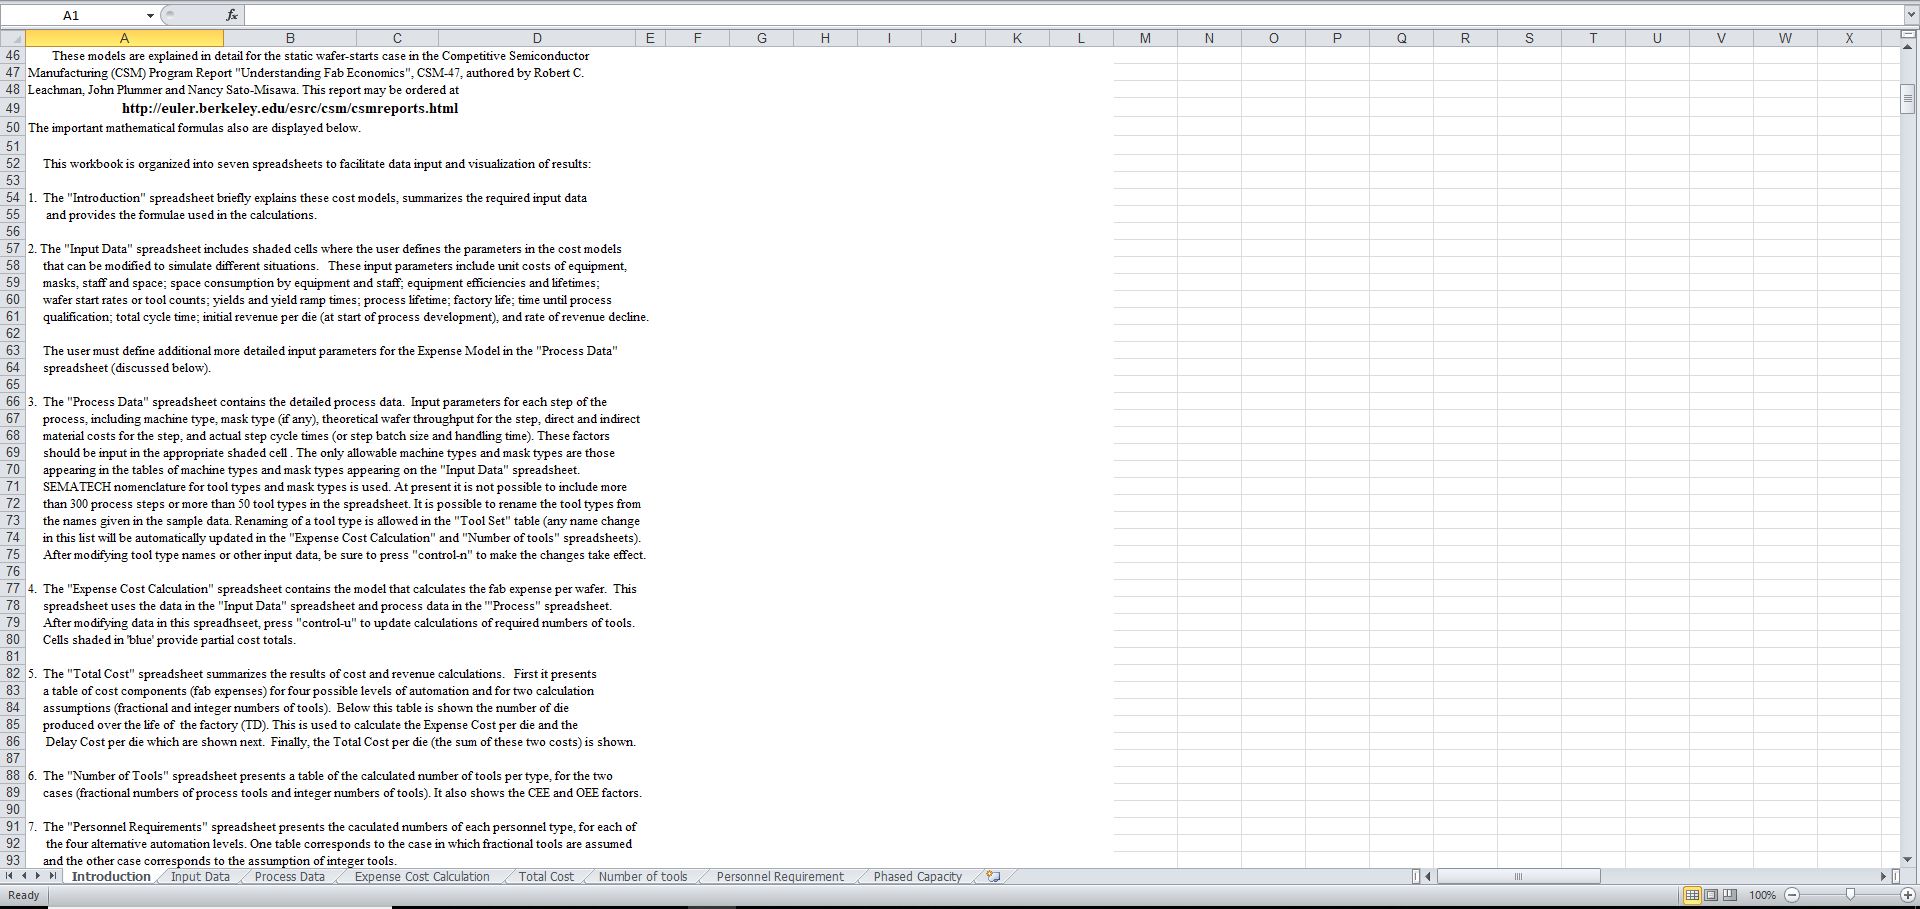
1. Staffing costs are computed for various levels of fab automation
2. Rather than average throughput rates and availability, equipment performance is defined by the user in terms of theoretical throughput rates and CEE.
When you calculate the fab revenues, it will account for a user-specified reduction in die prices over time. Delays for fab construction, equipment installation and qualification, process development and qualification, manufacturing cycle time, and yield ramp all depress revenues that are obtained from the process technology over the period of its life. The Delay Cost Model presents a die cost equivalent which results from delays for qualification and development, equipment installation and qualification, time to ramp die yield, factory construction, and manufacturing cycle time.
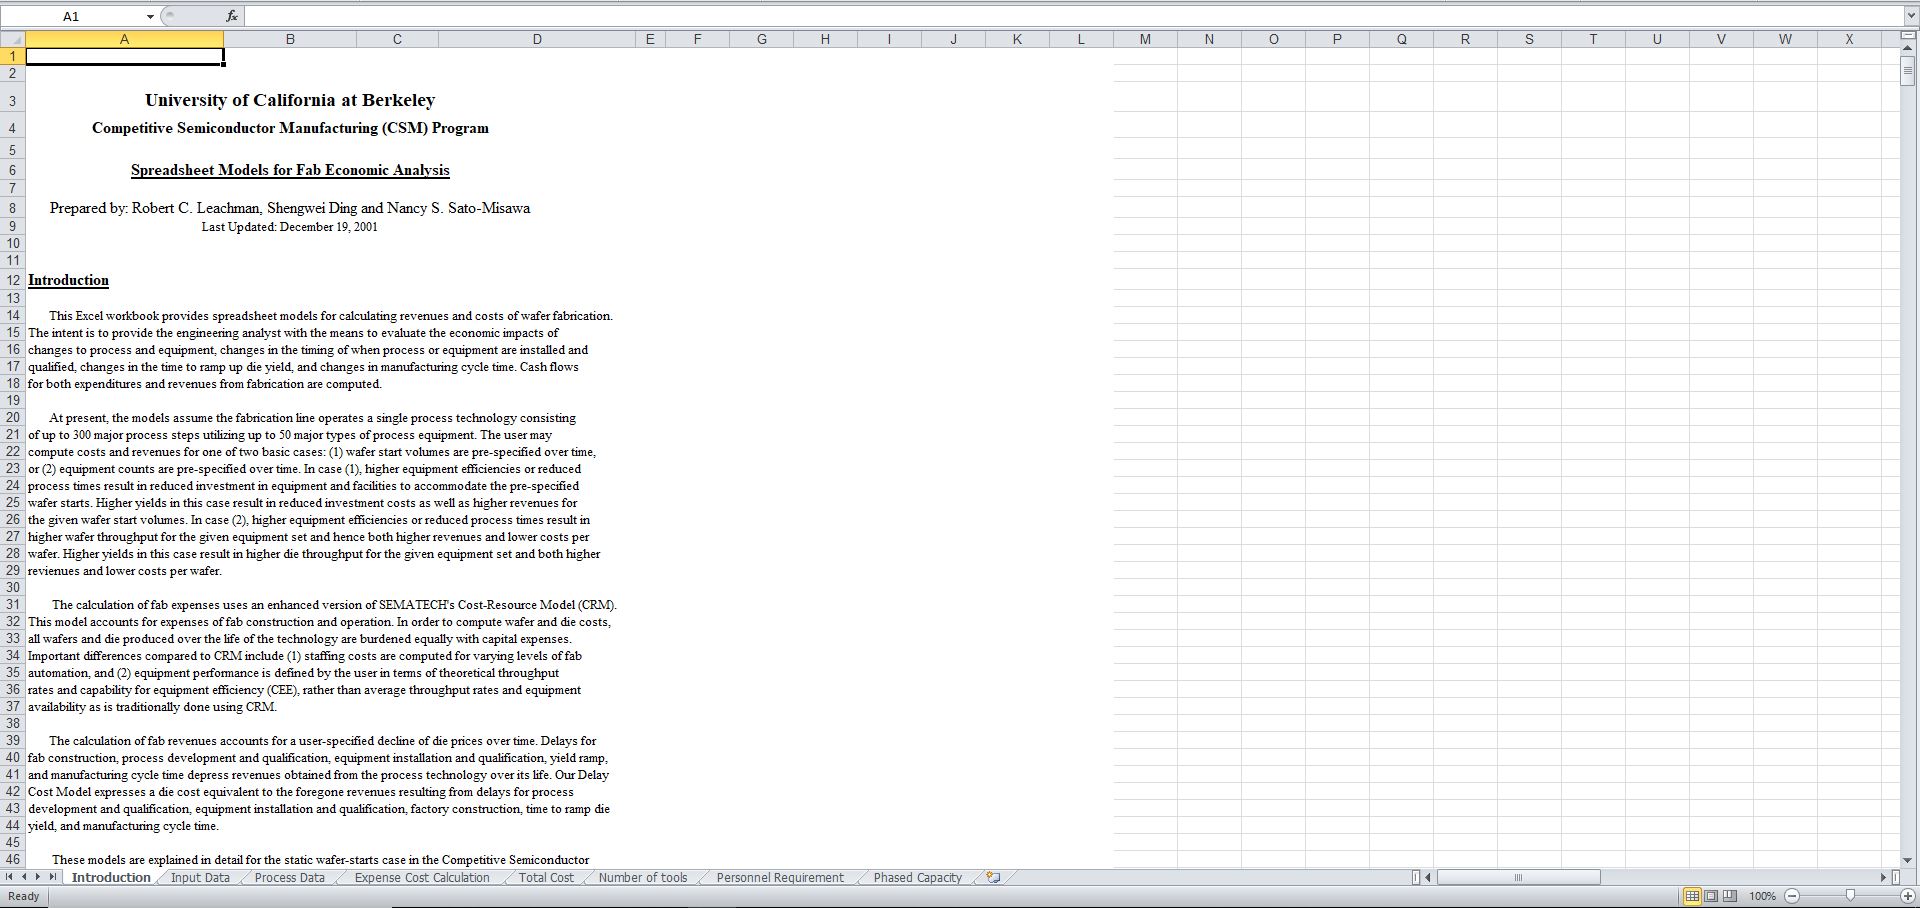
This workbook includes seven spreadsheets:
1. The Introduction
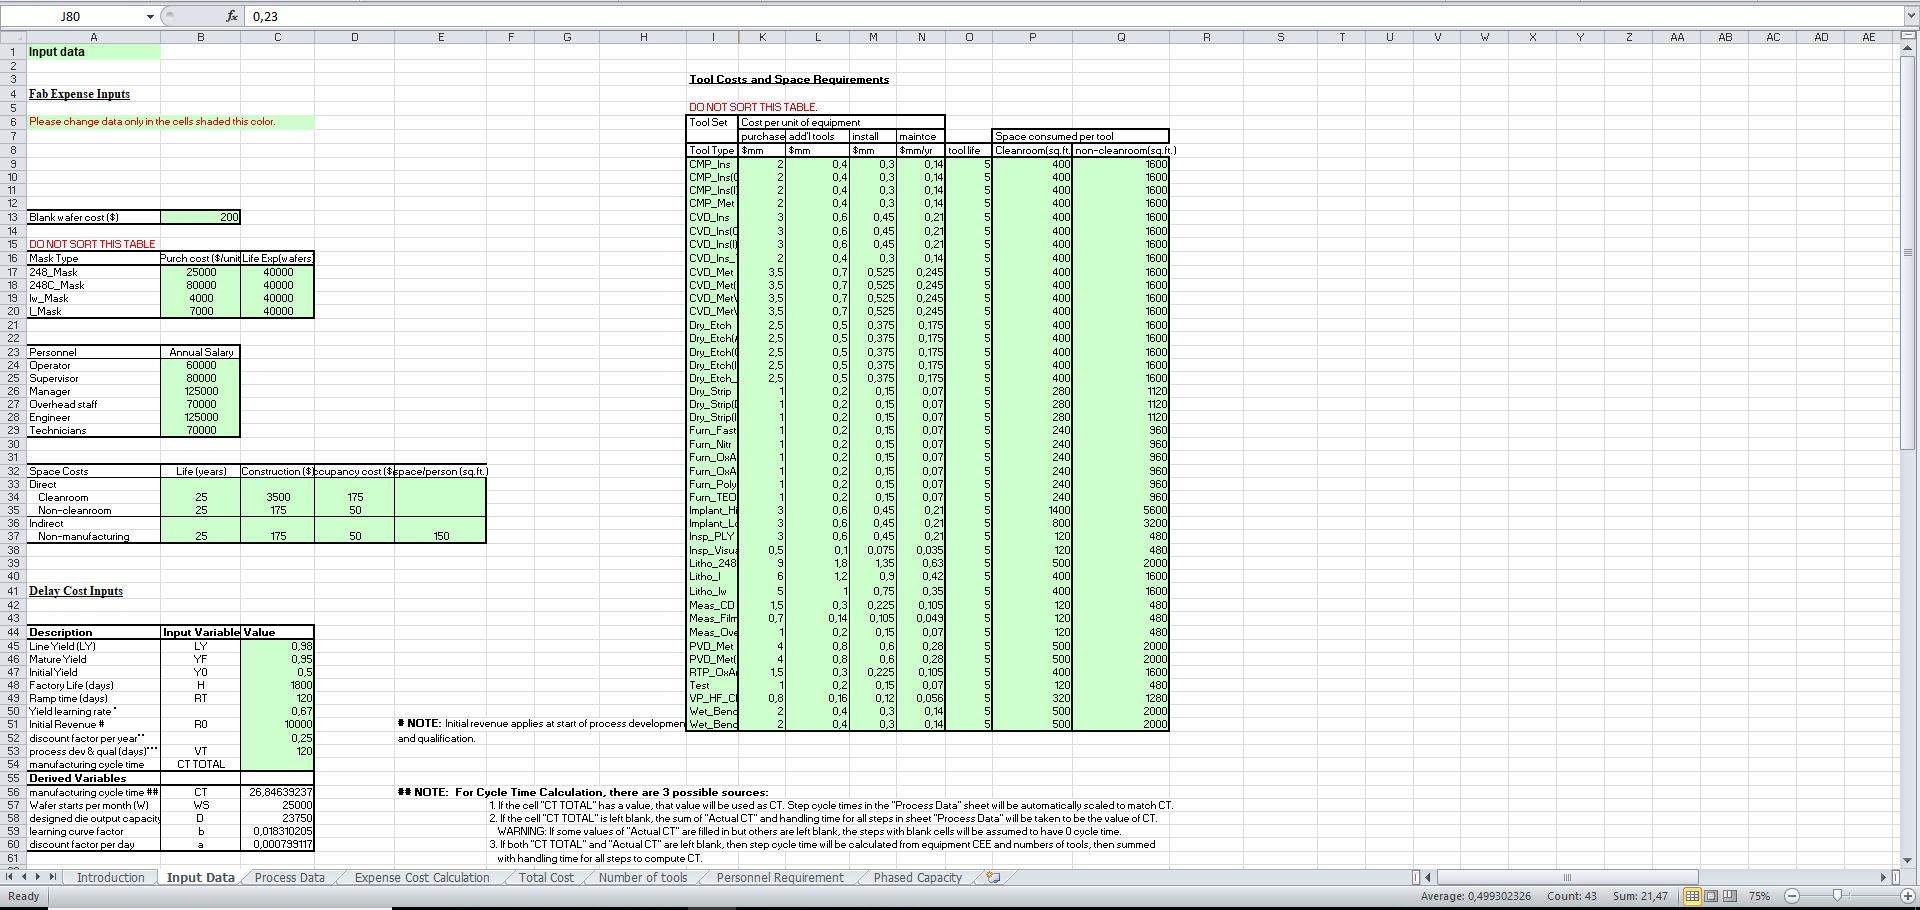
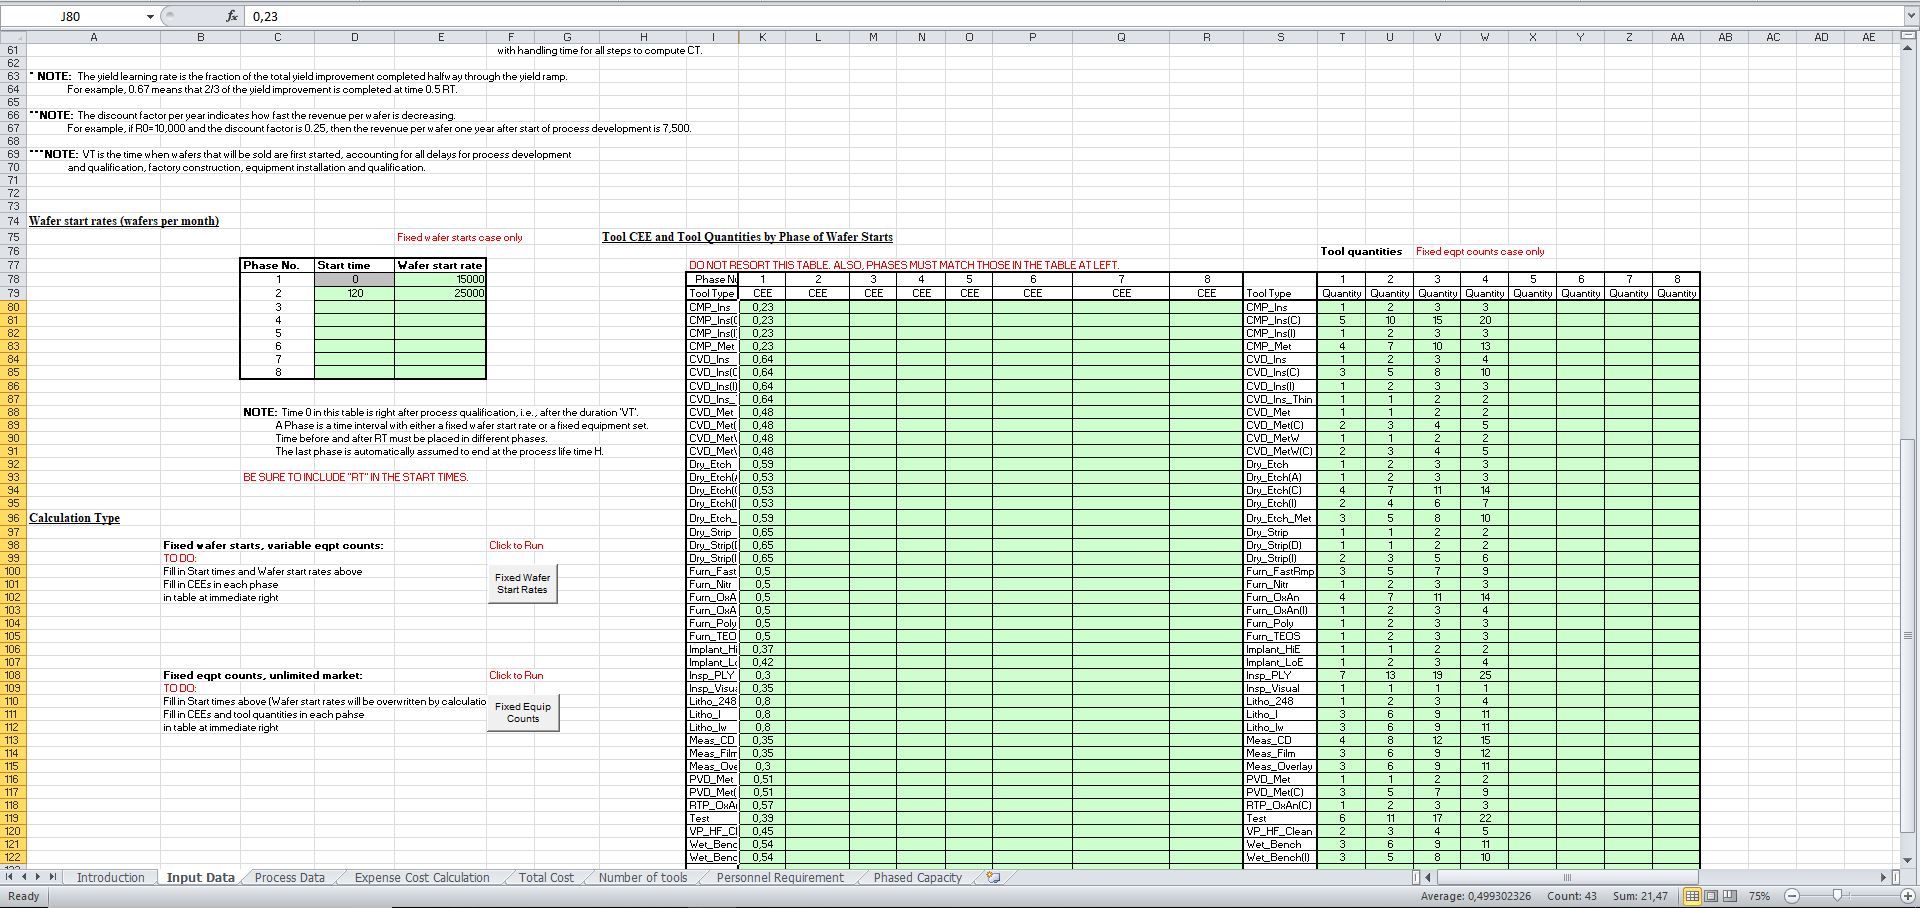
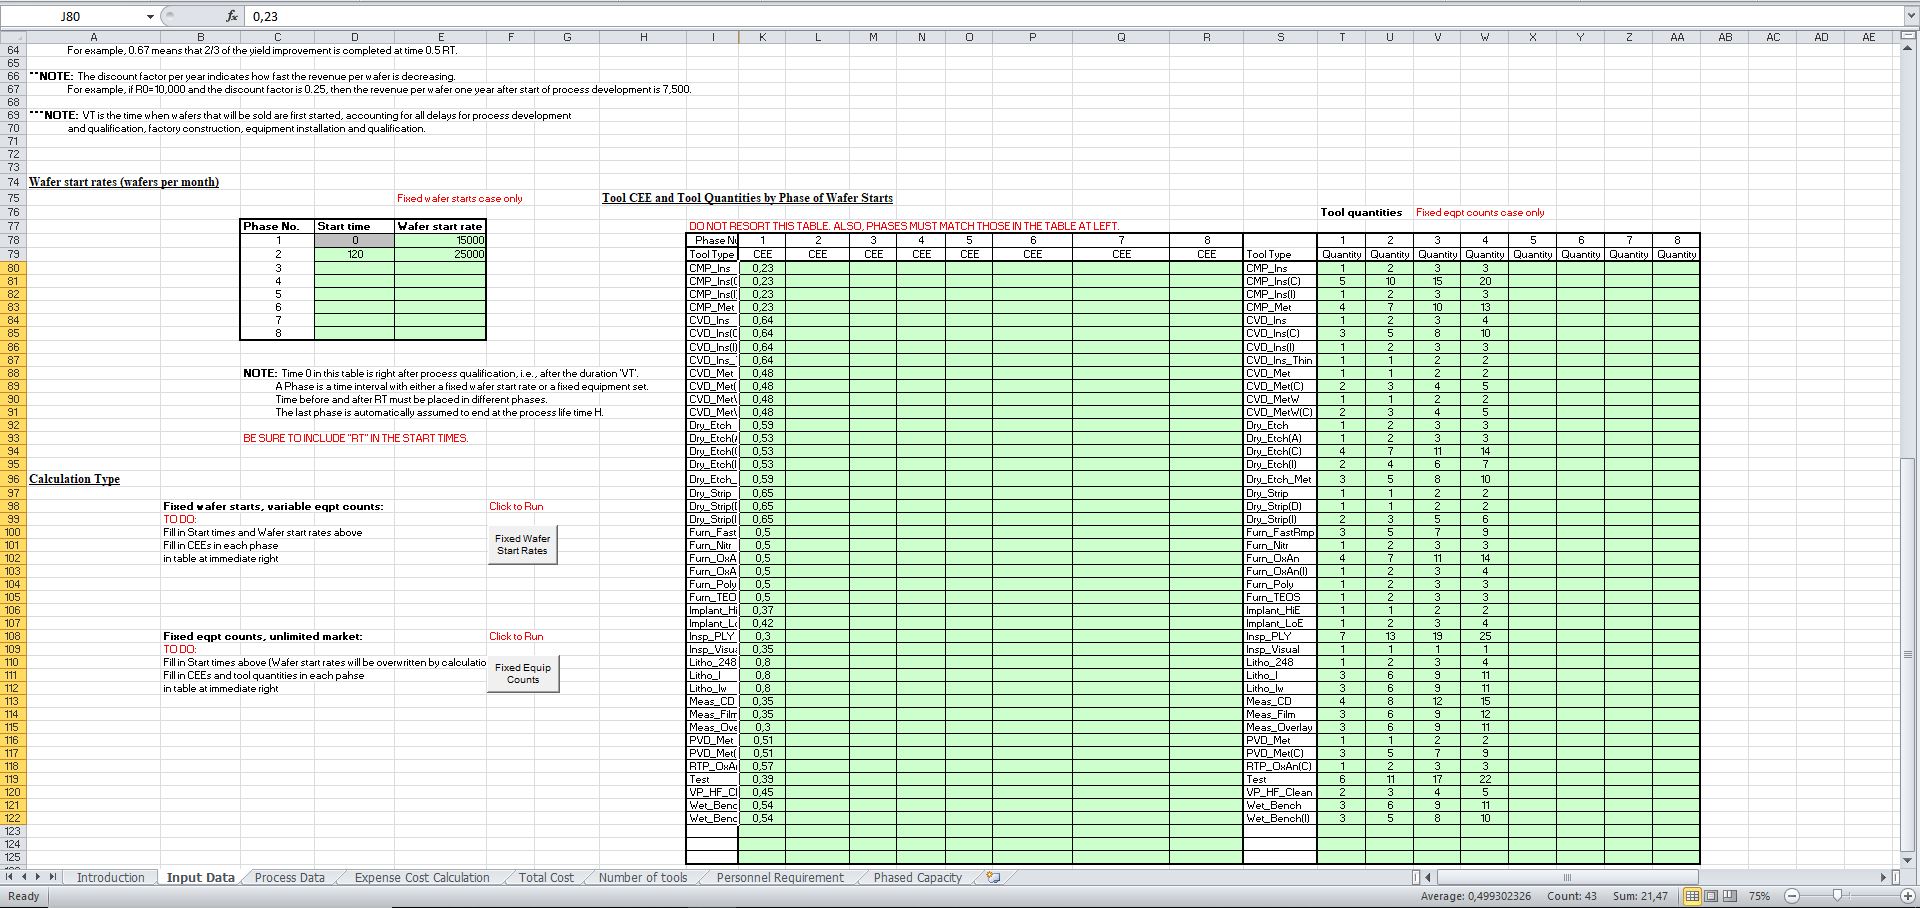
2. The Input Data
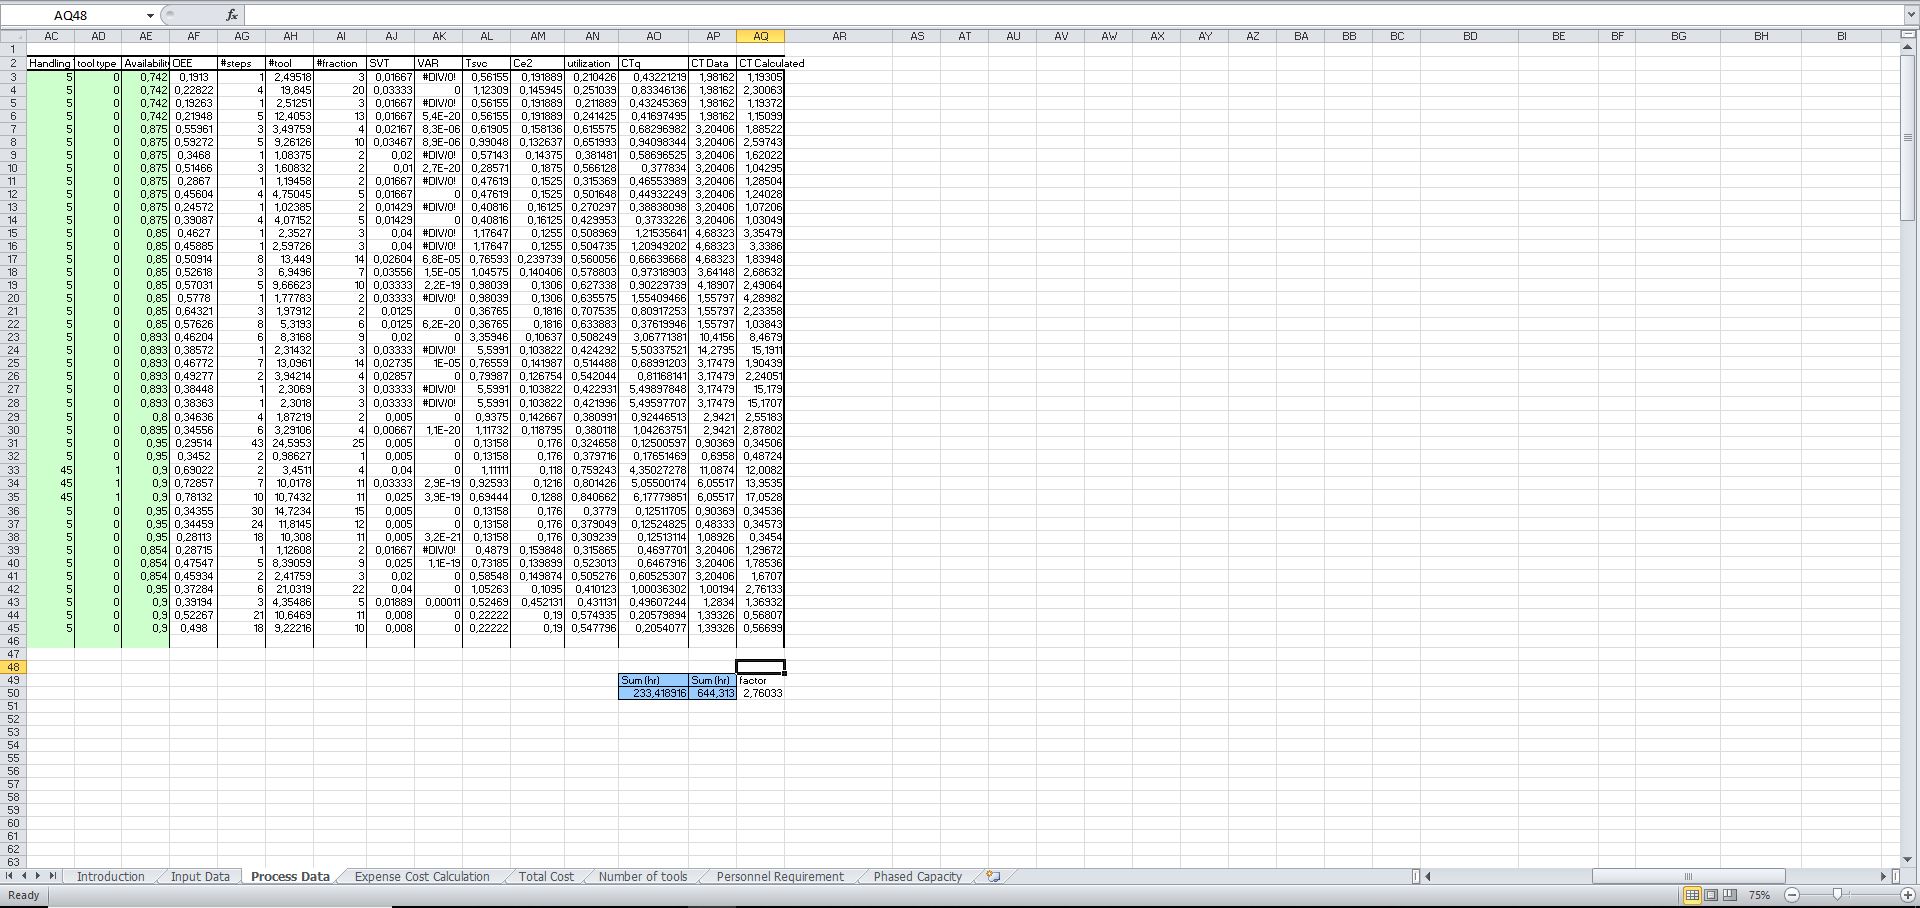
3. The Process Data
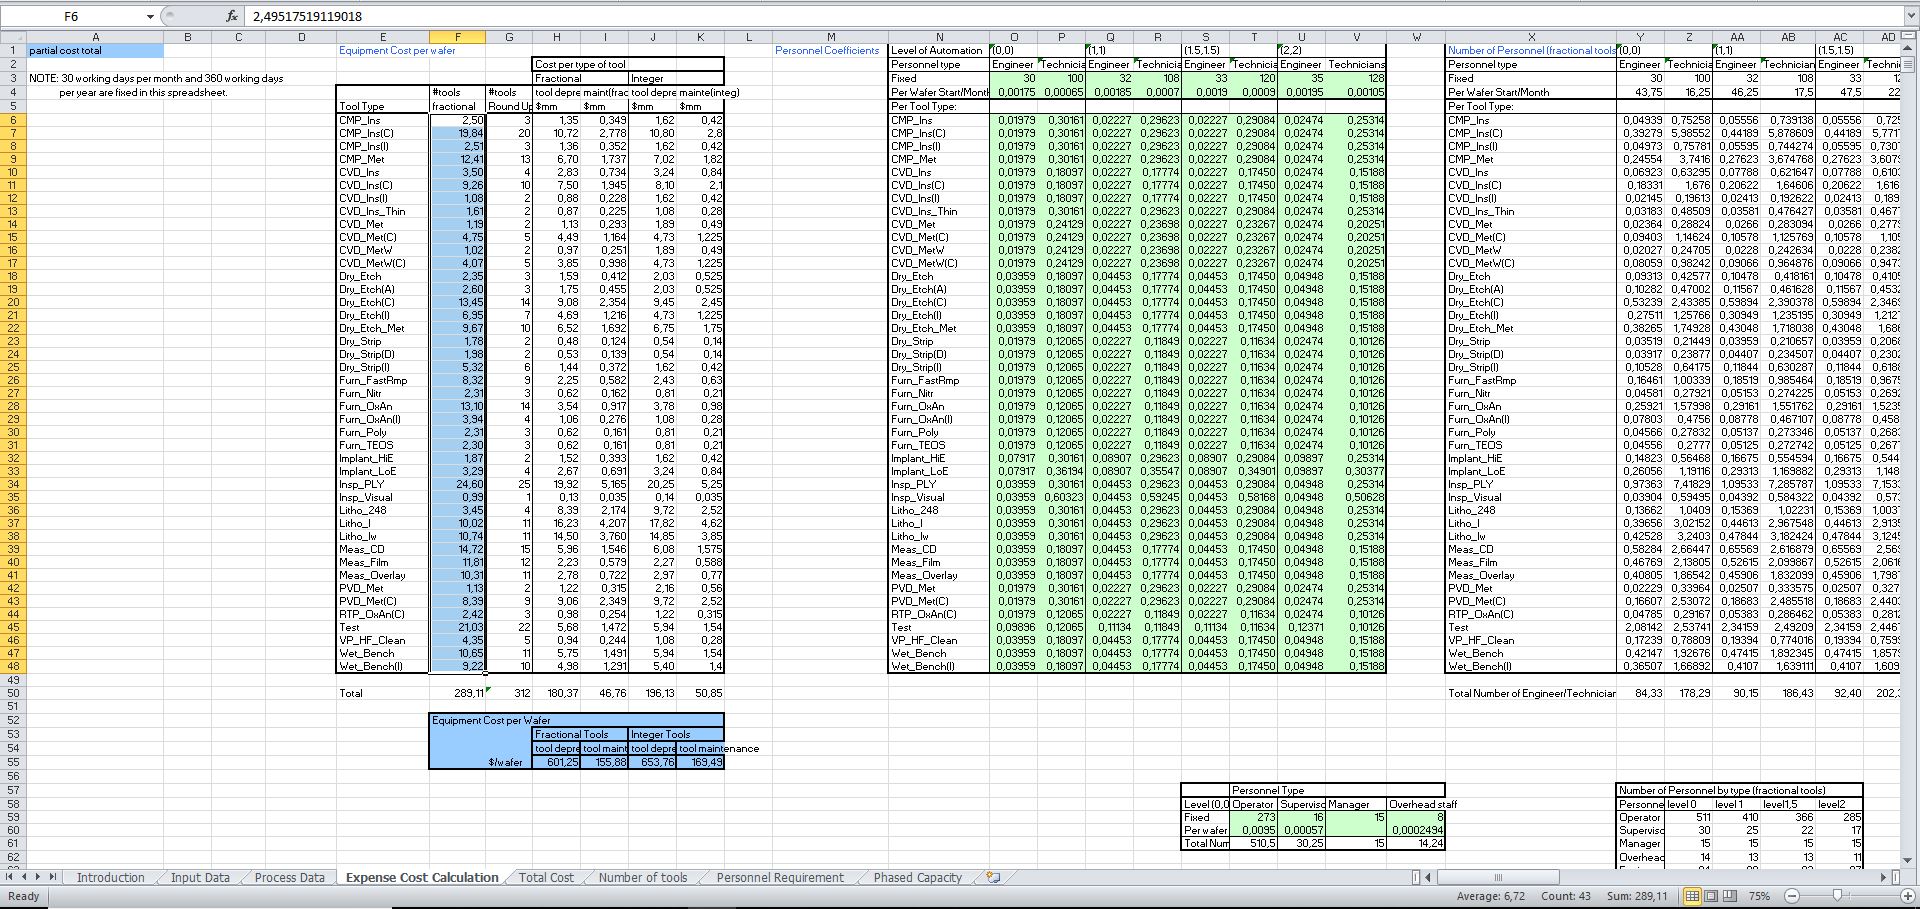
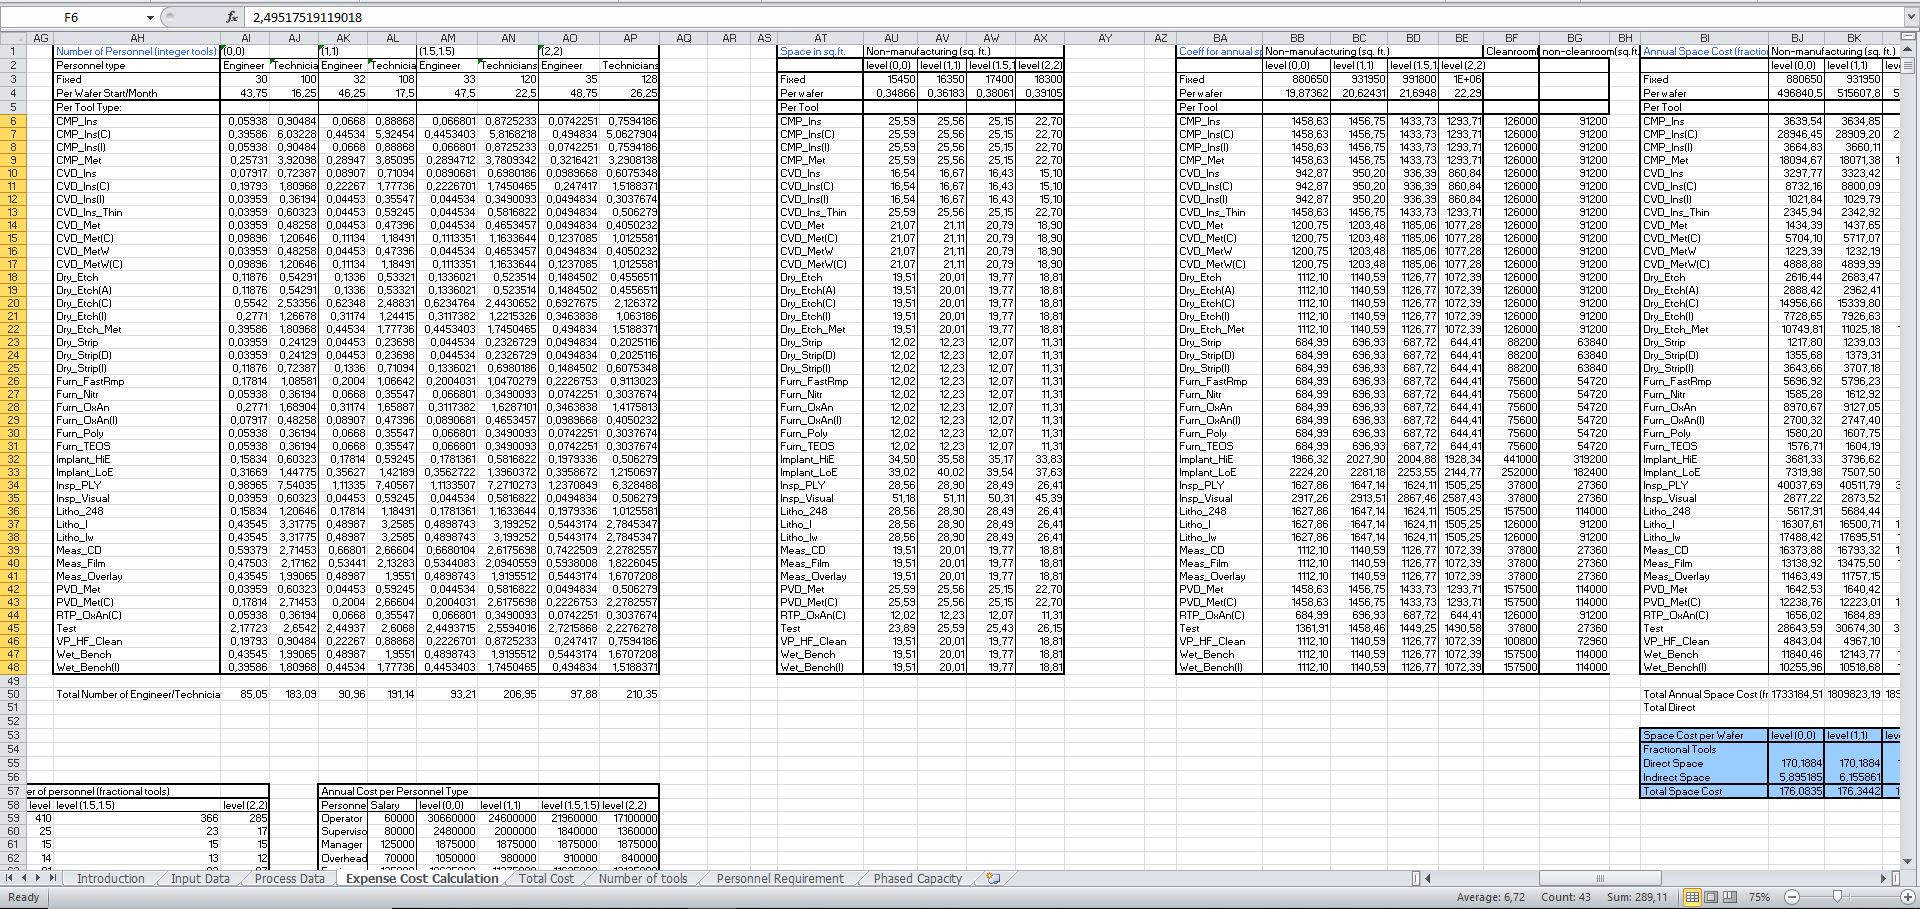
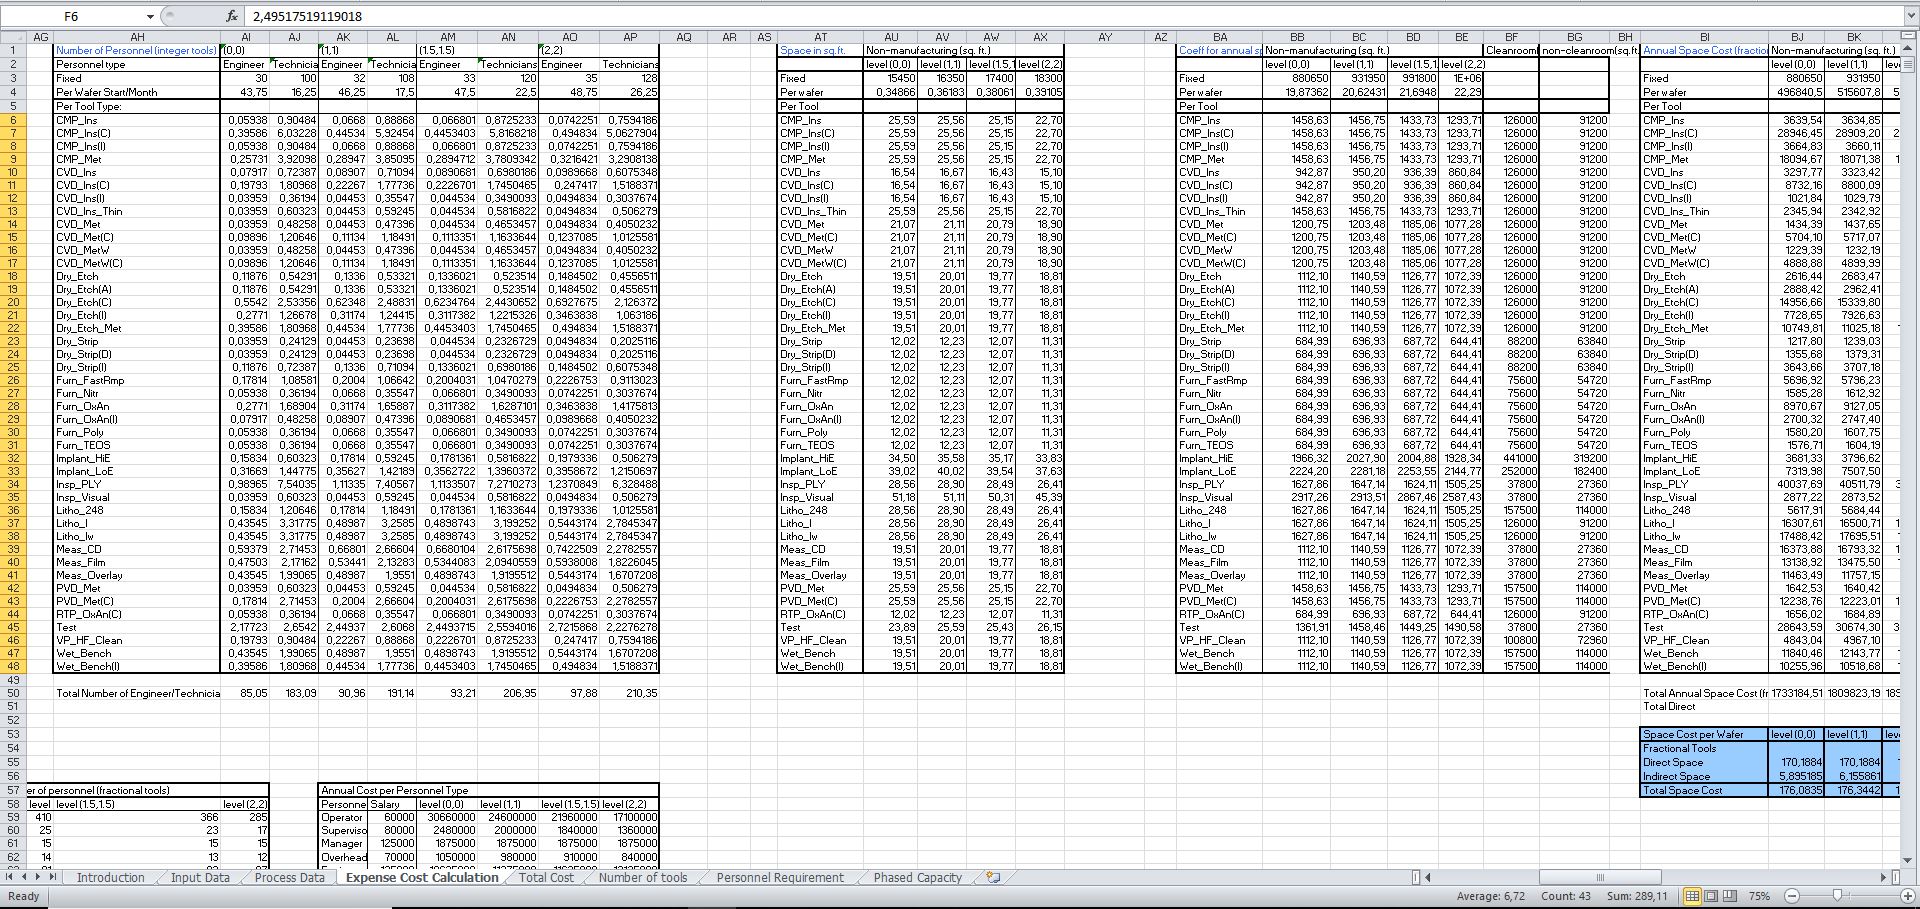
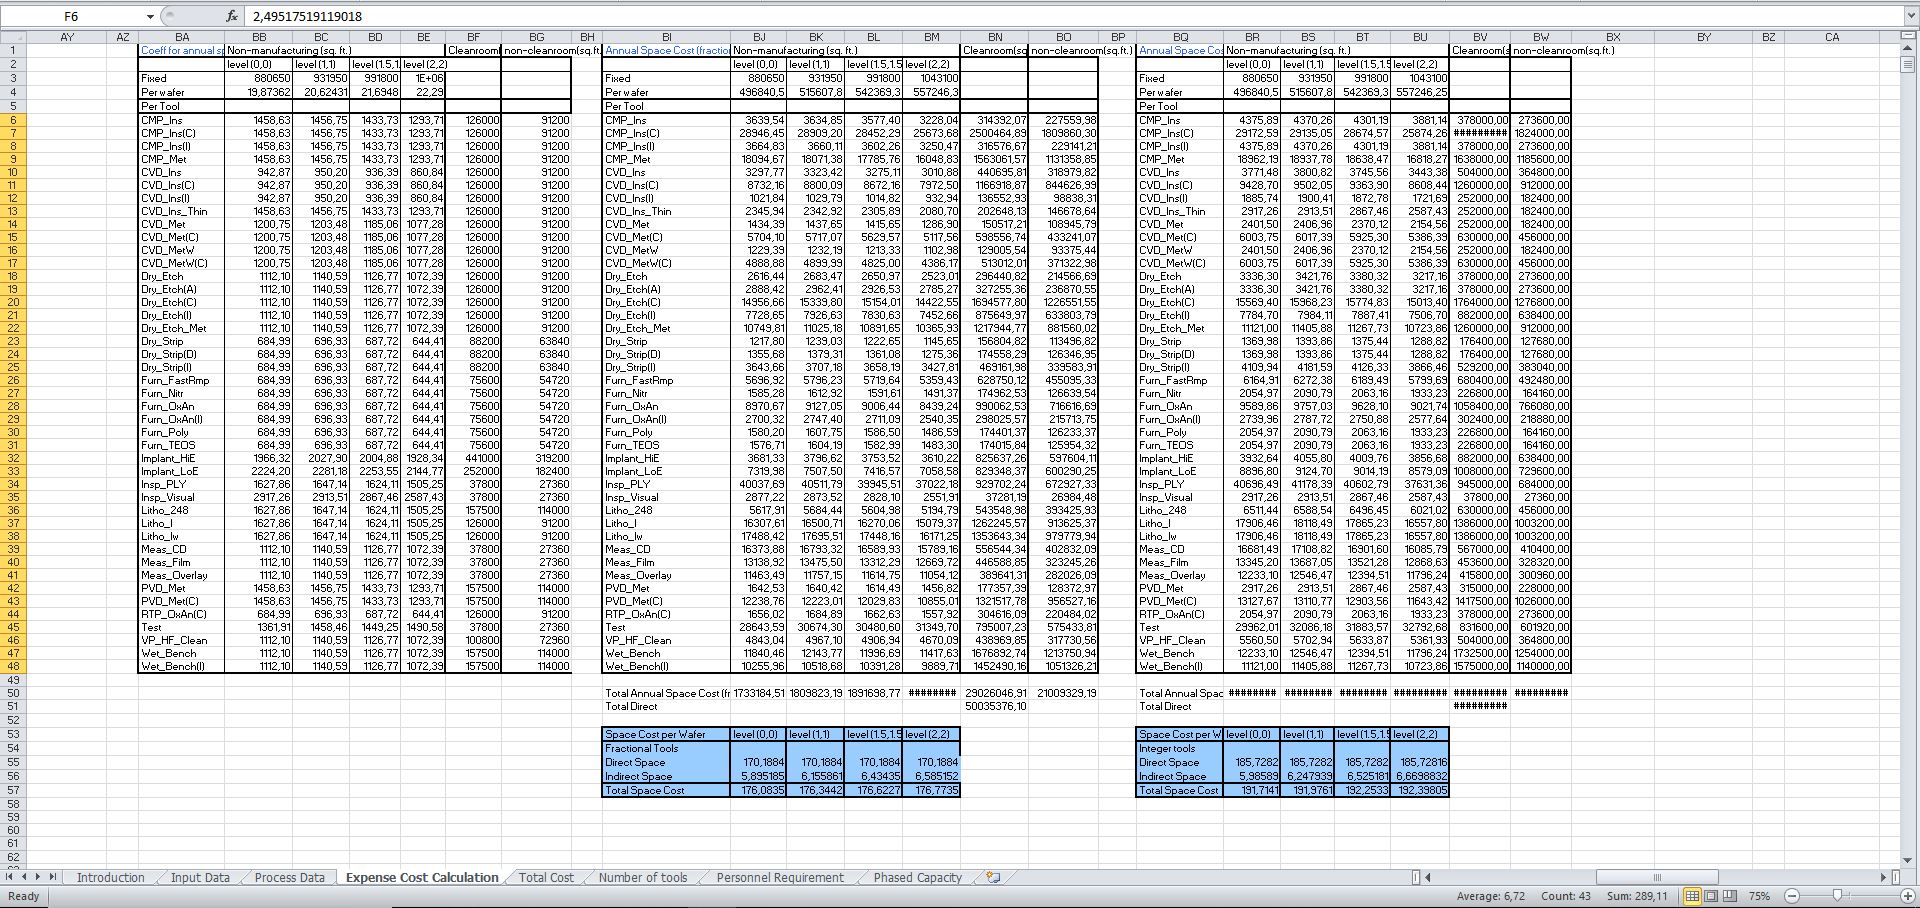
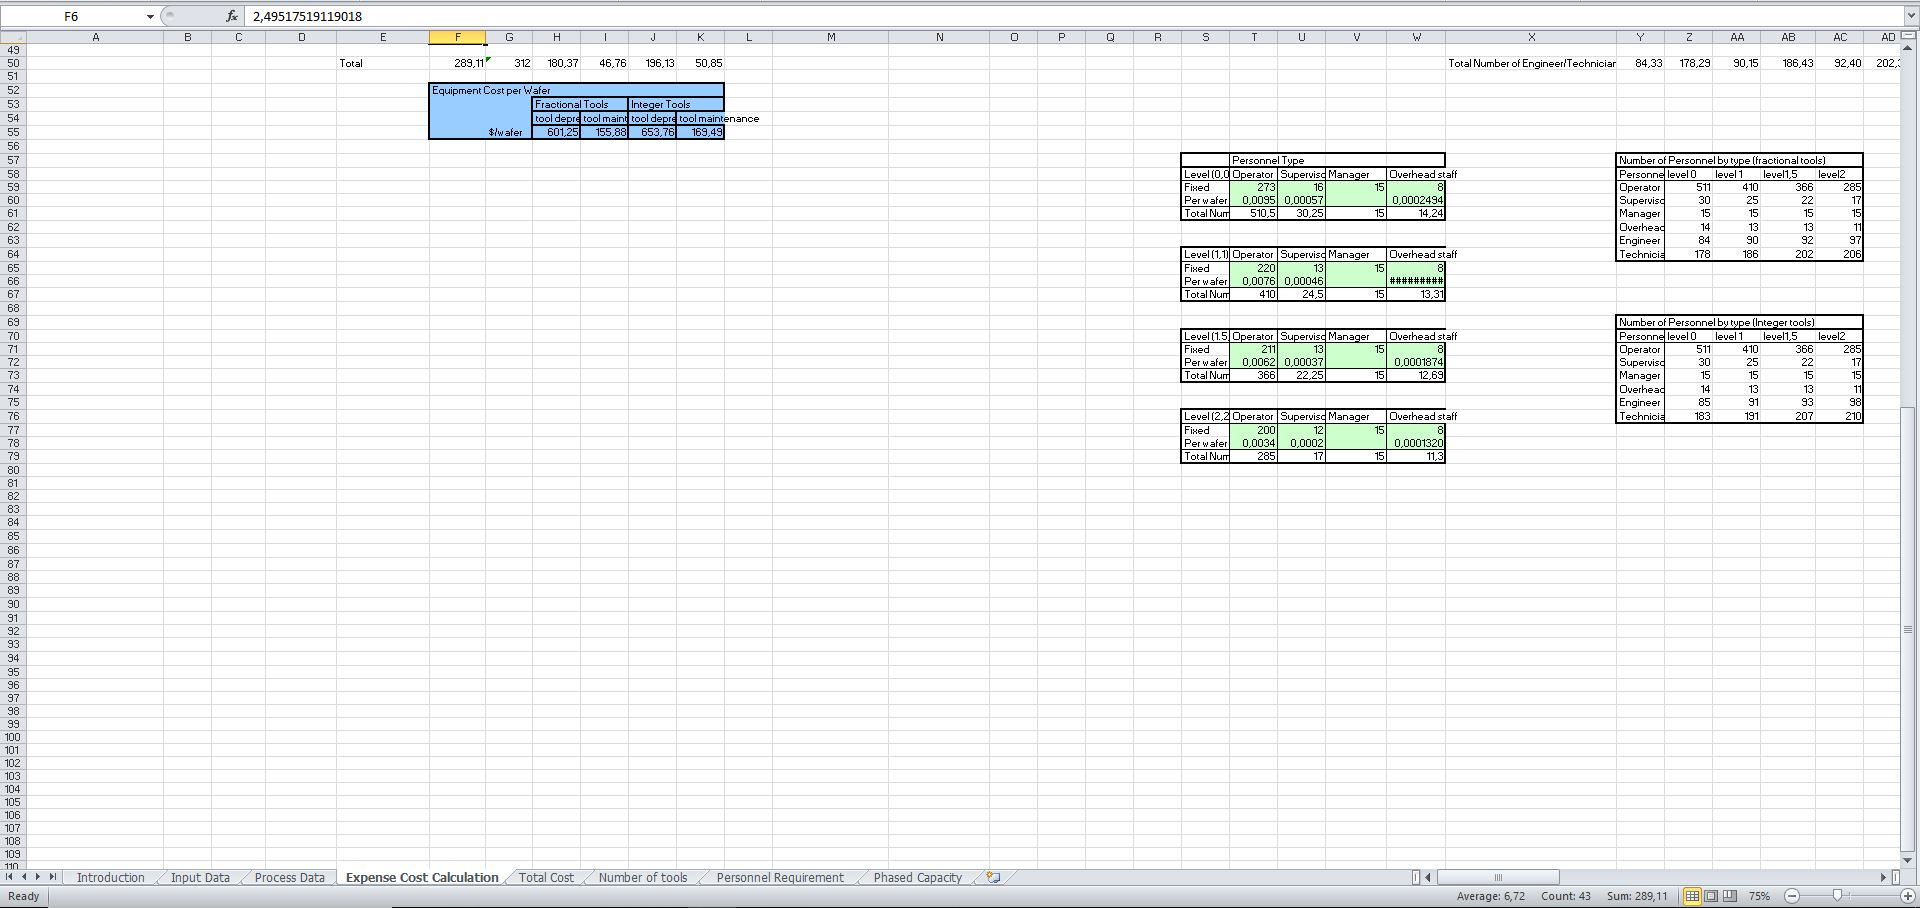
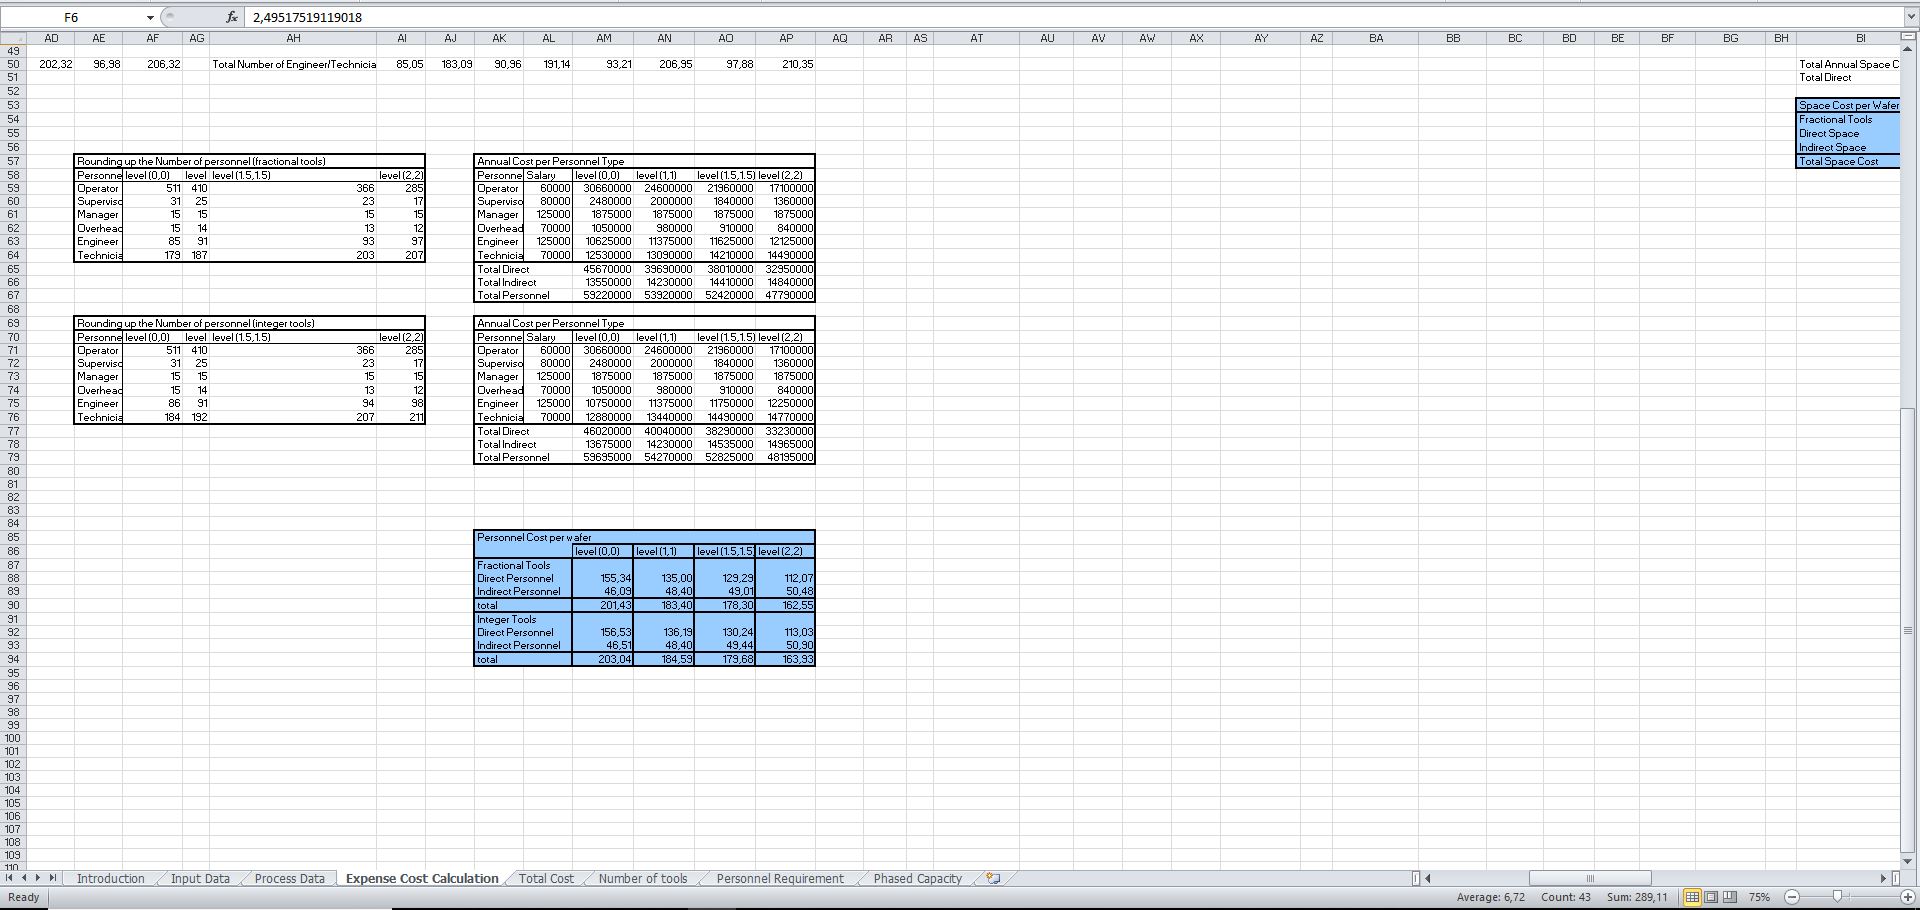
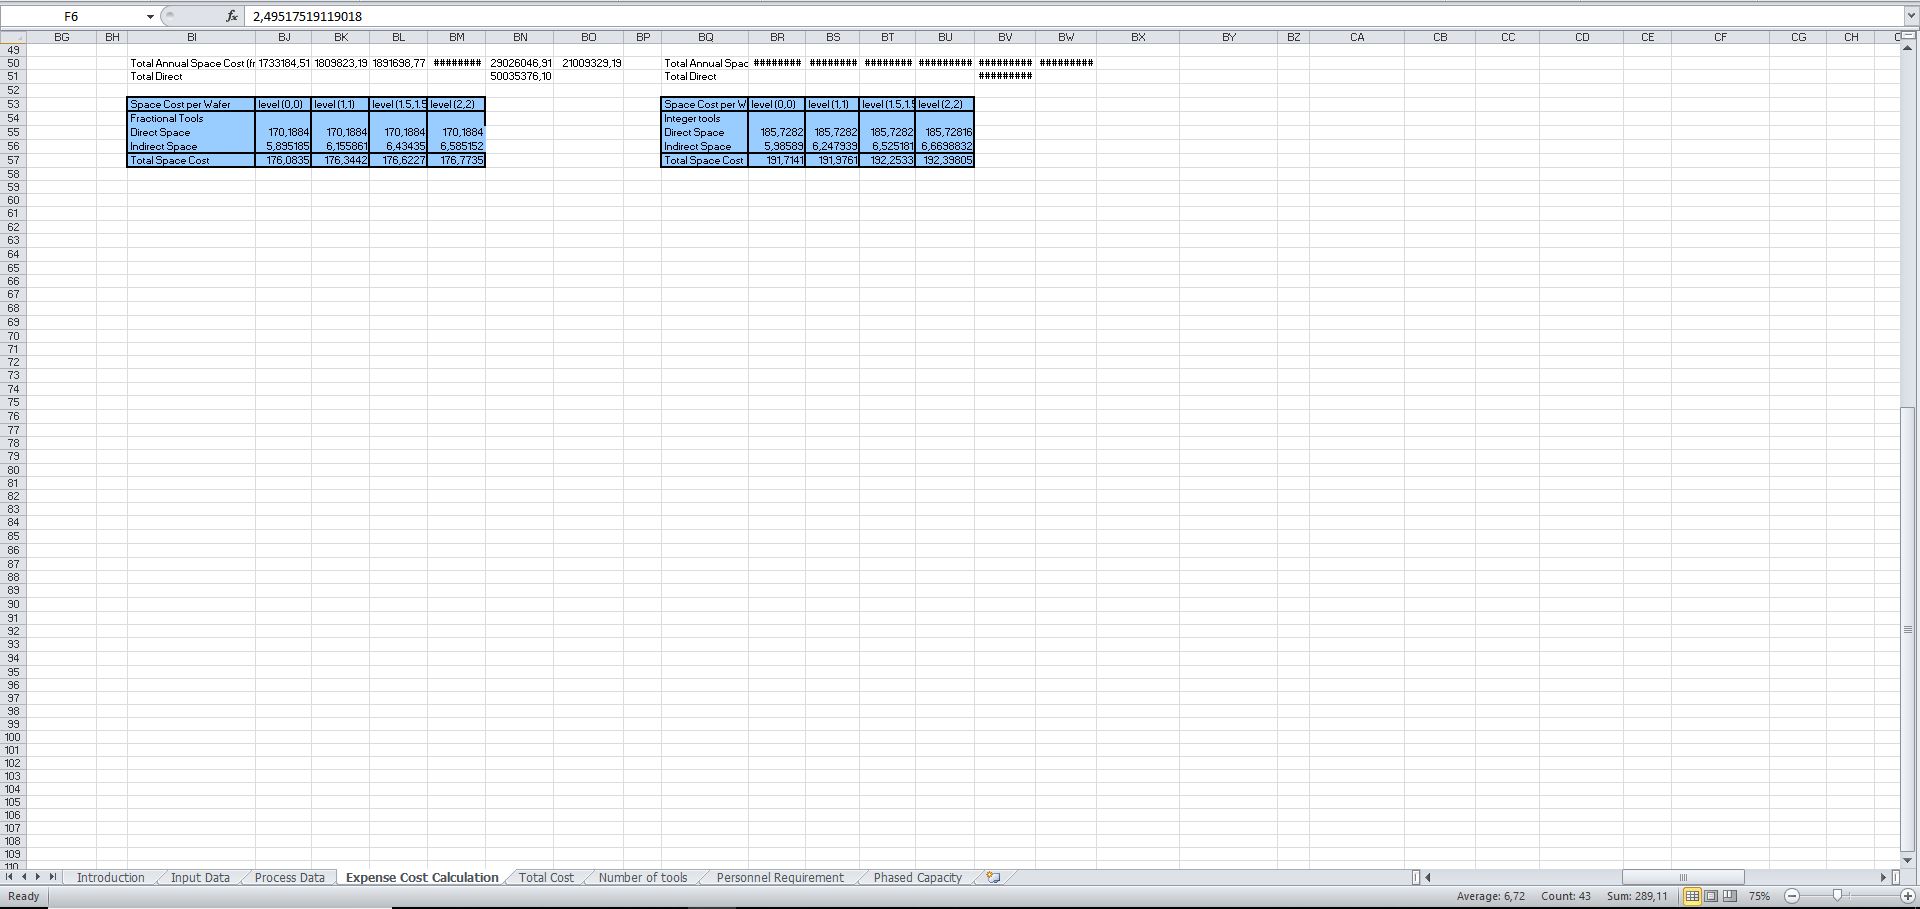
4. The Expense Cost Calculation
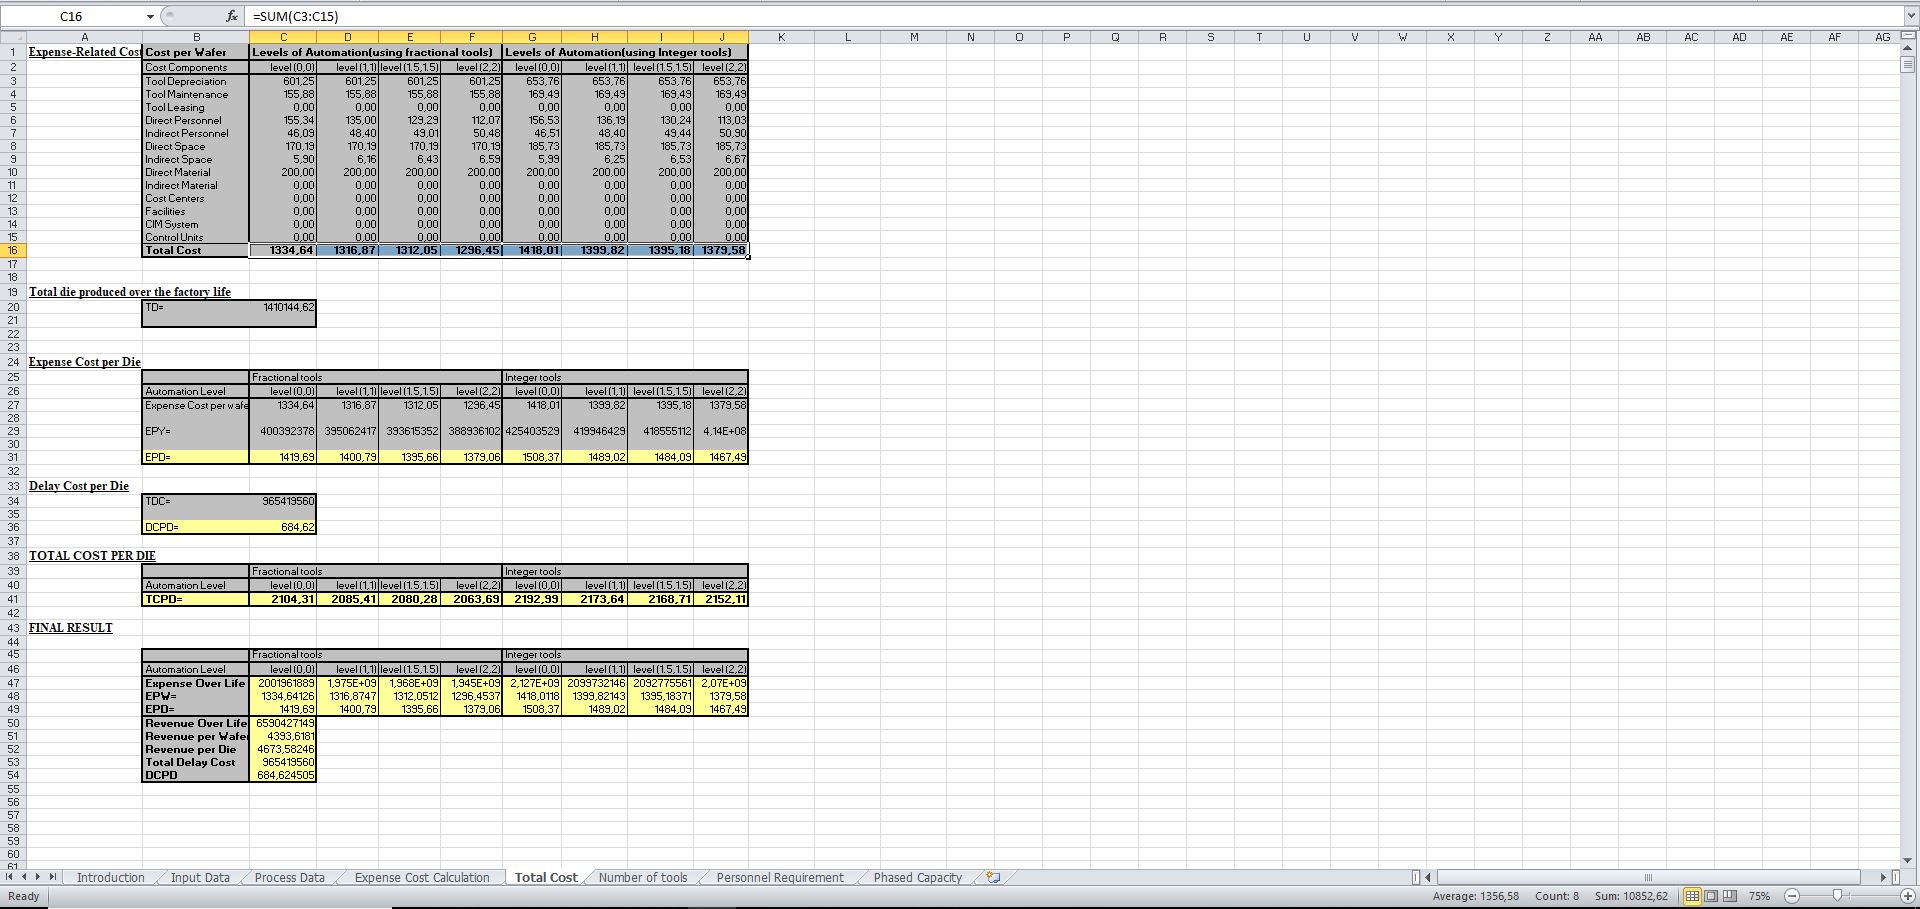
5. The Total Cost Spreadsheet
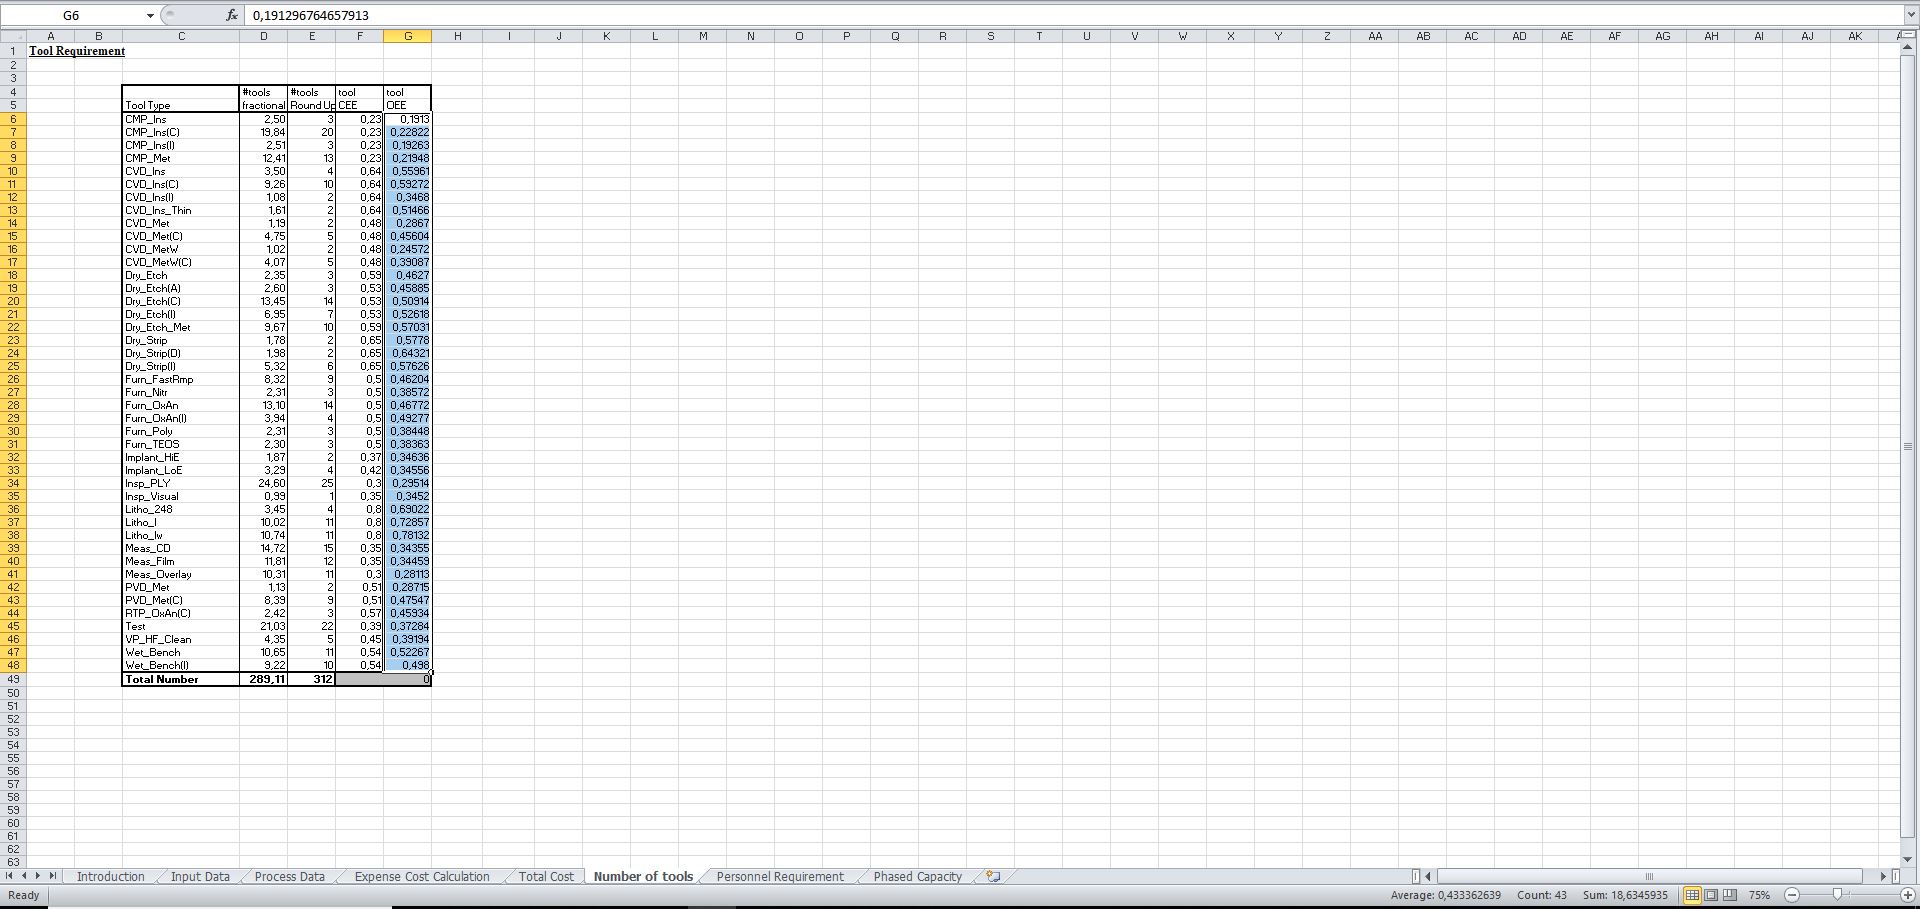
6. The Number of Tools Spreadsheet
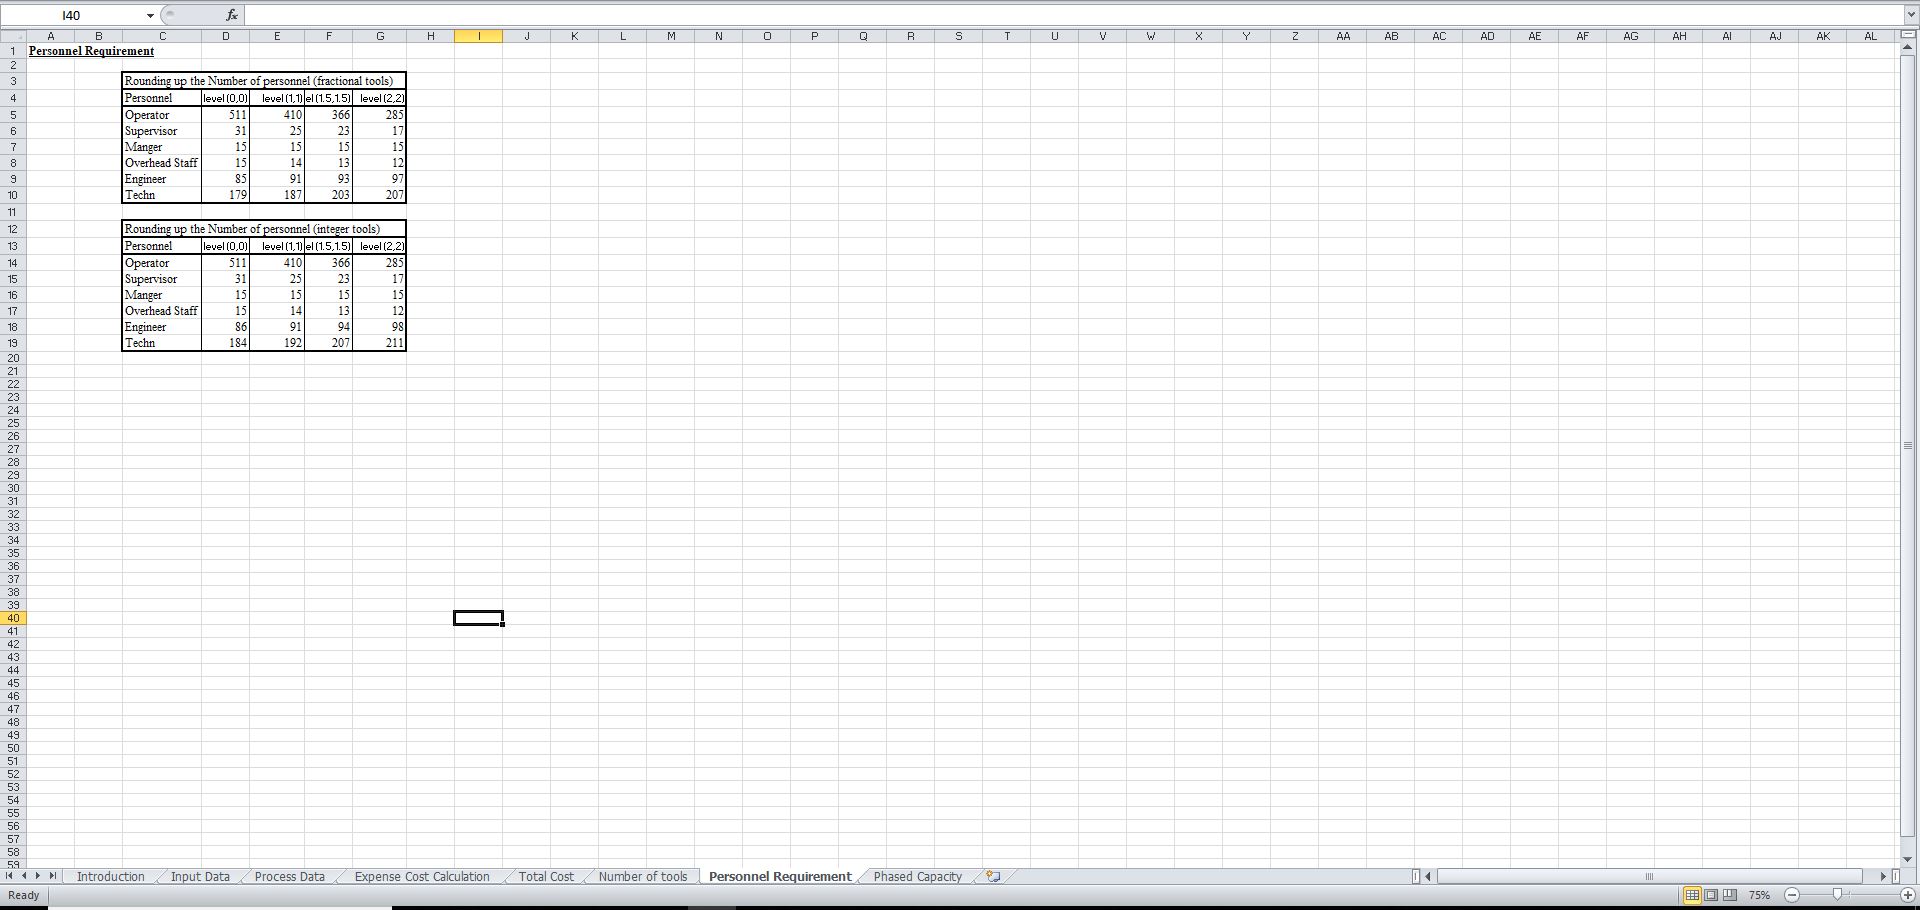
7. The Personnel Requirements Spreadsheet
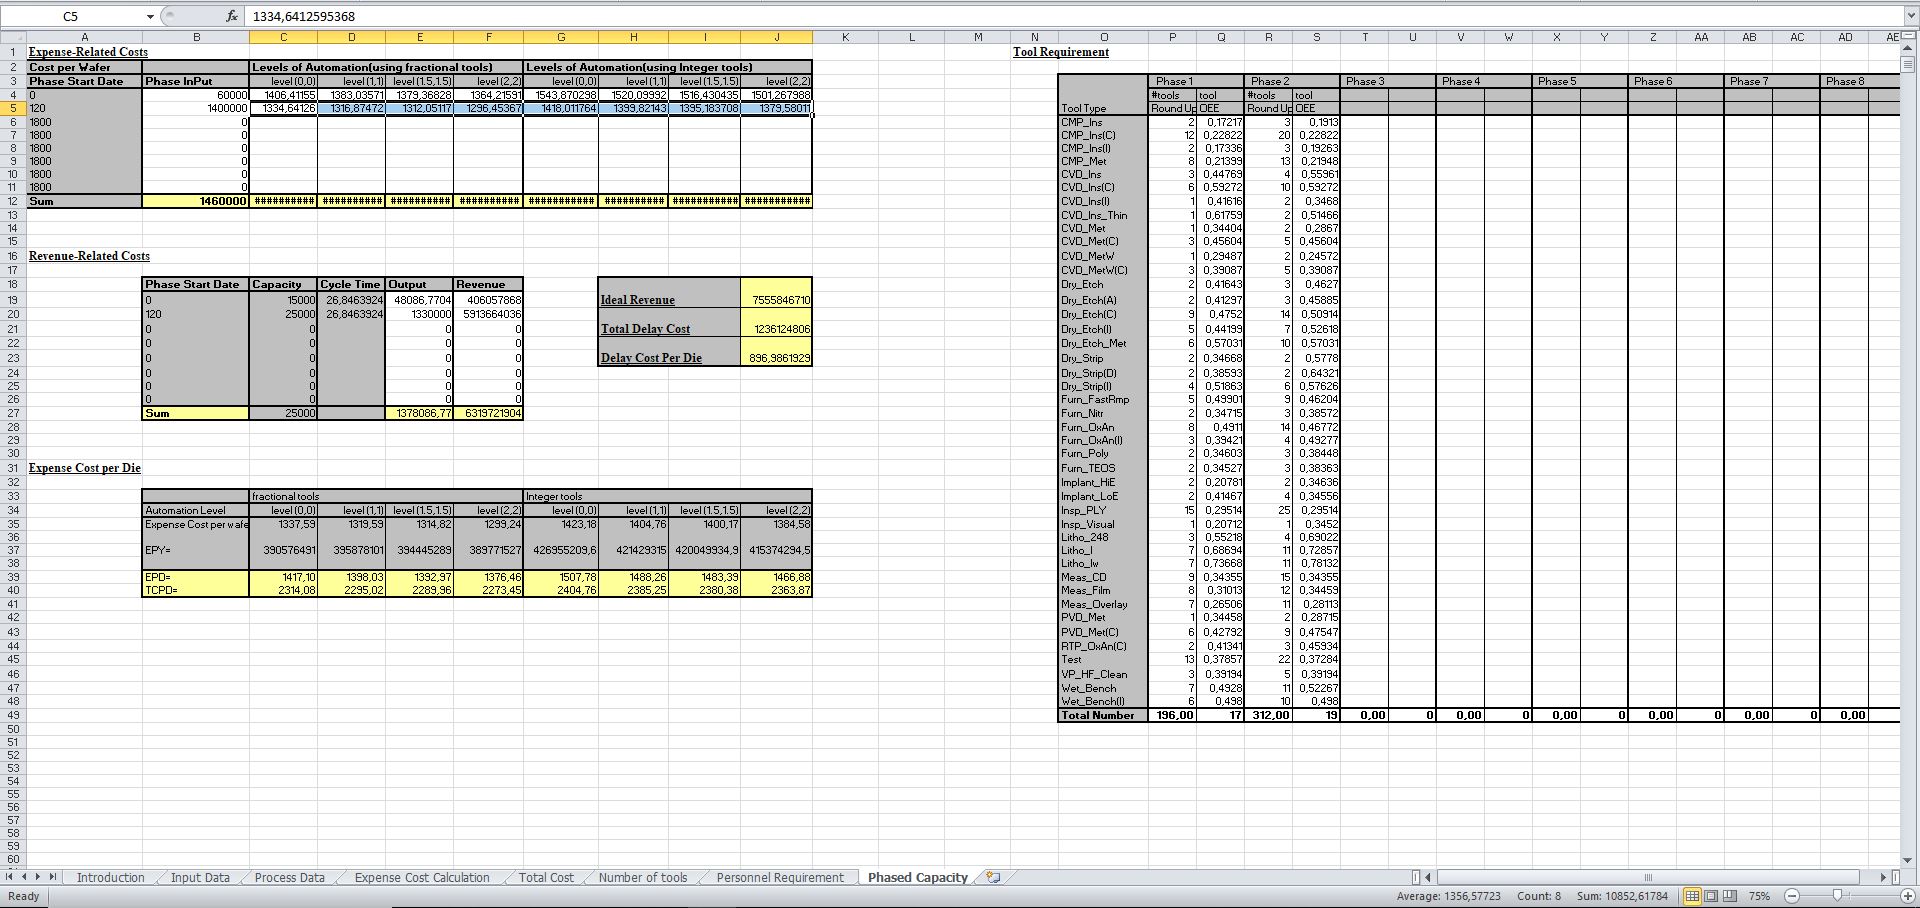
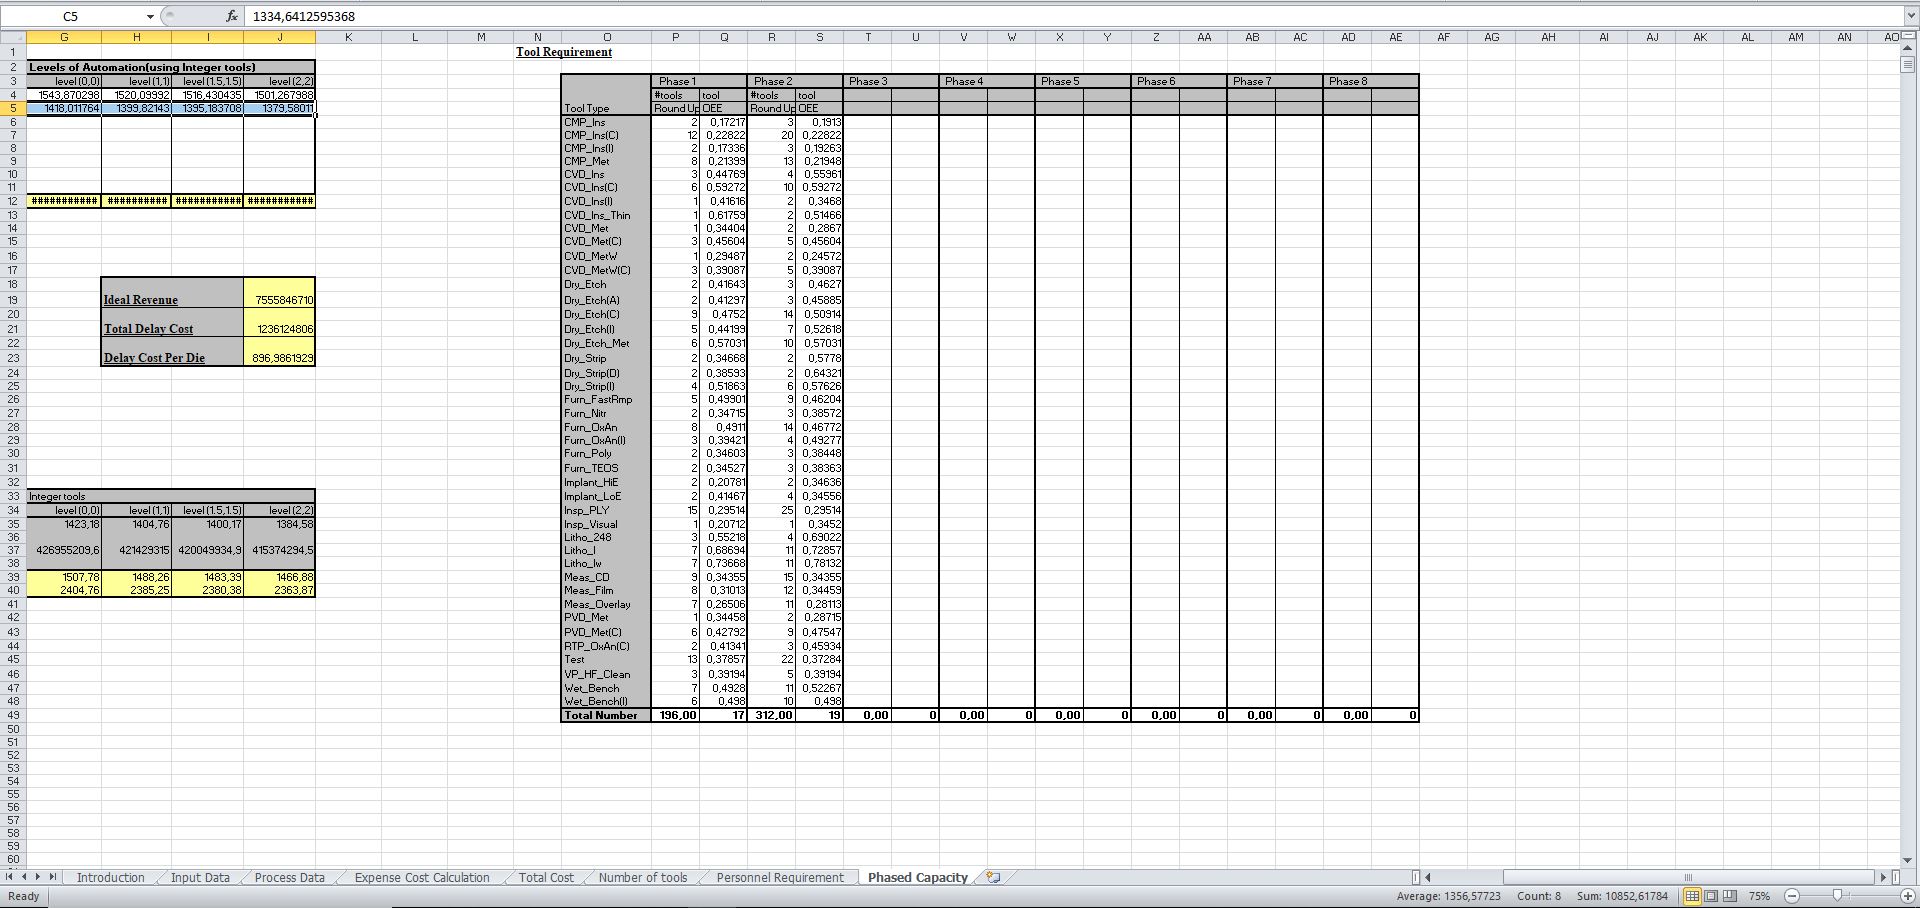
8. The Phased Capacity Spreadsheet
*Originally shared on industrial-ebooks.com*
This workbook presents spreadsheet models in excel that you can use to calculate revenues and the costs of water fabrication. The intention here is to provide an engineering analyst with the tools to evaluate the impact economically of process and equipment changes, process/equipment installation timing changes, changes in the time it takes to ramp up die yield, and manufacturing cycle time changes. Cash flows are computed for both cash flows for expenditures and revenues from fabrication.
Currently, the models make the assumption that the fabrication line operates a single process technology that will consist of up to 300 major process steps using max. 50 major kinds of process equipment. The user is able to compute revenues and costs for 1 out of 2 basic cases:
1. Wafer start volumes being pre-specified over a period of time
2. Equipment counts are pre-specified over a period of time
In the first case, reduced process times or higher equipment efficiencies will result in decreased investment in facilities and equipment to accommodate the wafer starts that have been pre-specified. Higher yields in this case will result in decreased investment costs as well as revenues that are higher for given wafer start volumes. In the second case, reduced process times or higher equipment efficiencies will result in higher wafer throughput for the given equipment set, and therefore both lower costs and higher revenues per wafer. Higher yields here will therefore result in a higher die throughput for the given equipment set and both lower costs and higher revenues per wafer.
An enhanced version of SEMATECH's Cost-resource Model is used to calculate the fab expenses. The model accounts for expenses generated by fab construction and operation. To compute die costs and wafer, all die and wafers produced throughout the technology's life, are all burdened with capital expenses equally. The main differences in comparison to CRM are:
1. Staffing costs are computed for various levels of fab automation
2. Rather than average throughput rates and availability, equipment performance is defined by the user in terms of theoretical throughput rates and CEE.
When you calculate the fab revenues, it will account for a user-specified reduction in die prices over time. Delays for fab construction, equipment installation and qualification, process development and qualification, manufacturing cycle time, and yield ramp all depress revenues that are obtained from the process technology over the period of its life. The Delay Cost Model presents a die cost equivalent which results from delays for qualification and development, equipment installation and qualification, time to ramp die yield, factory construction, and manufacturing cycle time.
This workbook includes seven spreadsheets:
1. The Introduction
2. The Input Data
3. The Process Data
4. The Expense Cost Calculation
5. The Total Cost Spreadsheet
6. The Number of Tools Spreadsheet
7. The Personnel Requirements Spreadsheet
8. The Phased Capacity Spreadsheet
*Originally shared on industrial-ebooks.com*
This Best Practice includes
1 Downloadable Excel Workbook
Nancy S. Sato Misawa offers you this Best Practice for free!
download for free
Add to bookmarks
