Originally published: 31/01/2020 09:19
Publication number: ELQ-13309-1
View all versions & Certificate
Publication number: ELQ-13309-1
View all versions & Certificate

Human Resources Dashboard
Human Resources Dashboard
Description
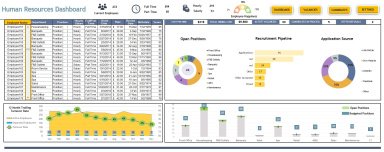
The Human Resources Dashboard is an invaluable tool for monitoring, recording and analyzing data for open positions and providing quick look ups of employee data.
Applicant Pipeline:
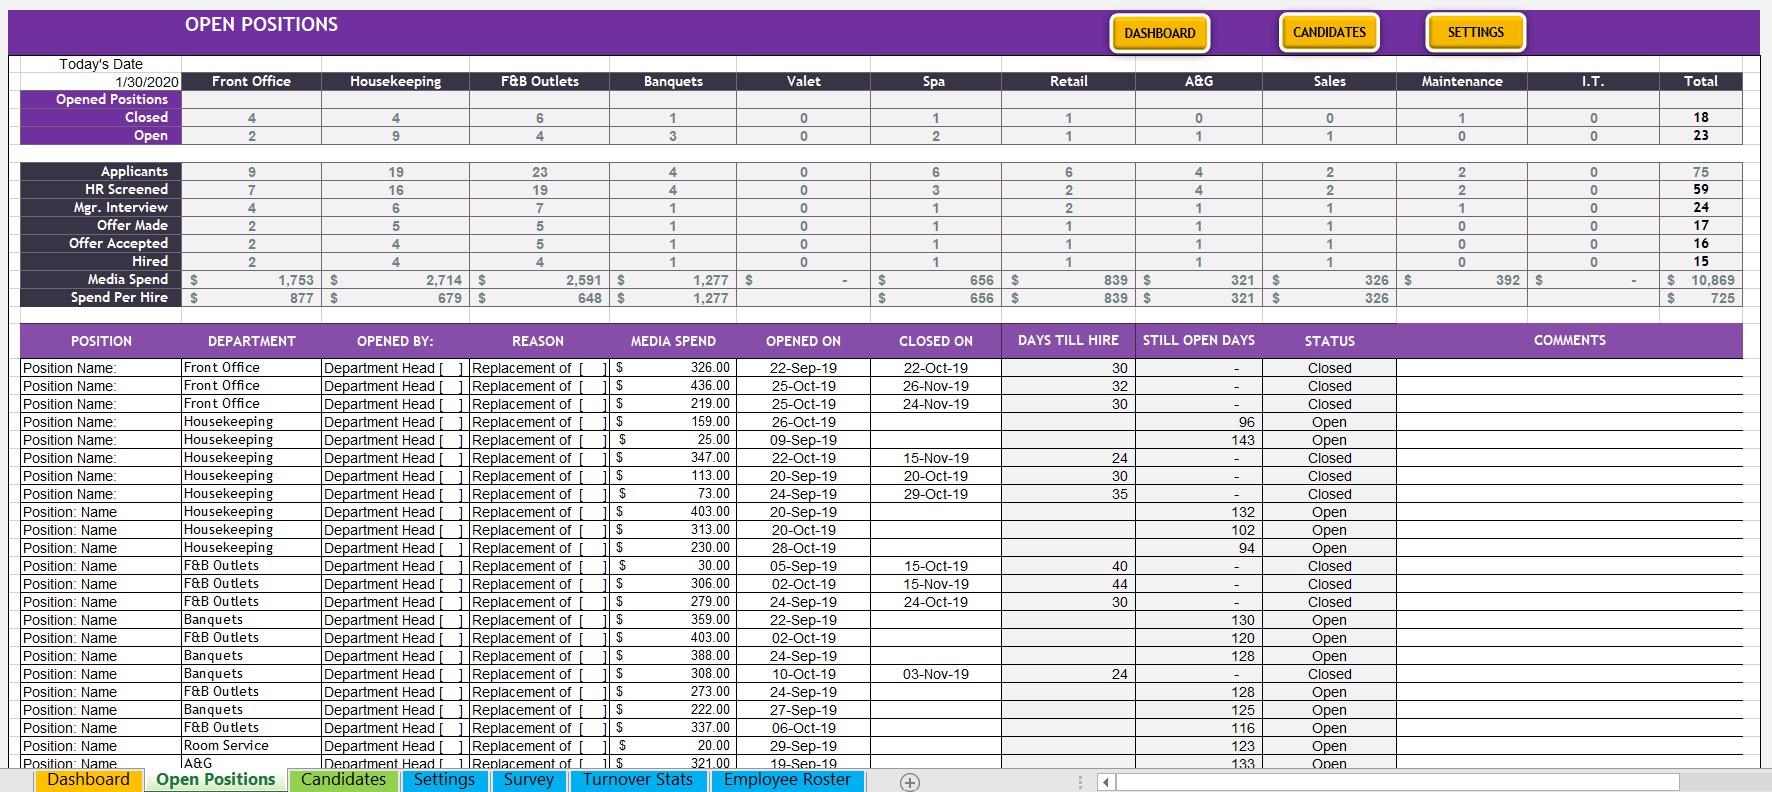
On the Open Positions tab, openings are logged with an open starting date as well as a advertising spend budget amount. The number of days the position is open is tracked until a closing date is logged.
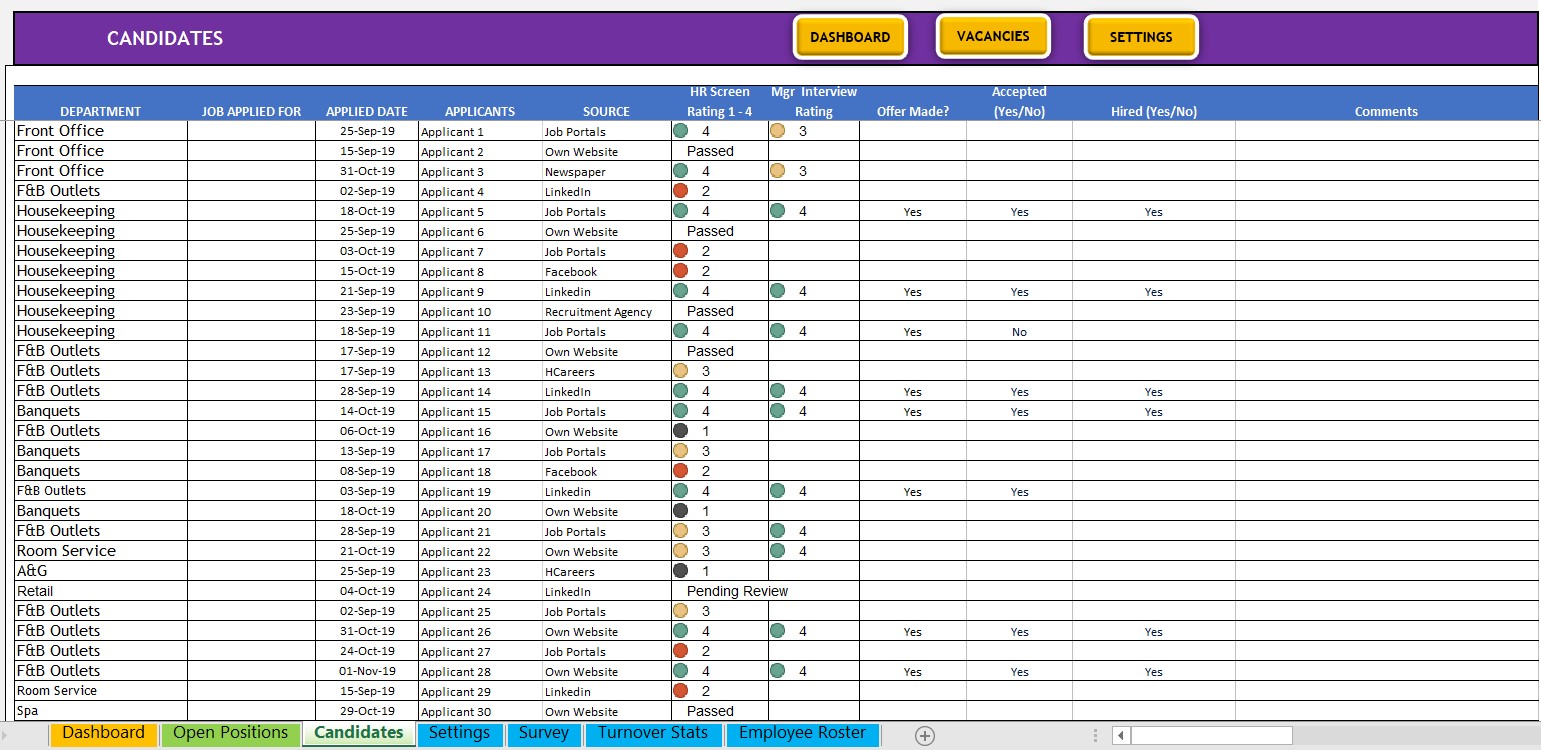
On the Candidate tab, applicants are logged by position applied for as well was source of application (i.e Linkedin, Indeed, Glassdoor, recruitment agencies etc). This tab also includes a rating scale of 1 to 4 for the HR Director to do initial screening and add comments. For candidates passing initial HR screening, ratings and comments from the department manager are logged as well.
If the candidate passes the acceptance, an offer is logged. Acceptance or refusal by the candidate is logged as well. Upon acceptance, a hire date is entered and the position is closed.
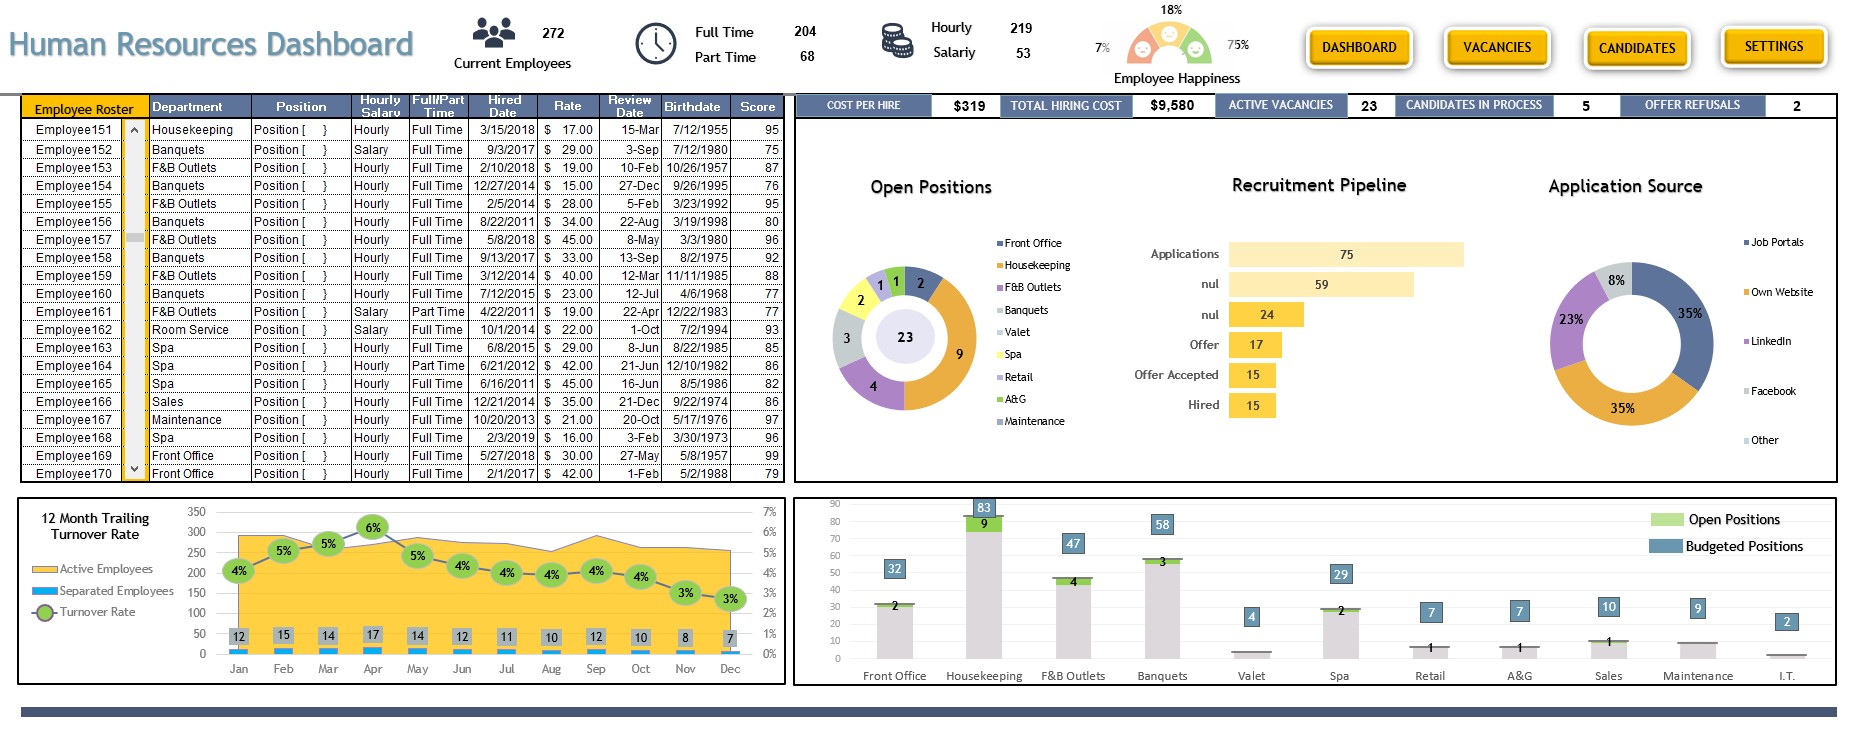
The Dashboard includes a funnel chart for viewing the number of candidates for each phase in the pipeline as well as a doughnut chart depicting open positions by department. The source of applications, hiring cost and cost per hire are also calculated on the Dashboard.
Employee Roster
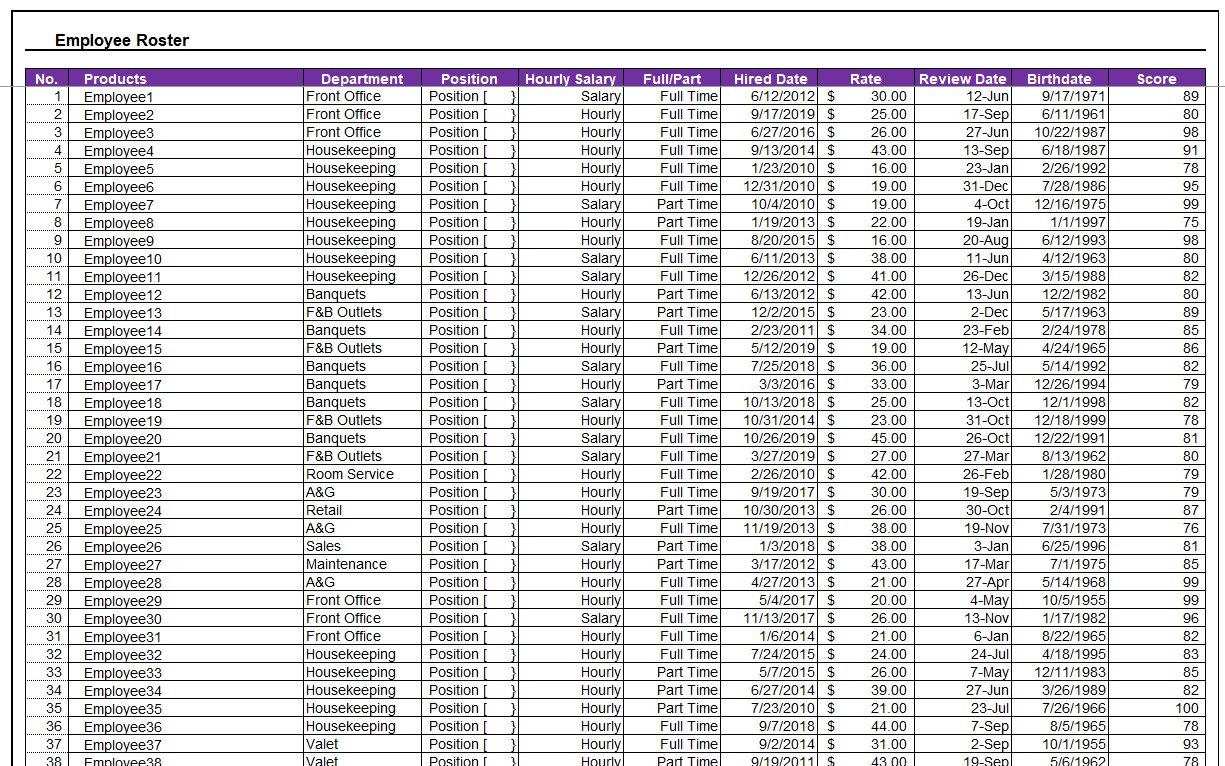
On a separate tab, current hired employees can be input (or data pasted) with your choice of data. This might include Employee Name, Department, Hire Date, Full Time/Part Time, Pay Rate, Birthday, Employee Score, Review Date, etc.).
This data feeds to Employee Roster section of the Dashboard. A scrollbar feature gives an instant look up to an individuals data as needed.
The data from the Roster tab also provides calculations on the Dashboard for the number of current employees, as well as the number of full and part time employees.
Employee Turnover
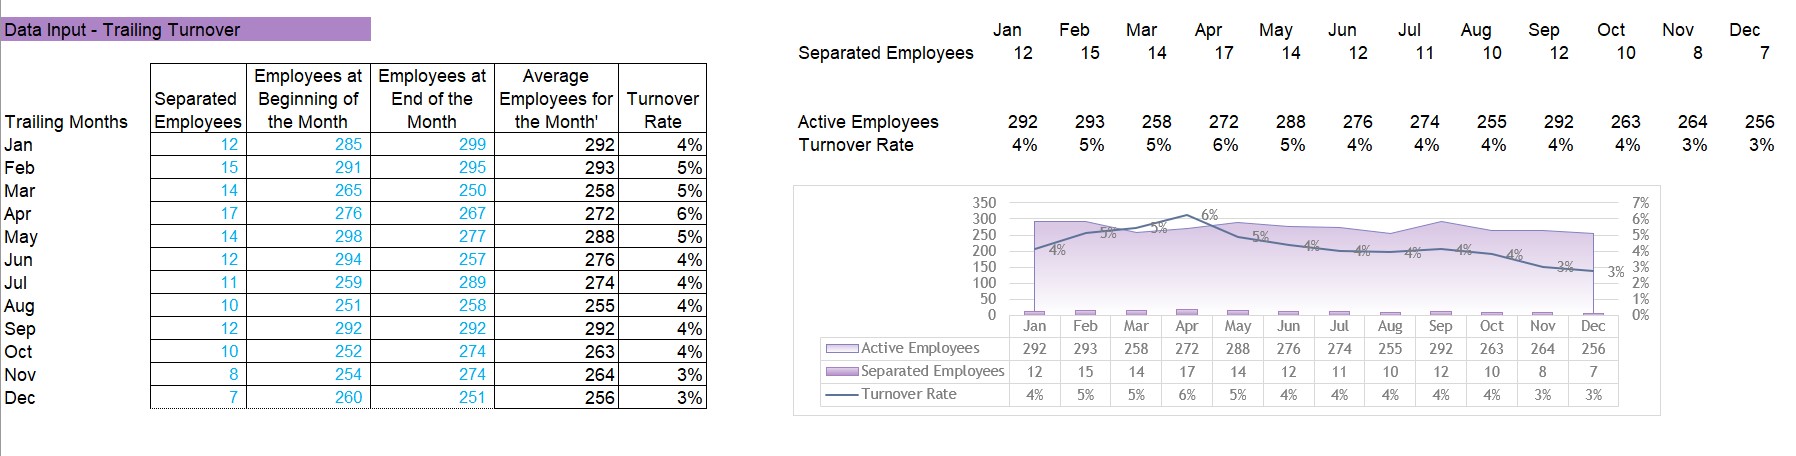
A tab for imputing separated employees by month as well as the number of employees by month drives the Employee Turnover graph on the Dashboard.
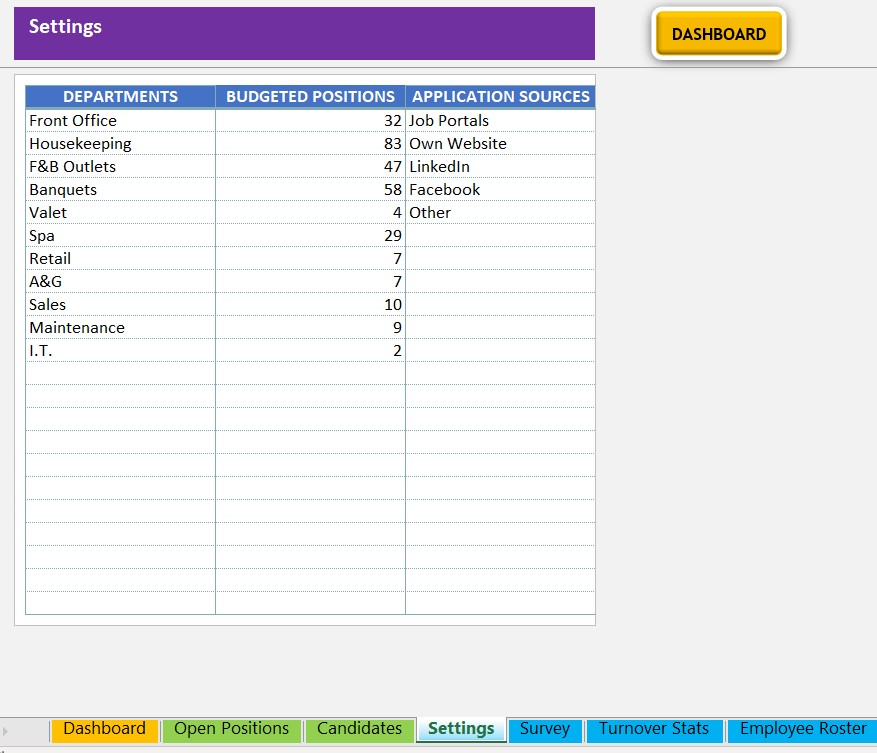
Budgeted Positions
In the Settings tab, the number of budgeted employees can be input. The graph on the lower right represents the cu.
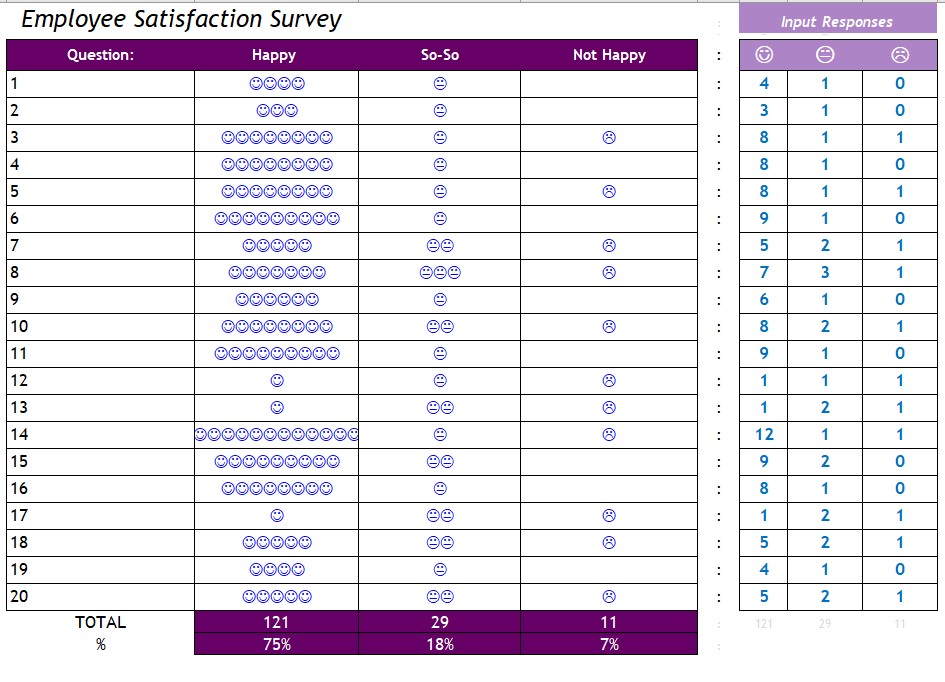
Employee Happiness
Employee Satisfaction Scores can be input on the Employee Survey tab. The Dashboard reads the data and calculates the % of Not-So-Happy, So-So, and Happy Employees. An Optional Survey template is provided, but other means could be used as well.
Result
Quality Employees *Less Stress on Managers *Lower Hiring Costs *Higher Customer Satisfaction.
The Human Resources Dashboard is an invaluable tool for monitoring, recording and analyzing data for open positions and providing quick look ups of employee data.
Applicant Pipeline:
On the Open Positions tab, openings are logged with an open starting date as well as a advertising spend budget amount. The number of days the position is open is tracked until a closing date is logged.
On the Candidate tab, applicants are logged by position applied for as well was source of application (i.e Linkedin, Indeed, Glassdoor, recruitment agencies etc). This tab also includes a rating scale of 1 to 4 for the HR Director to do initial screening and add comments. For candidates passing initial HR screening, ratings and comments from the department manager are logged as well.
If the candidate passes the acceptance, an offer is logged. Acceptance or refusal by the candidate is logged as well. Upon acceptance, a hire date is entered and the position is closed.
The Dashboard includes a funnel chart for viewing the number of candidates for each phase in the pipeline as well as a doughnut chart depicting open positions by department. The source of applications, hiring cost and cost per hire are also calculated on the Dashboard.
Employee Roster
On a separate tab, current hired employees can be input (or data pasted) with your choice of data. This might include Employee Name, Department, Hire Date, Full Time/Part Time, Pay Rate, Birthday, Employee Score, Review Date, etc.).
This data feeds to Employee Roster section of the Dashboard. A scrollbar feature gives an instant look up to an individuals data as needed.
The data from the Roster tab also provides calculations on the Dashboard for the number of current employees, as well as the number of full and part time employees.
Employee Turnover
A tab for imputing separated employees by month as well as the number of employees by month drives the Employee Turnover graph on the Dashboard.
Budgeted Positions
In the Settings tab, the number of budgeted employees can be input. The graph on the lower right represents the cu.
Employee Happiness
Employee Satisfaction Scores can be input on the Employee Survey tab. The Dashboard reads the data and calculates the % of Not-So-Happy, So-So, and Happy Employees. An Optional Survey template is provided, but other means could be used as well.
Result
Quality Employees *Less Stress on Managers *Lower Hiring Costs *Higher Customer Satisfaction.
This Best Practice includes
Excel Template
