
Originally published: 22/10/2024 15:04
Last version published: 26/10/2024 21:20
Publication number: ELQ-41950-2
View all versions & Certificate
Last version published: 26/10/2024 21:20
Publication number: ELQ-41950-2
View all versions & Certificate

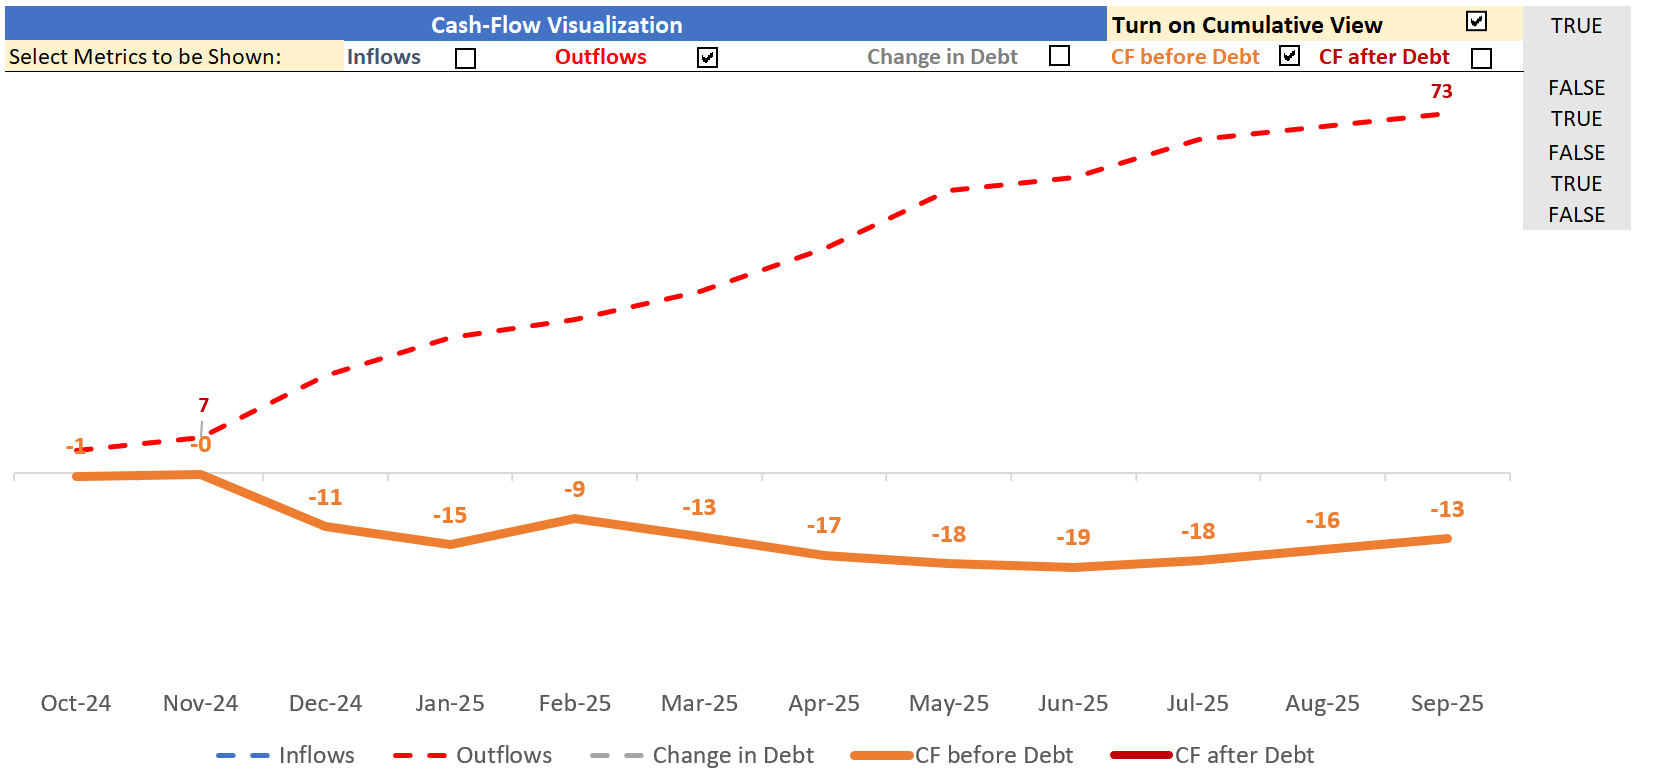
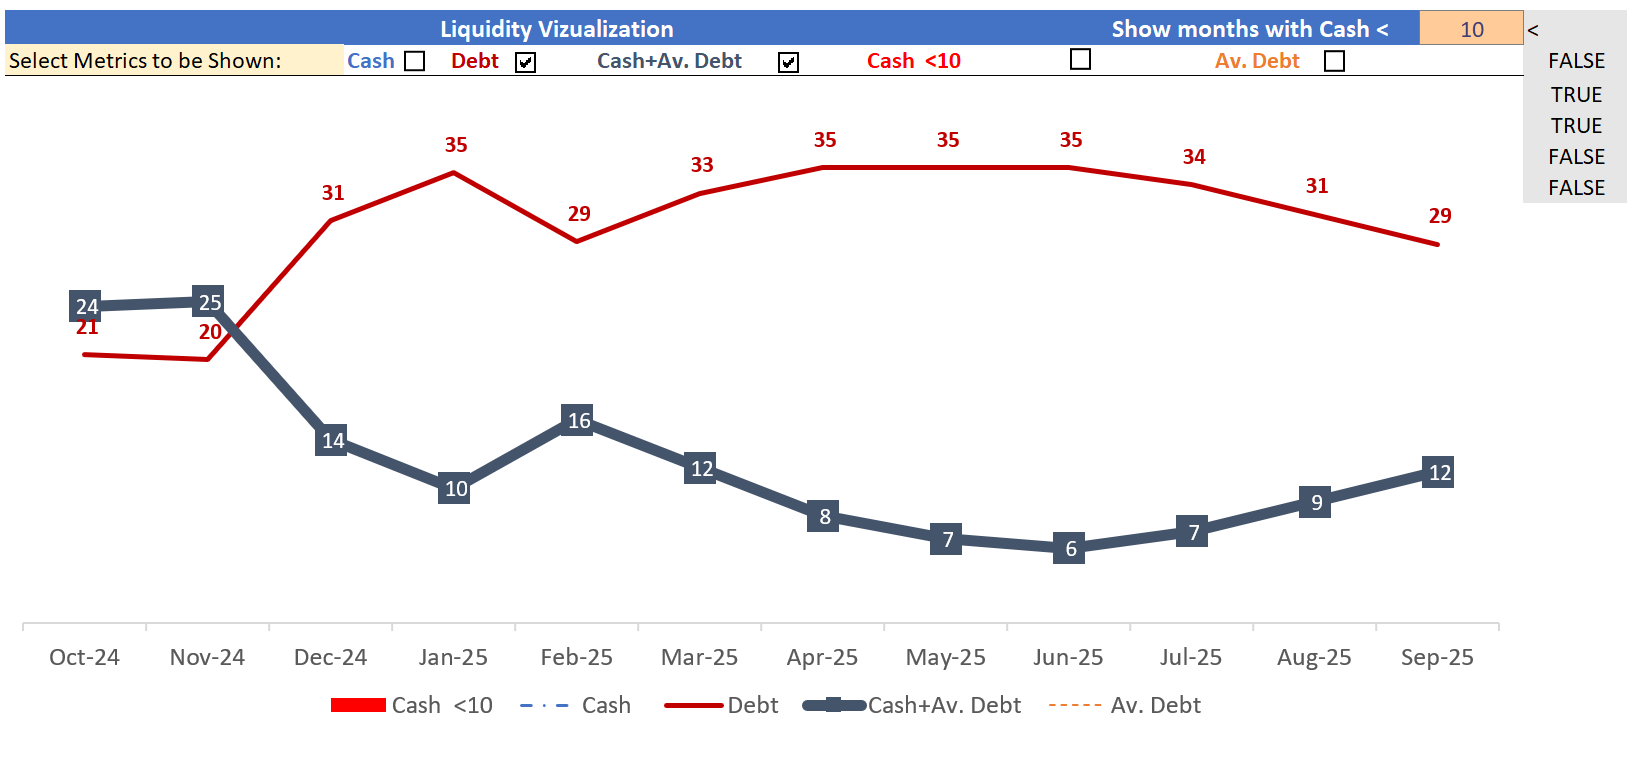
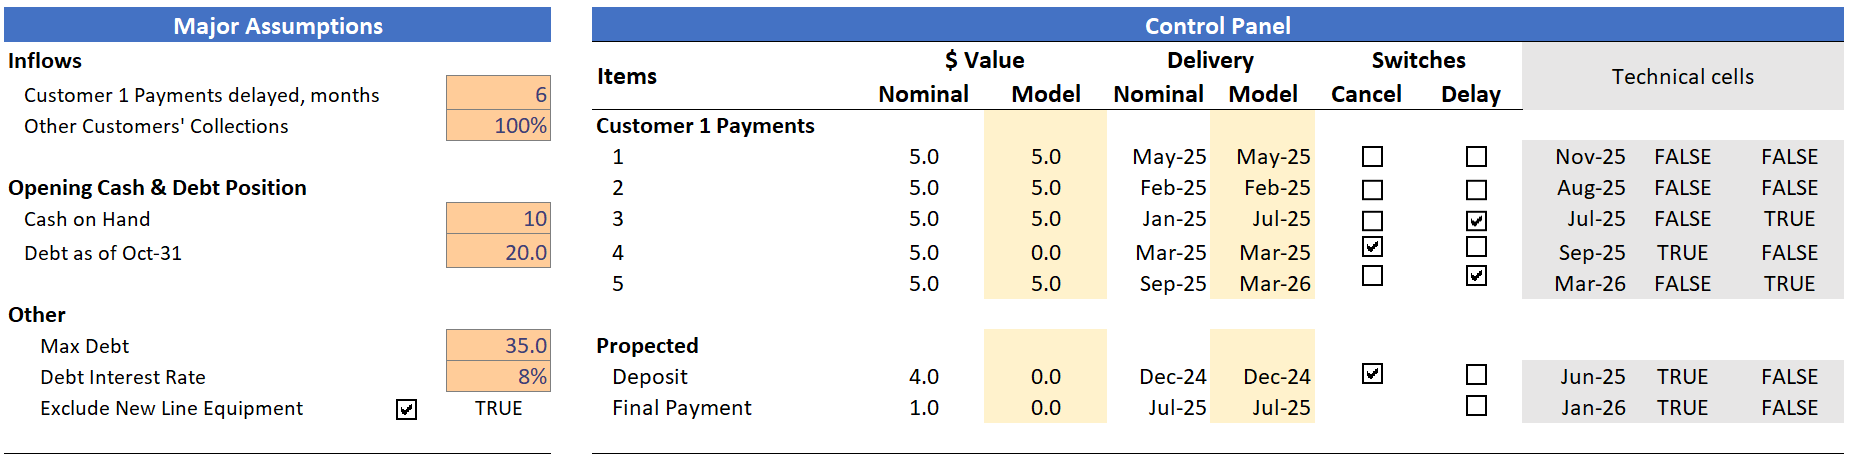
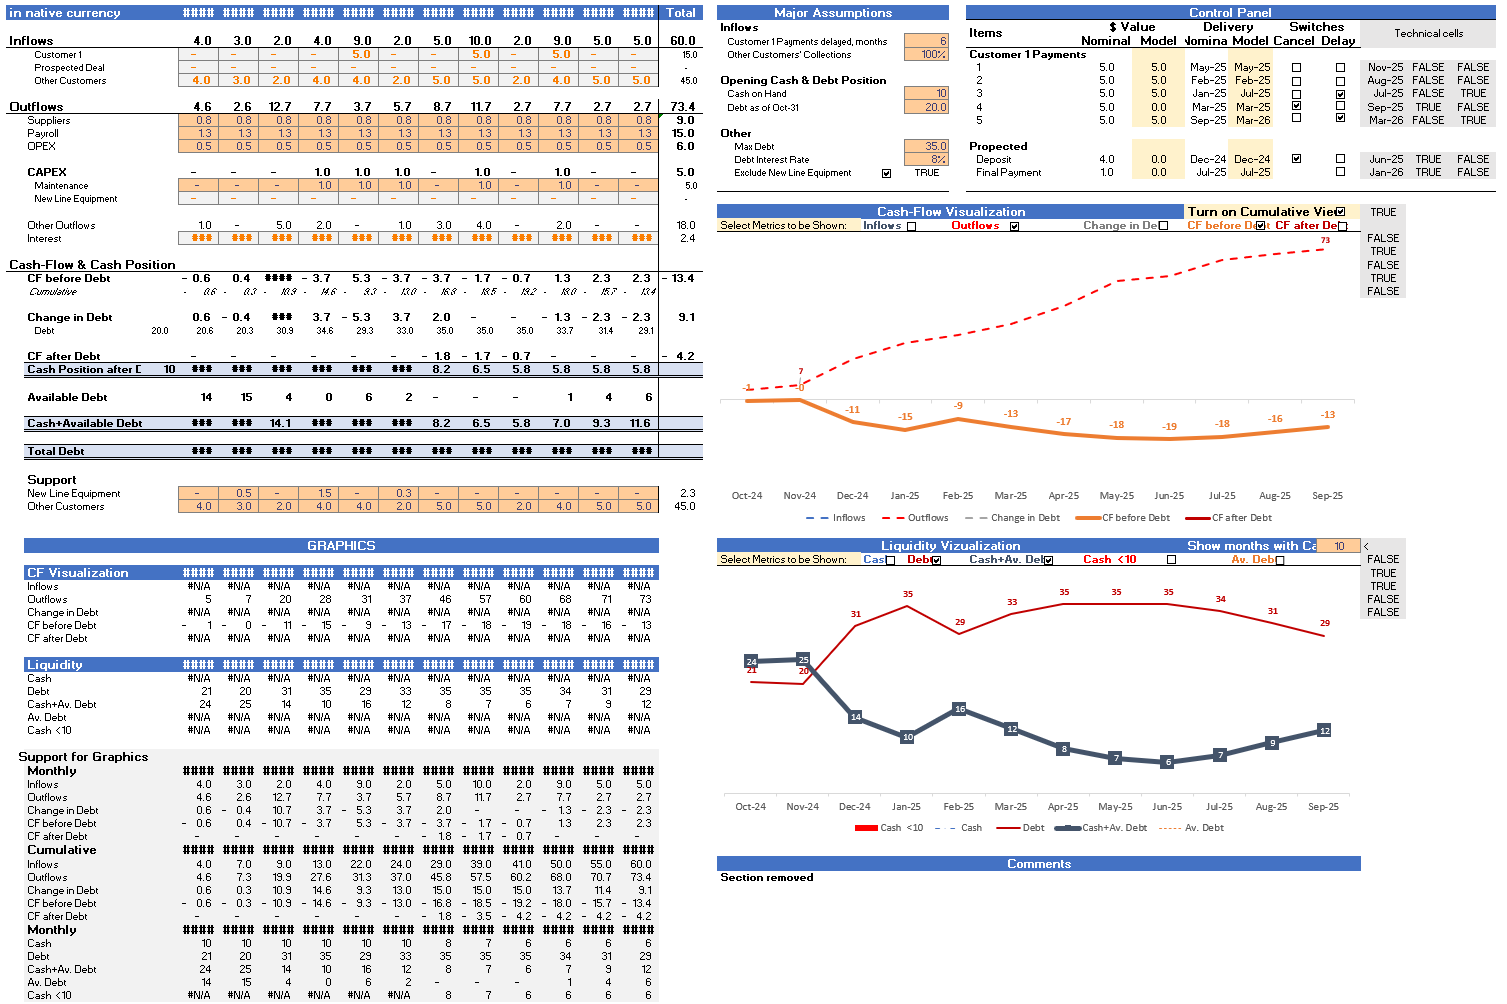
A Dynamic Cash-Flow and Liquidity Dashboard (corporate)
Using dynamic, scenario-driven charts, this template visualizes key components of corporate cash flow and liquidity positions under various scenarios.
Vladimir Baydin Ph.D. MBA offers you this Best Practice for free!
download for free
Add to bookmarks
