Originally published: 16/06/2021 13:57
Publication number: ELQ-67826-1
View all versions & Certificate
Publication number: ELQ-67826-1
View all versions & Certificate

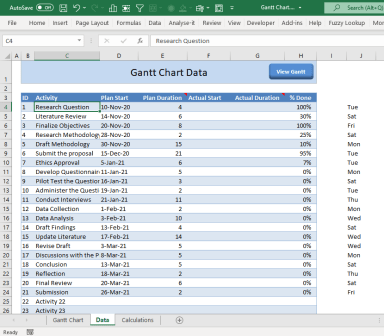
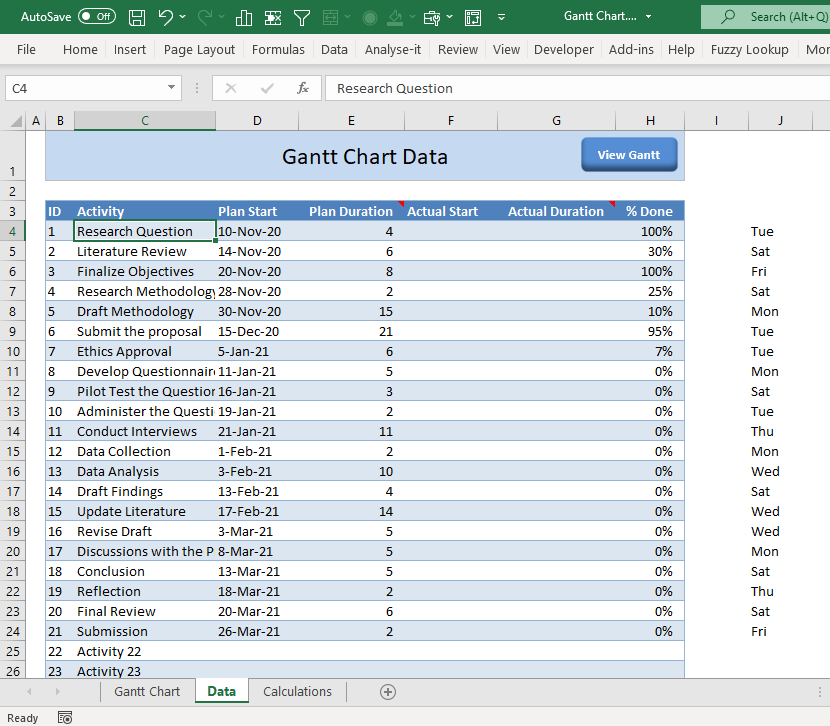
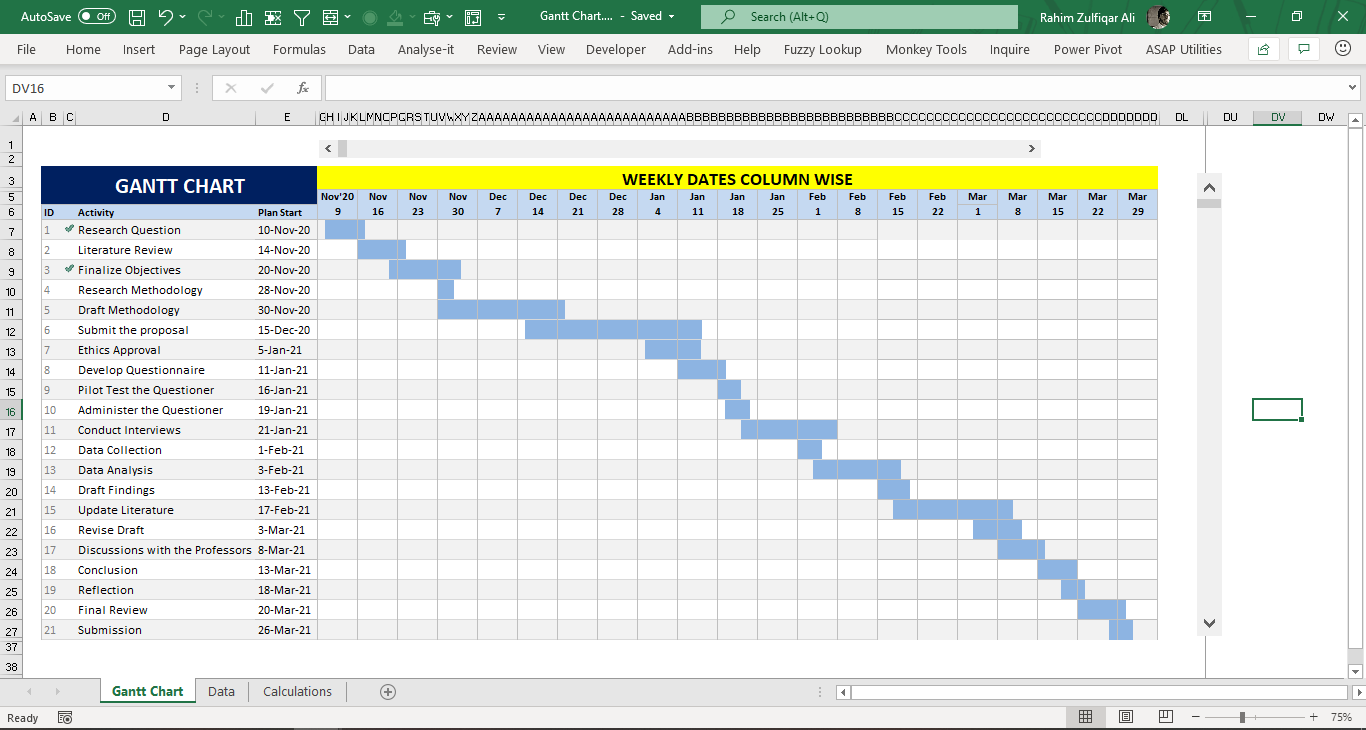
Gantt Chart in Microsoft Excel
Gantt Chart in Microsoft Excel | Manage your Project Efficiently
Founder & CEO - Excel Basement, Microsoft MVP (Excel) 2025, MCT, MSOM, Excel & POWER BI Trainer & Consultant, MBA (MIS), Emerging Data ScientistFollow 464
