Agency Capacity & Project Profitability Terminal — Margin Tracker
Originally published: 22/12/2025 21:44
Last version published: 13/07/2026 20:17
Publication number: ELQ-91400-2
View all versions & Certificate
certified

Agency Capacity & Project Profitability Terminal — Margin Tracker

Automatically calculate internal labor COGS, track effective hourly rates, and identify scope creep on fixed-fee agency projects in Google Sheets.

Description

Creative agencies, development shops, and consulting firms are notoriously terrible at tracking actual unit economics. It is a common trap for an agency to celebrate a $50,000 fixed-fee retainer, completely failing to realize that their Senior Developer and Lead Designer just burned 400 hours on scope creep. When the internal cost of that labor hits $55,000, you are literally paying the client to work for them.


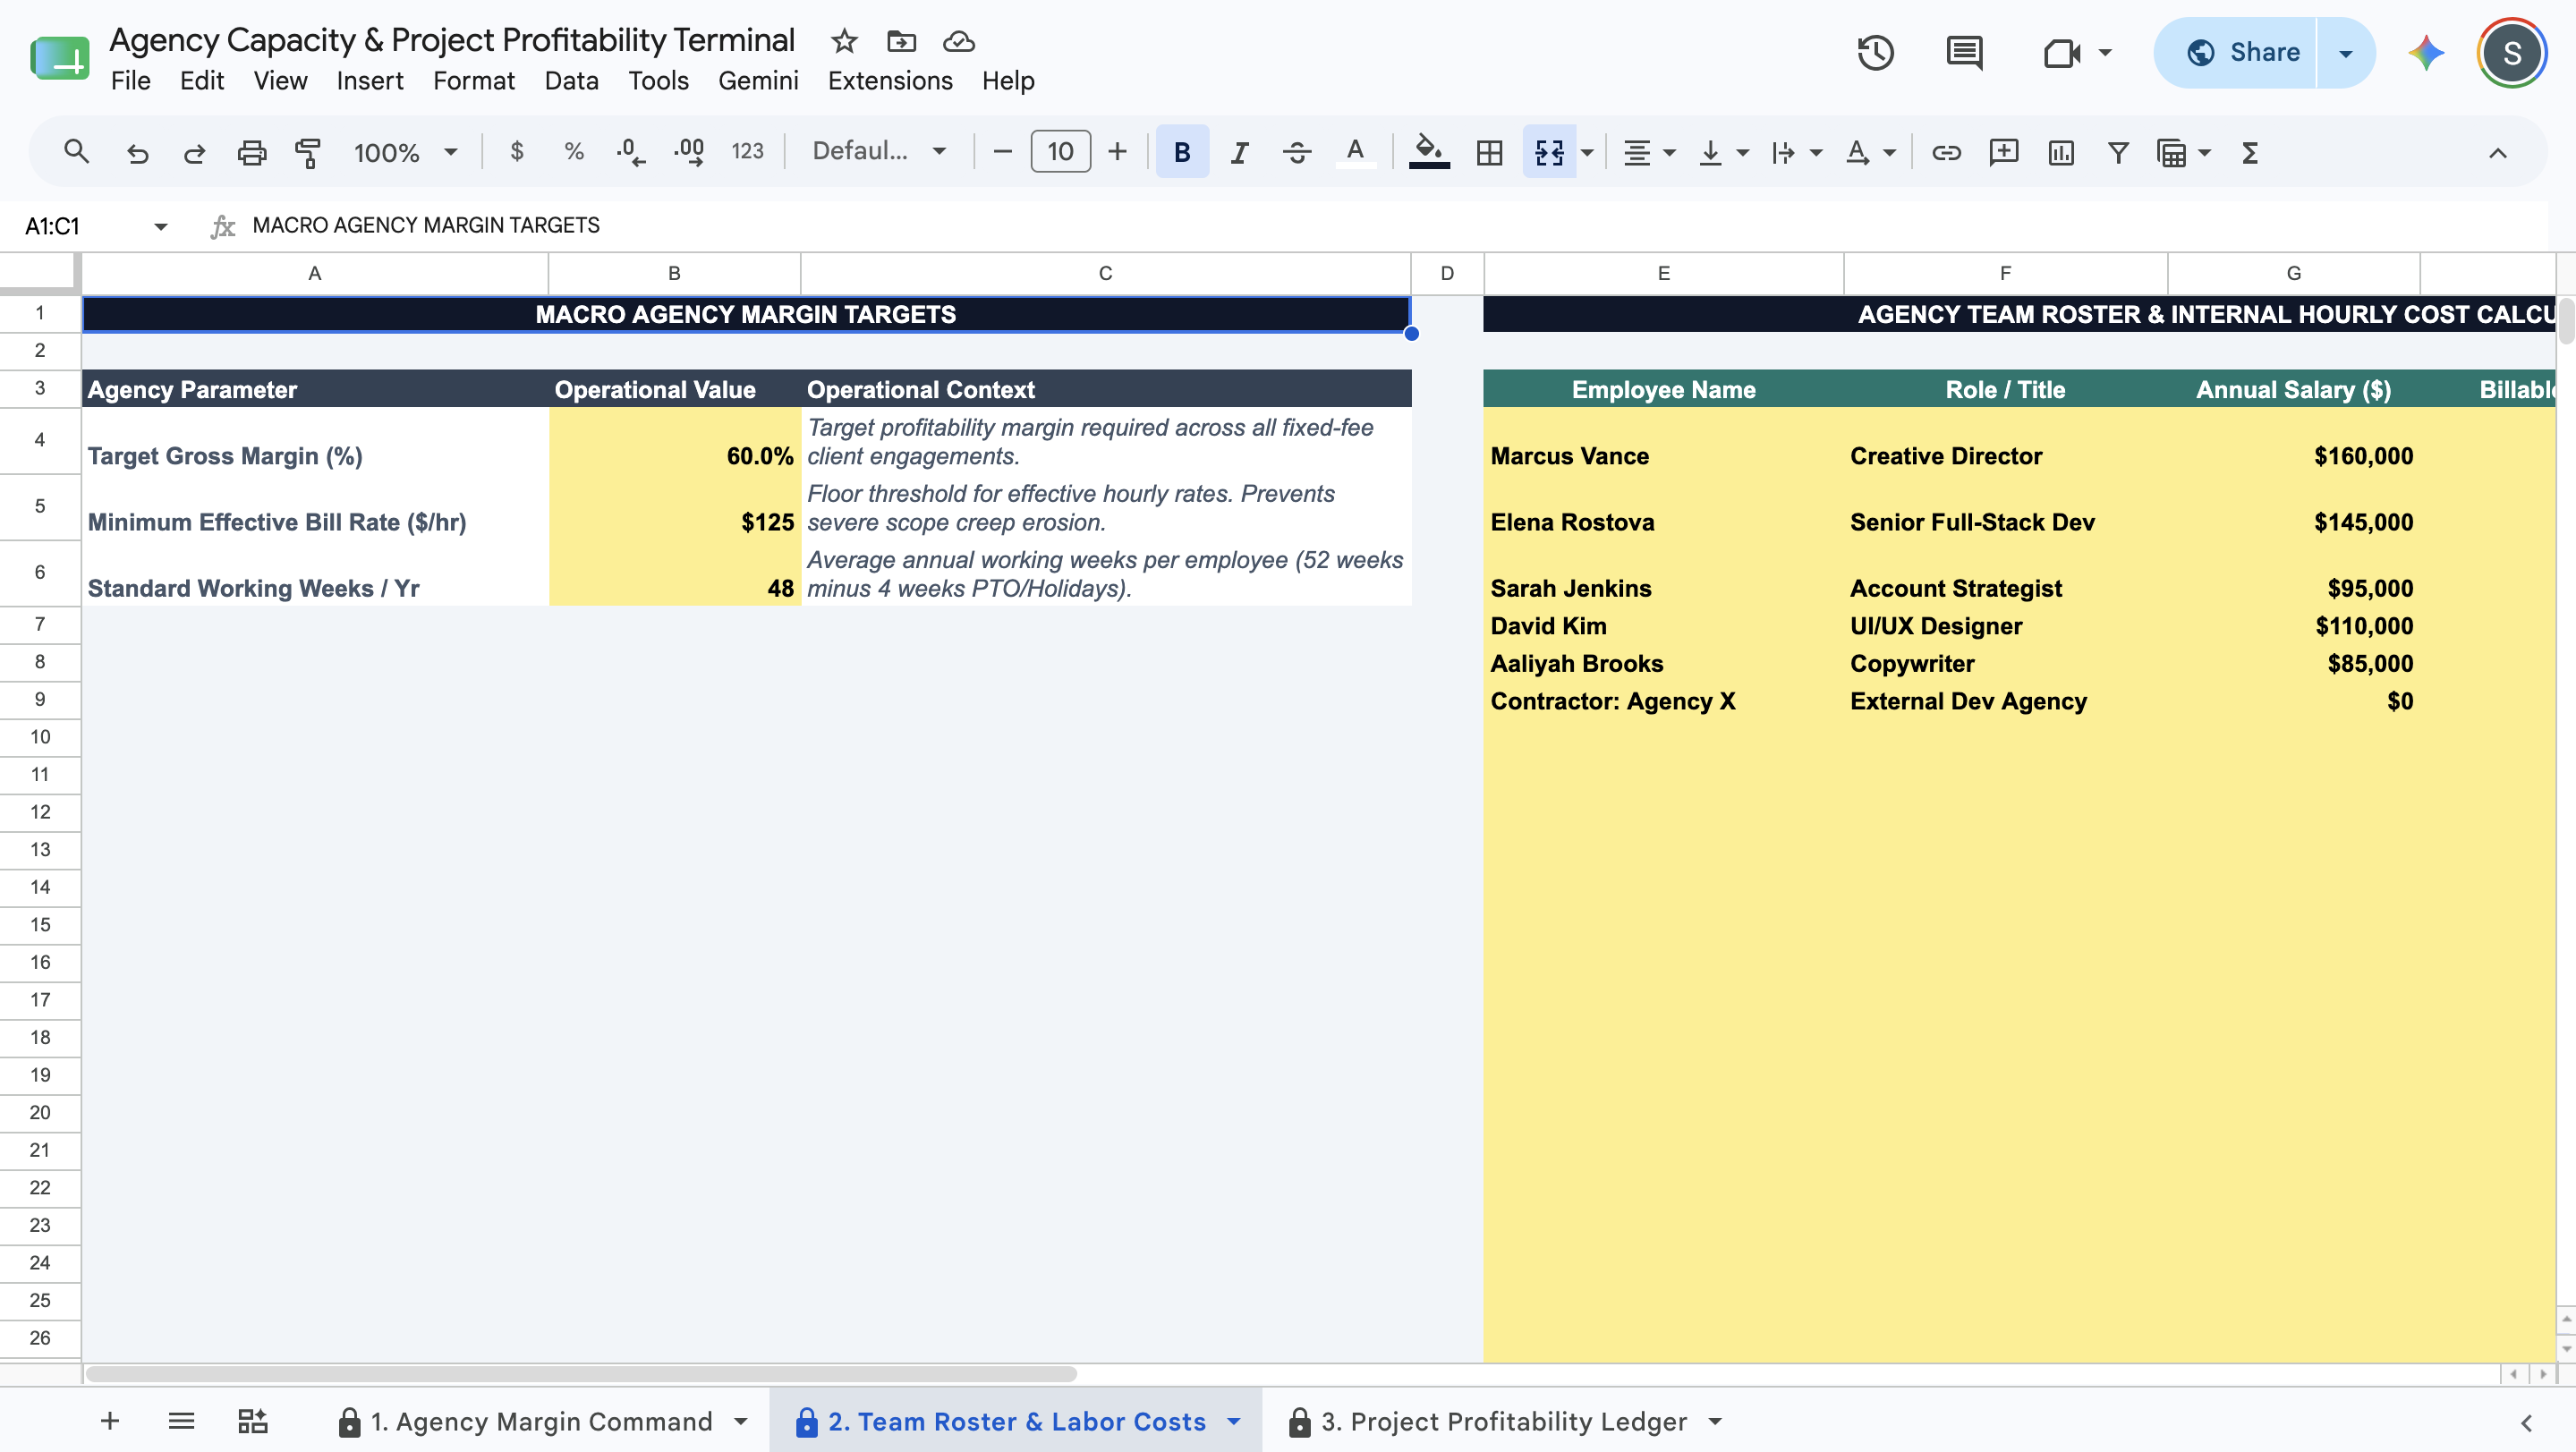
Most resource managers rely on high-level revenue trackers that completely ignore fractional labor costs. The Agency Capacity & Project Profitability Terminal transforms standard project tracking into a CEO-grade unit economics engine. Built natively and exclusively for Google Sheets, it bridges the gap between top-line revenue and actual gross margin:


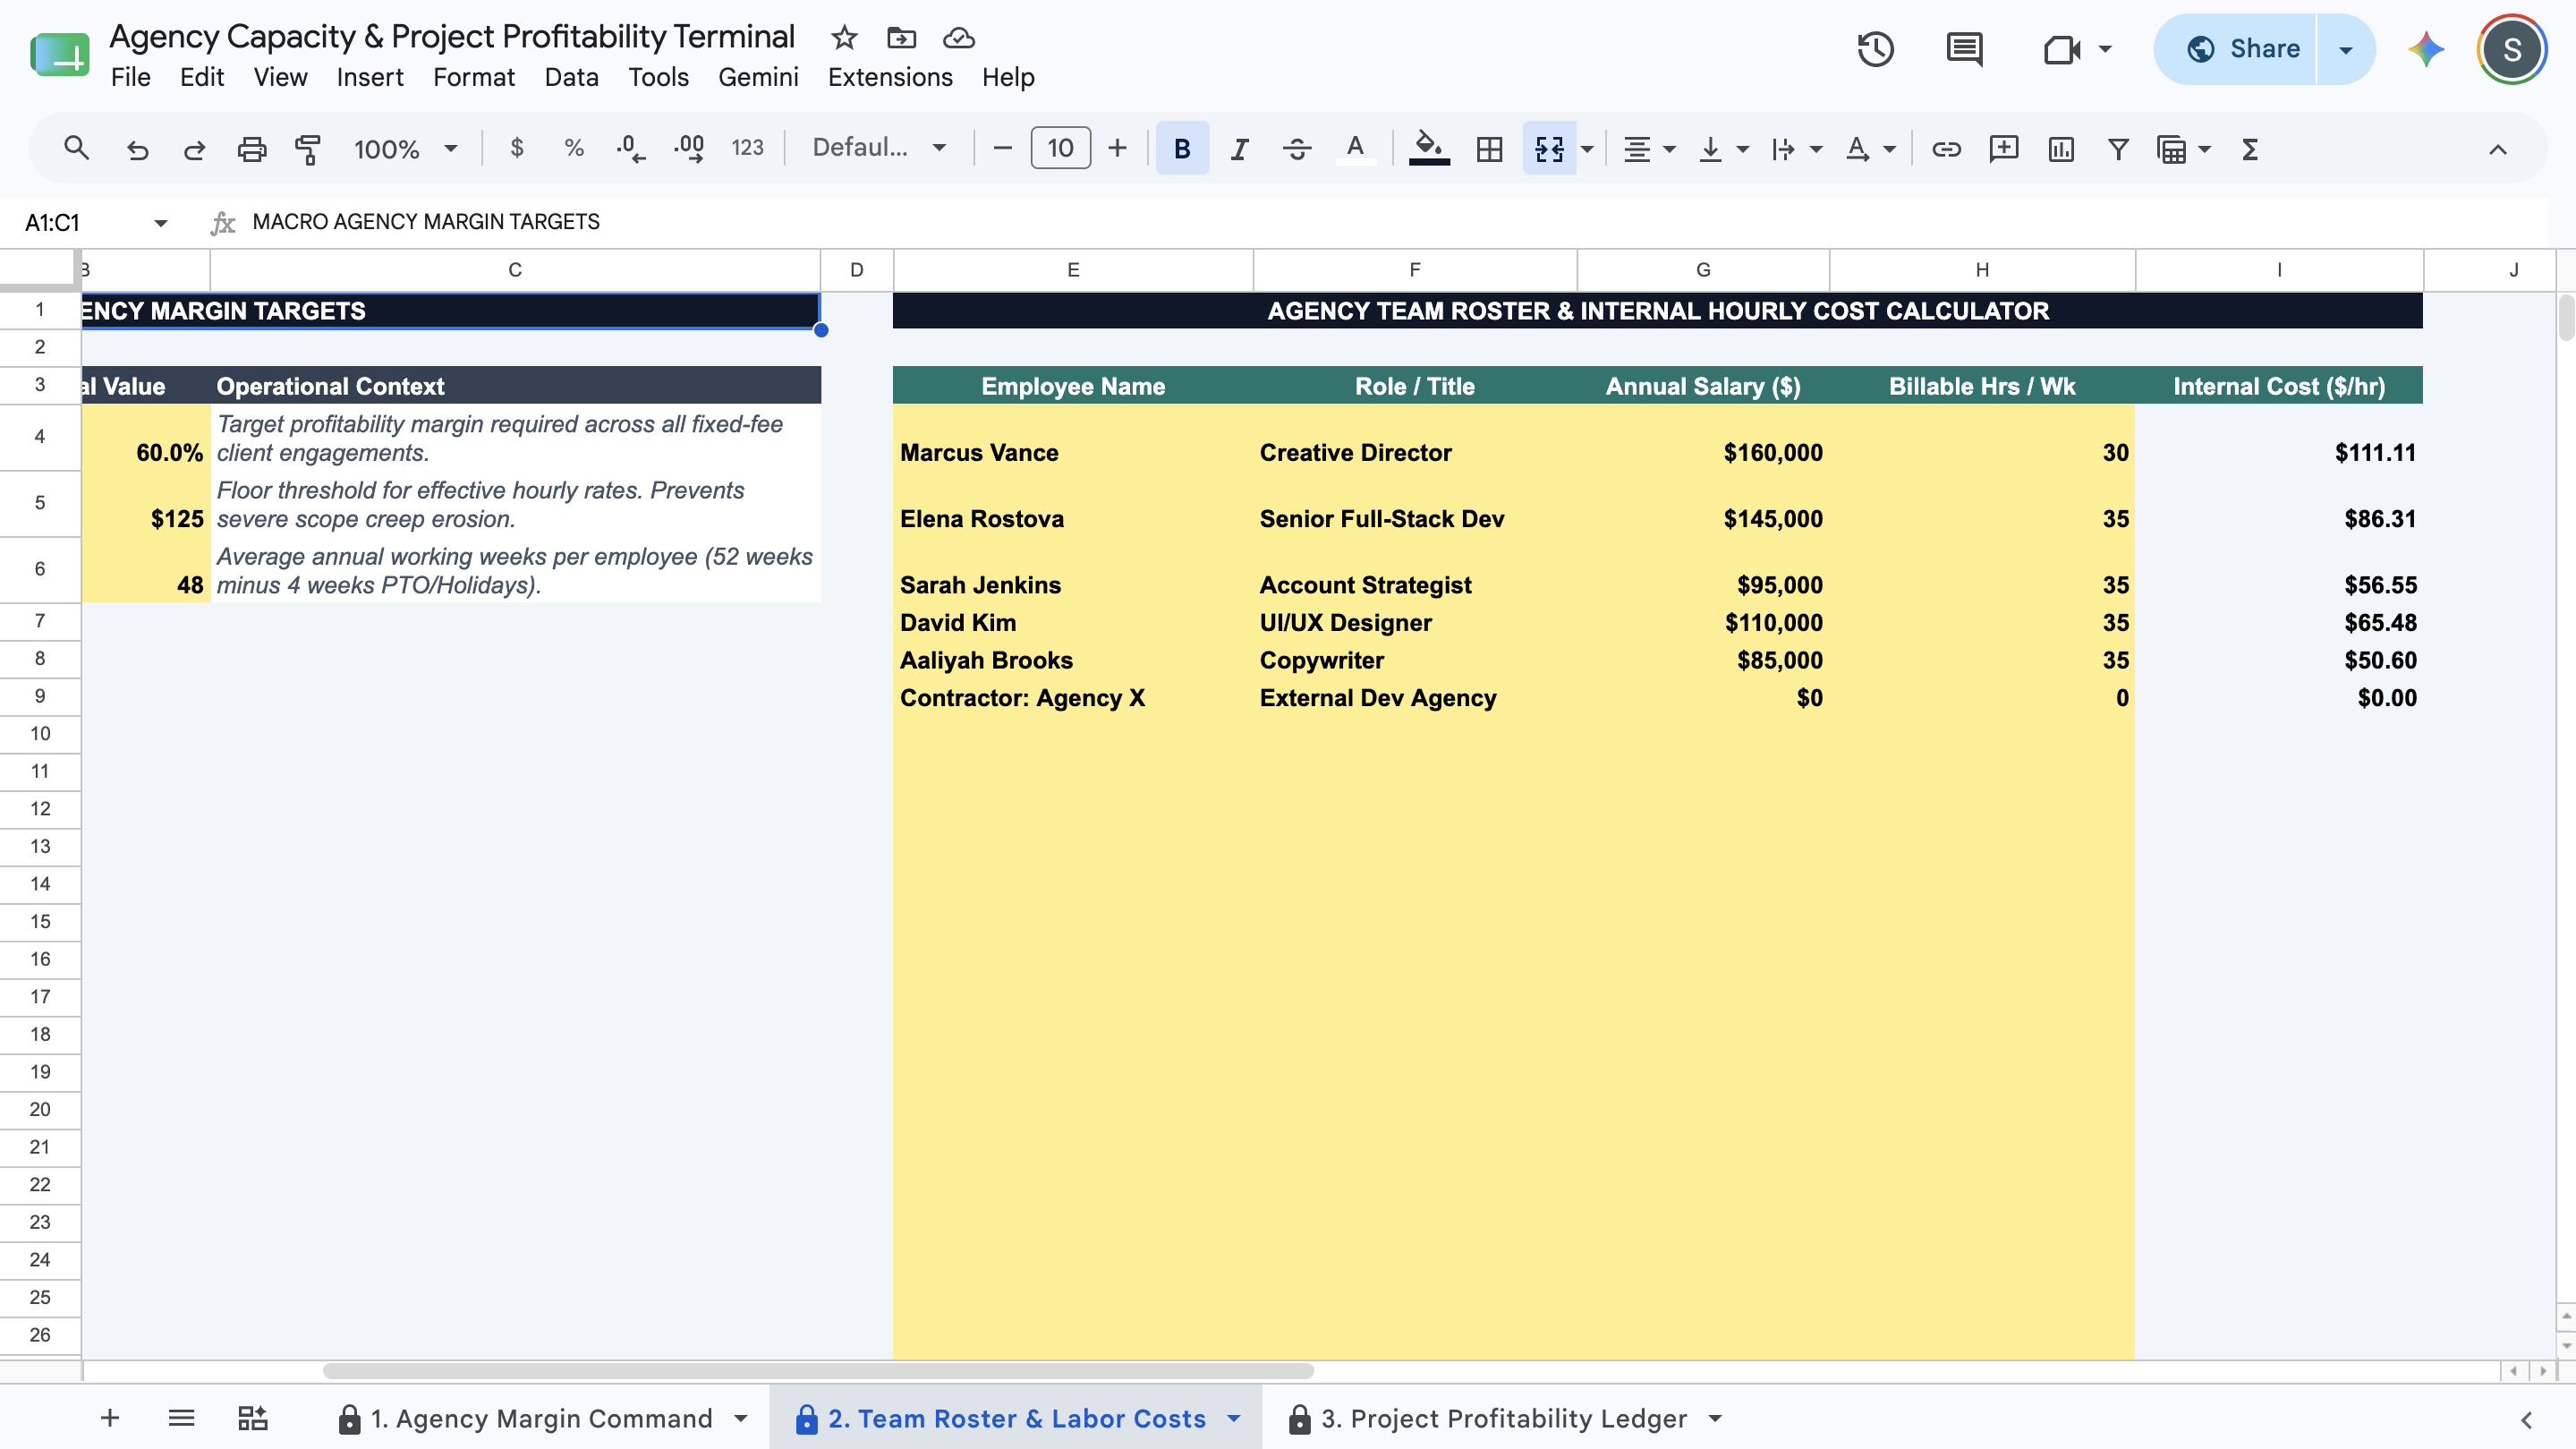
  • Automated Internal Labor Cost Engine: Stop guessing your burn rate. Input your team roster, annual salaries, and target billable hours. The engine automatically calculates the exact, fractional internal cost ($/hr) for every employee in your agency.

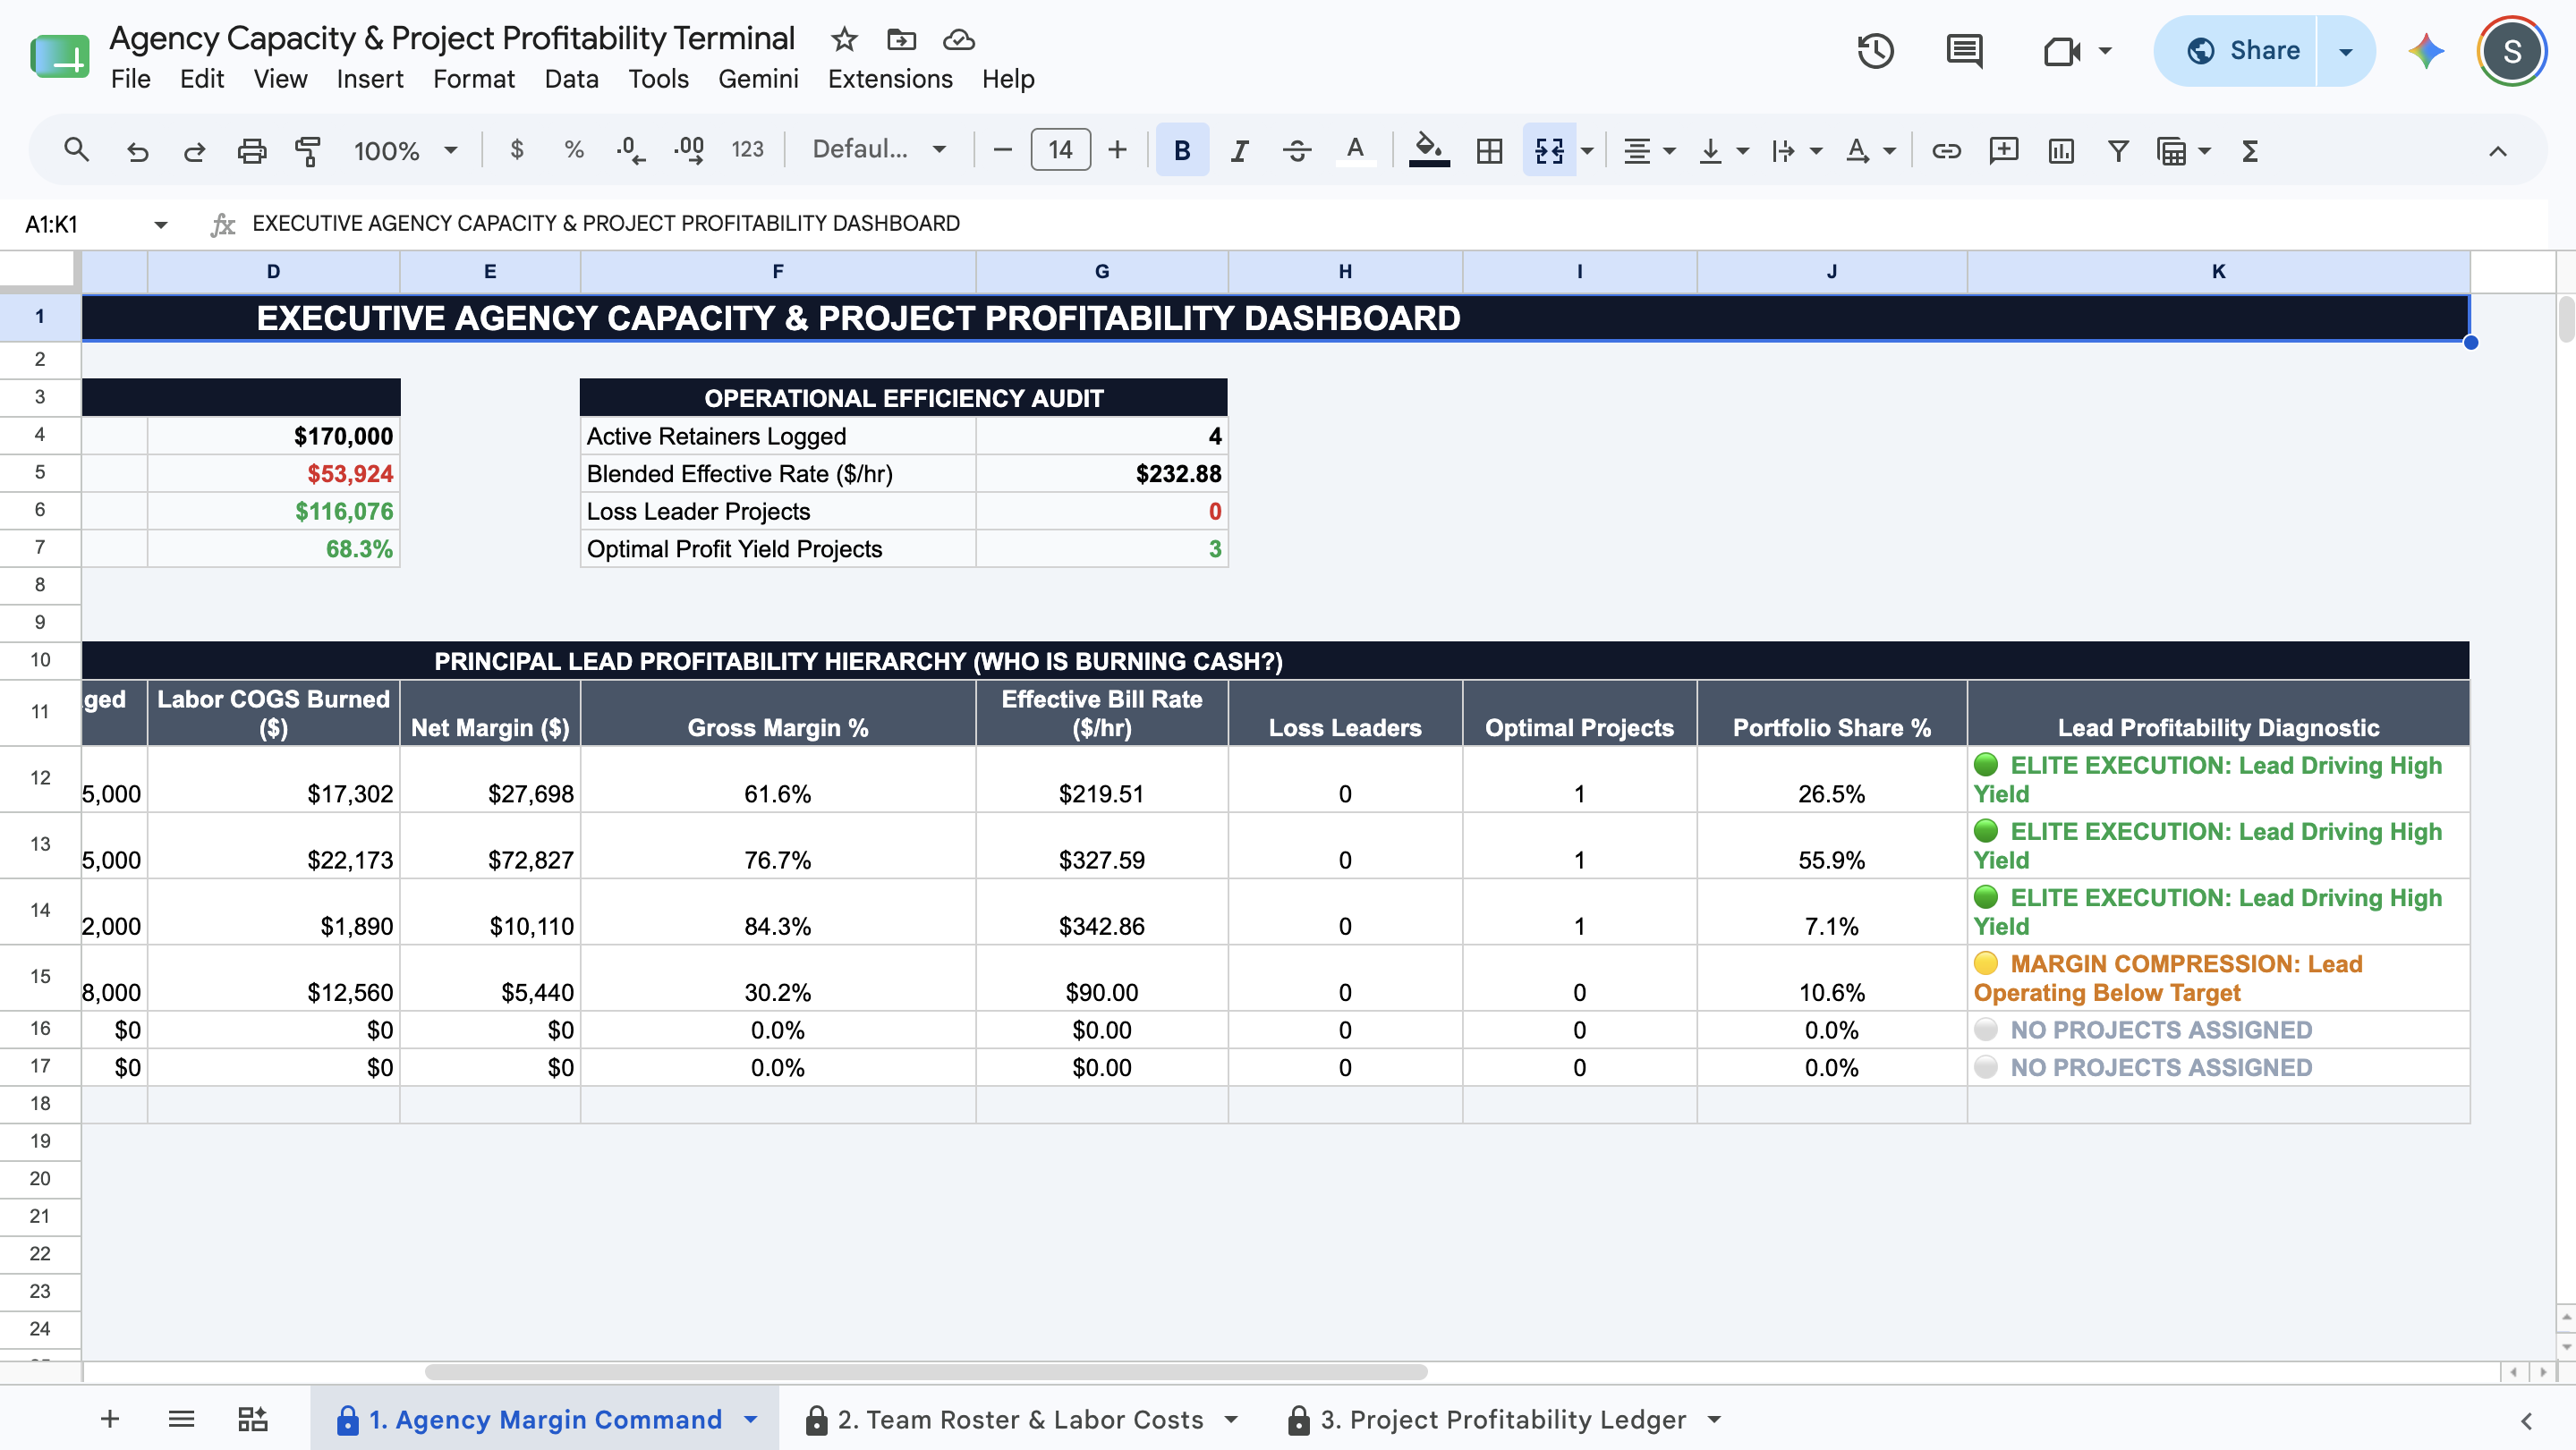
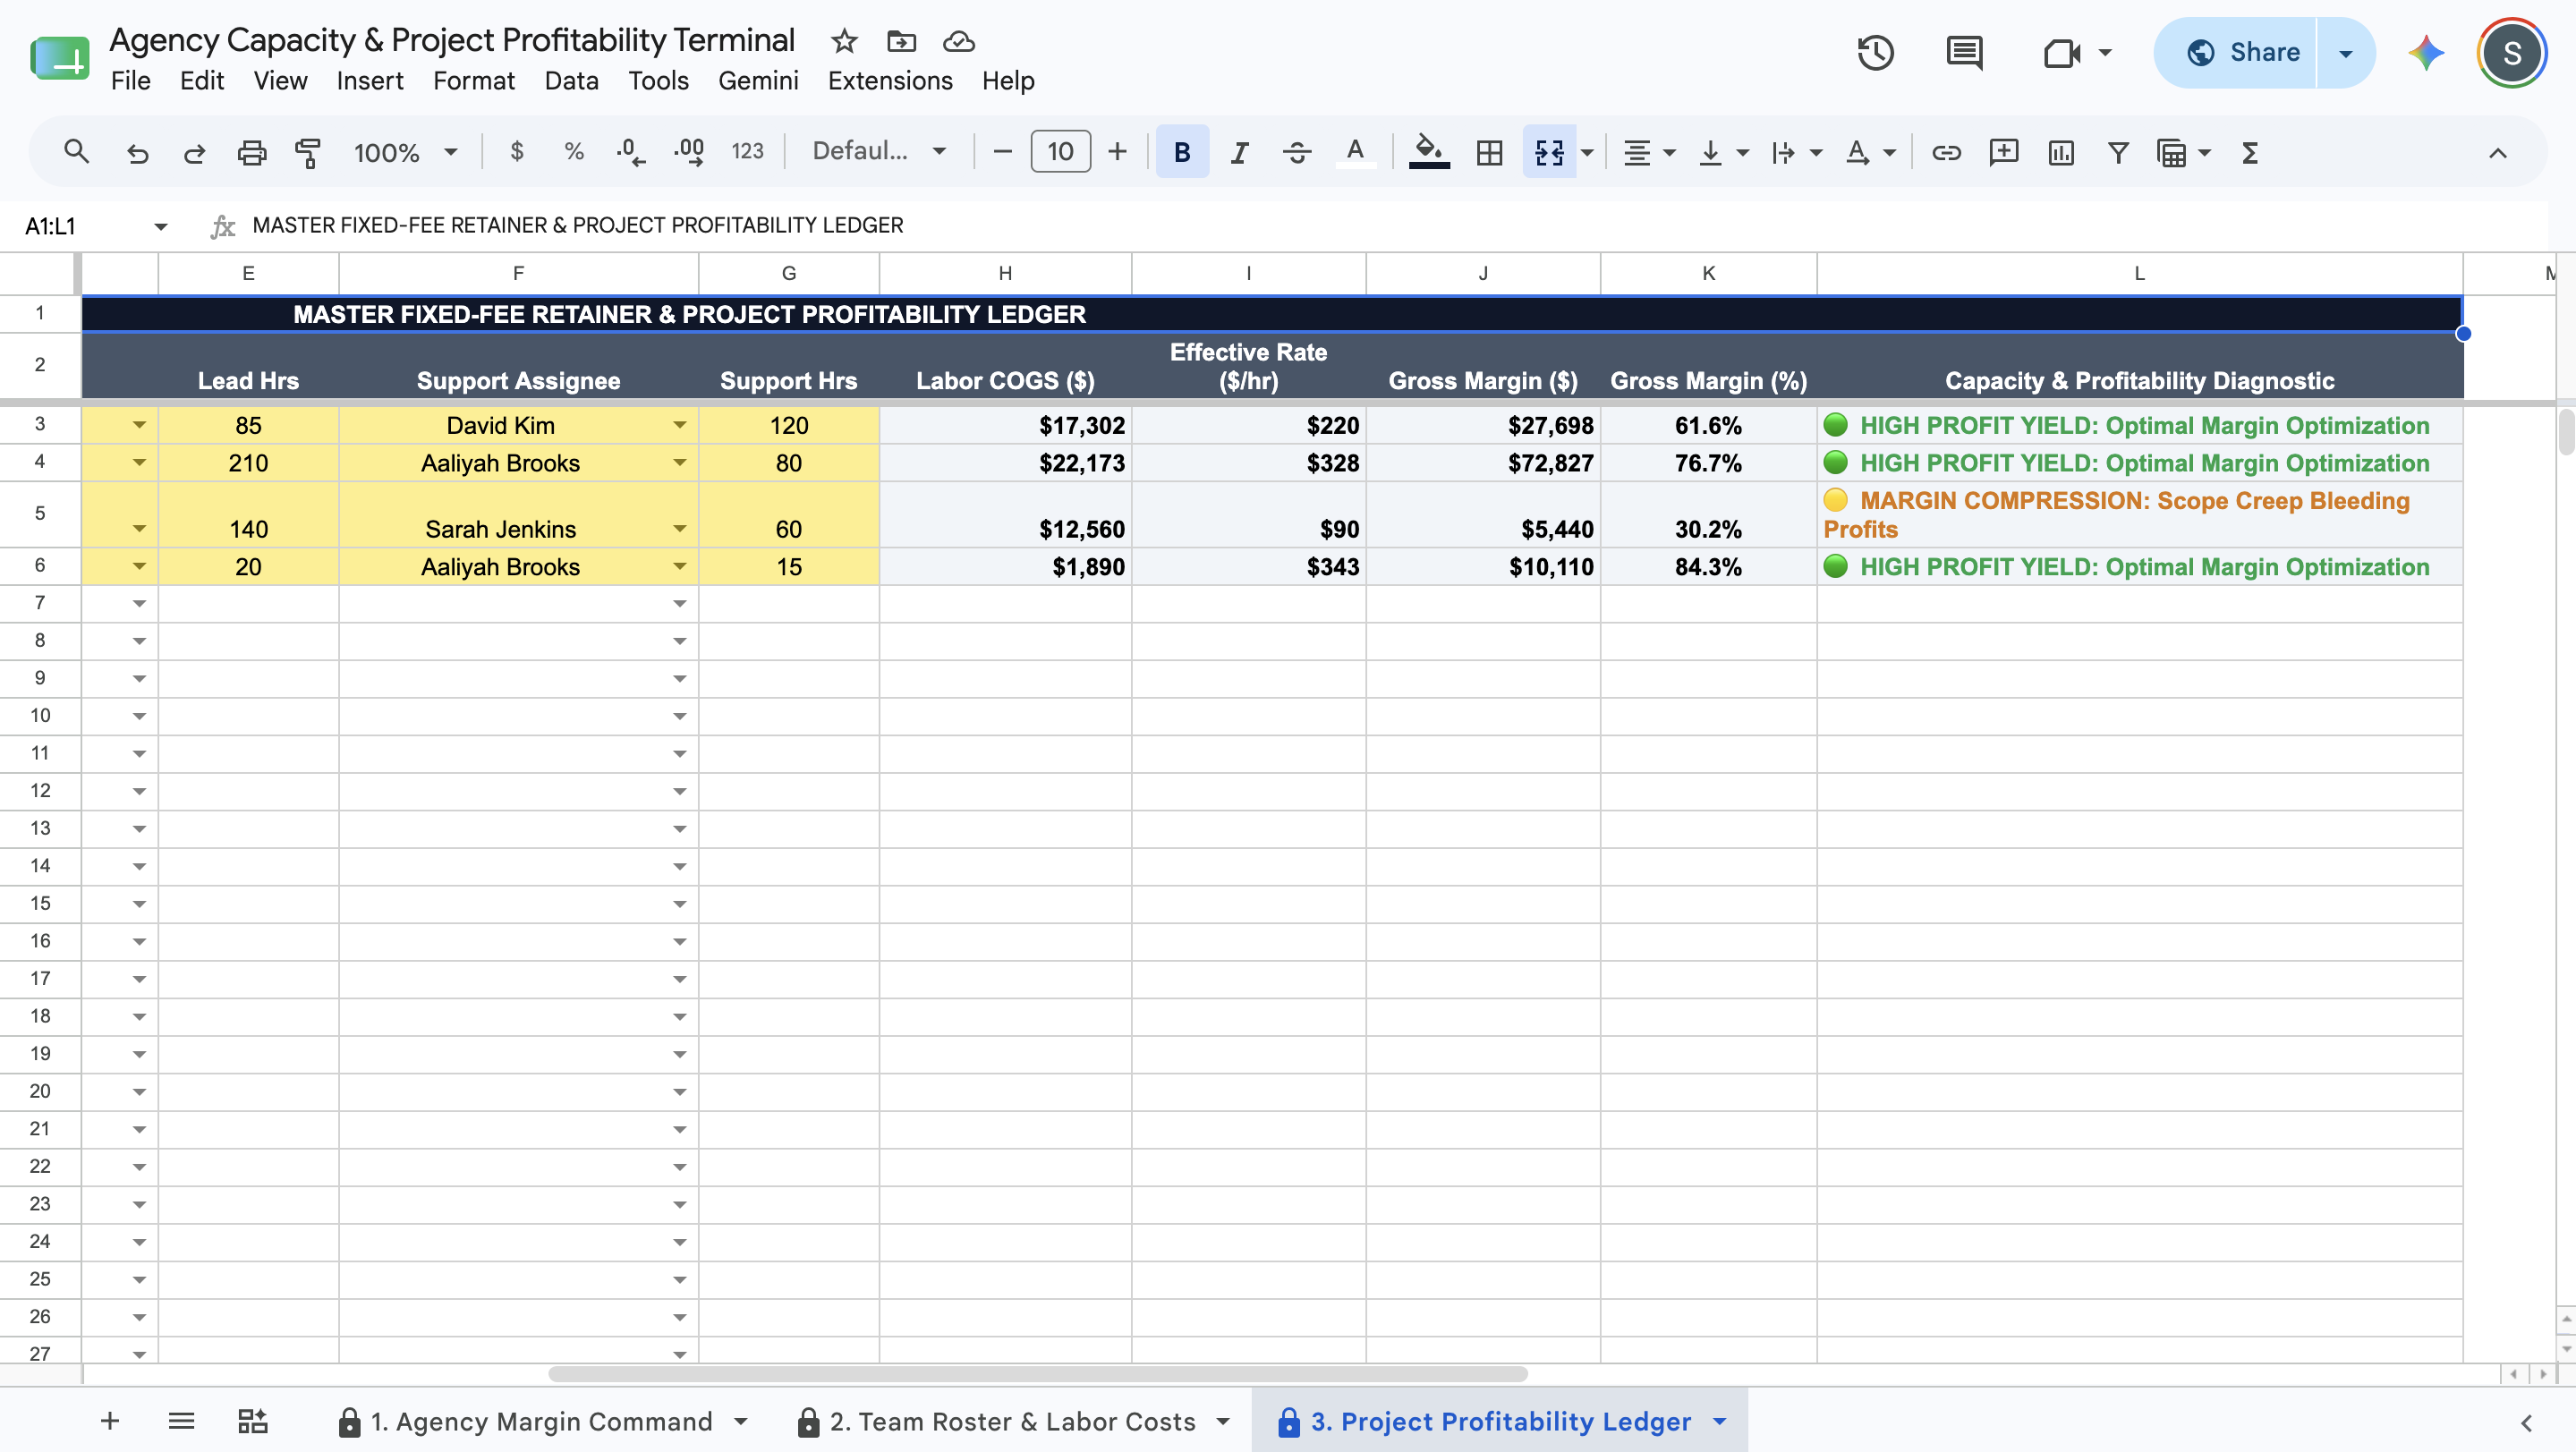
  • The "Trojan Horse" Scope Creep Sentinel: Protect your margins. The system continuously divides fixed-fee revenue by total hours logged to calculate your Effective Bill Rate. If the project margin drops below your target, or if Labor COGS exceed revenue entirely, the engine overrides standard reporting to trigger: 🚨 LOSS LEADER: Labor COGS Exceed Revenue.

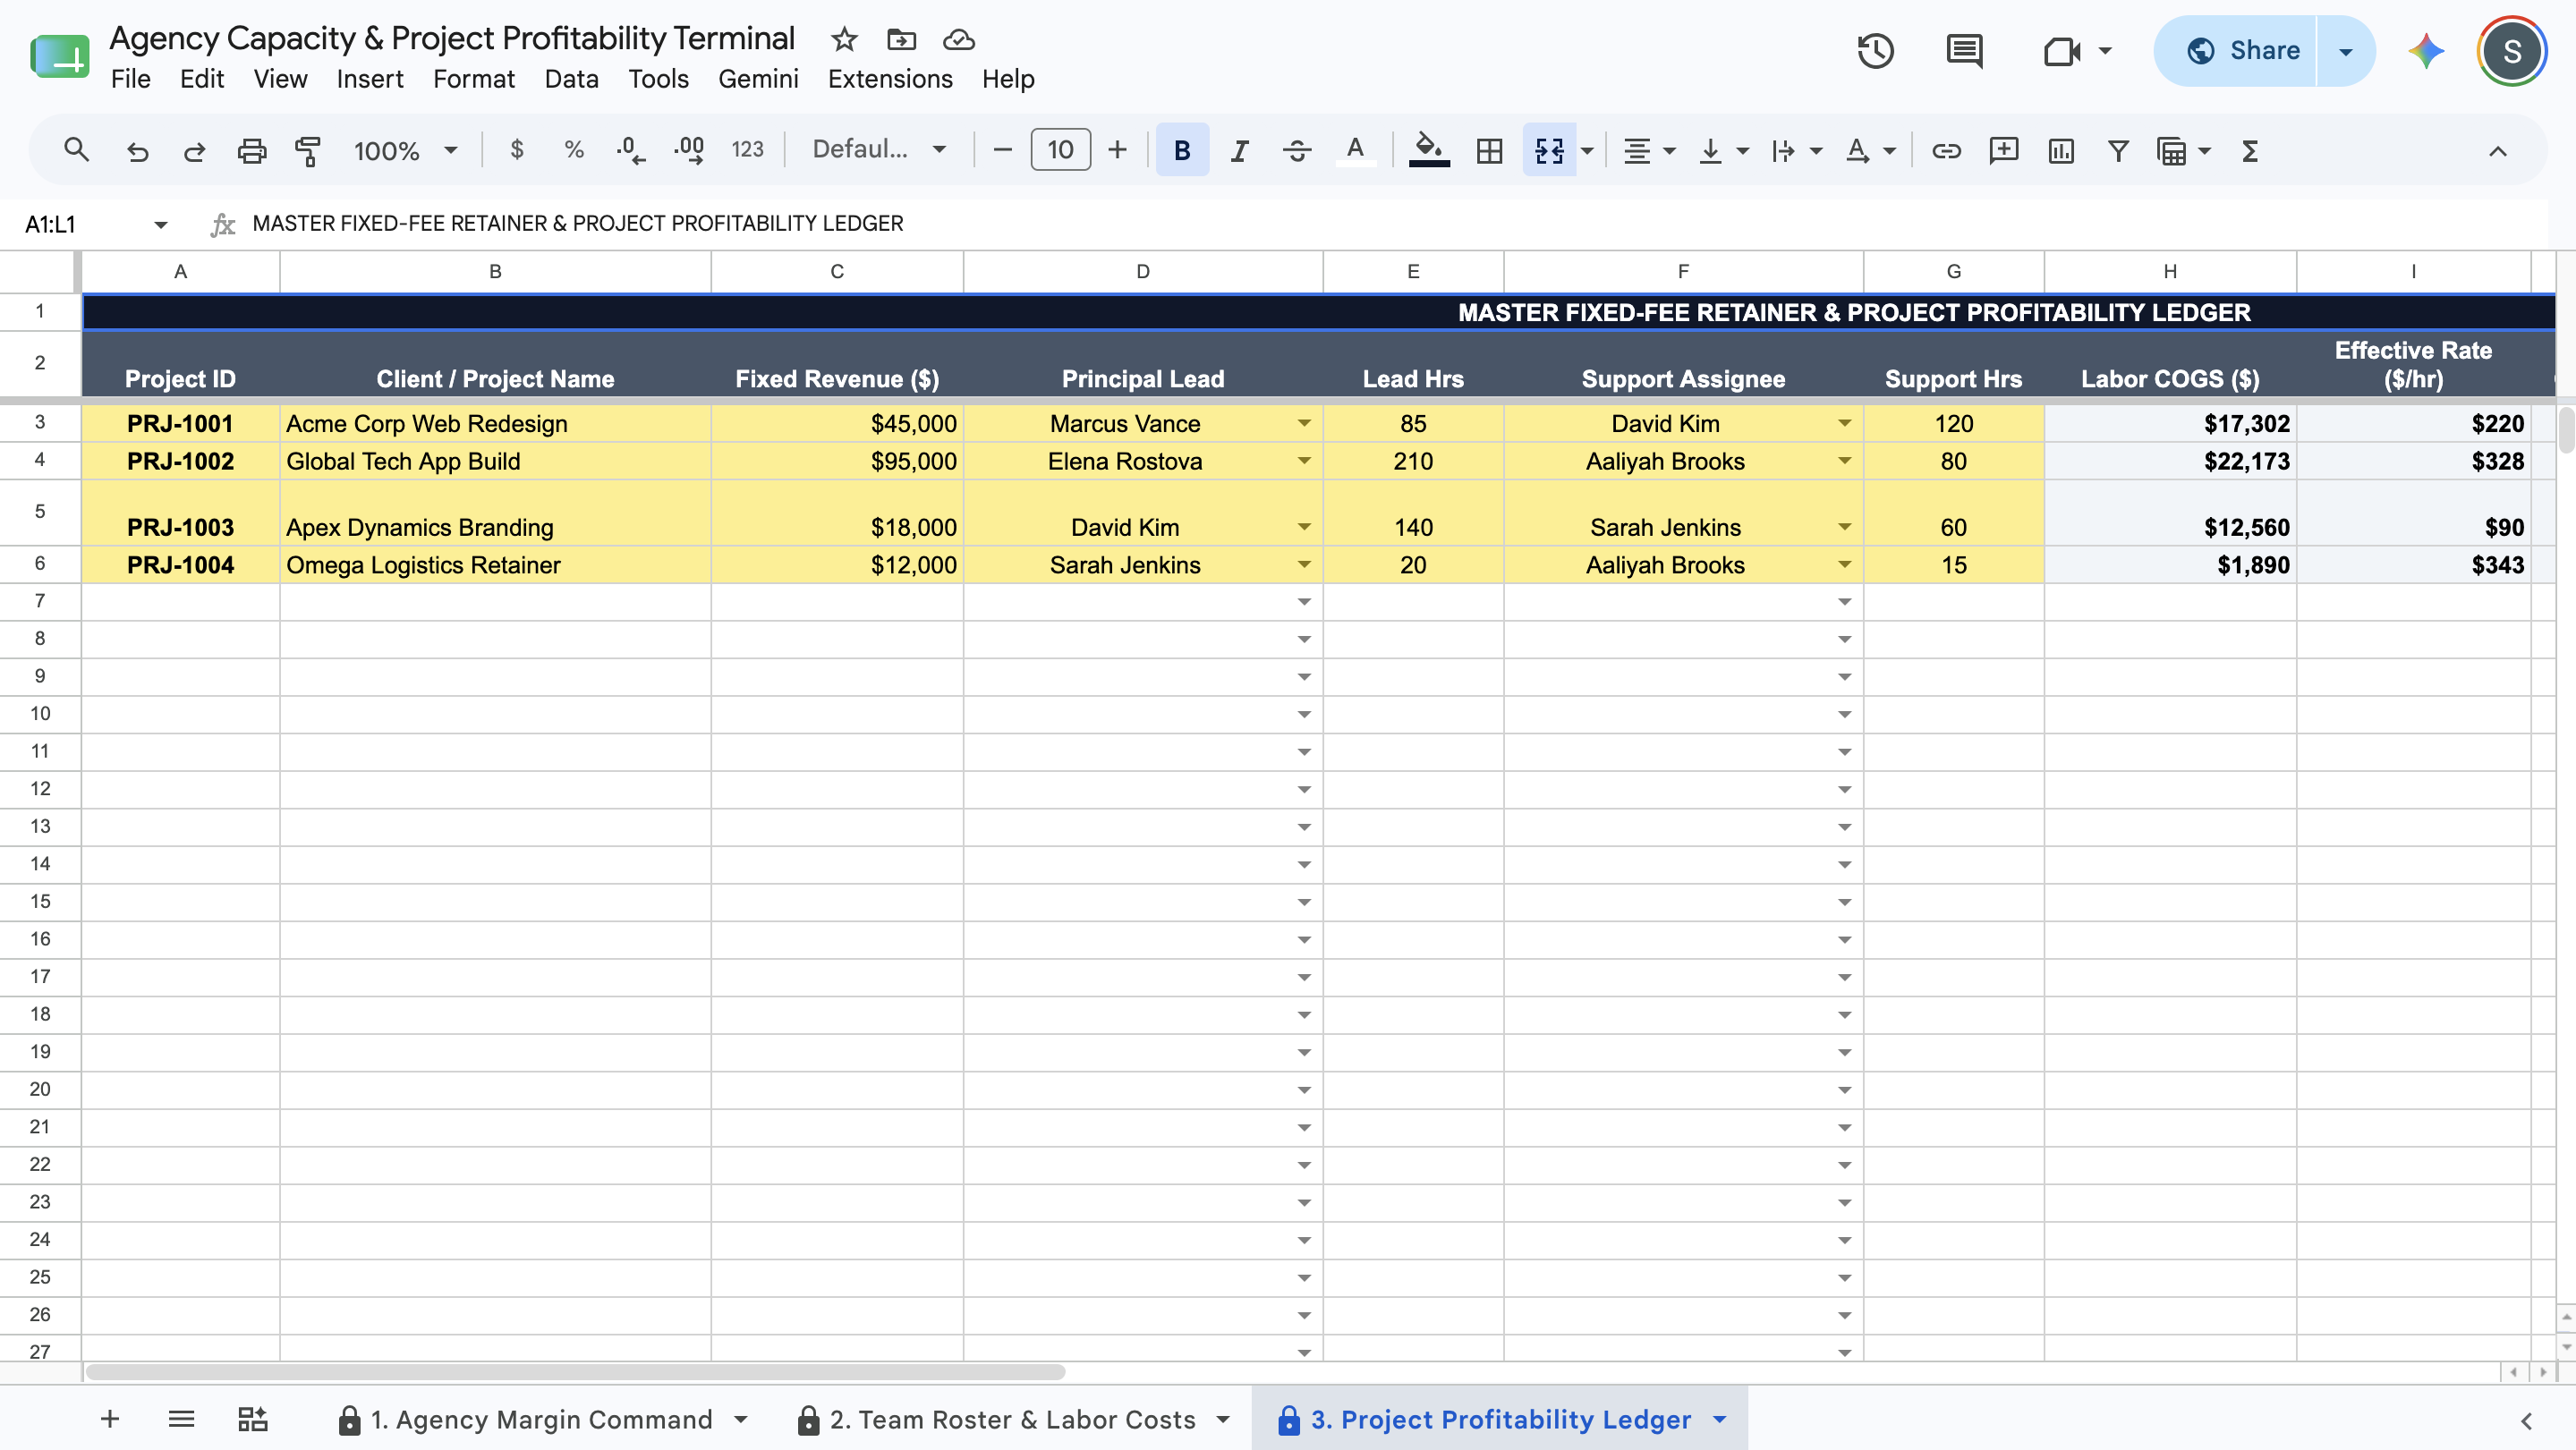
  • Project Profitability Ledger: Log every fixed-fee retainer or sprint. Assign a Principal Lead and Support staff, input their hours, and watch the system instantly calculate Labor COGS ($) and Net Gross Margin (%) in real time.

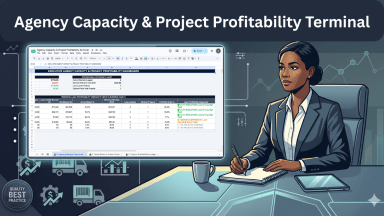
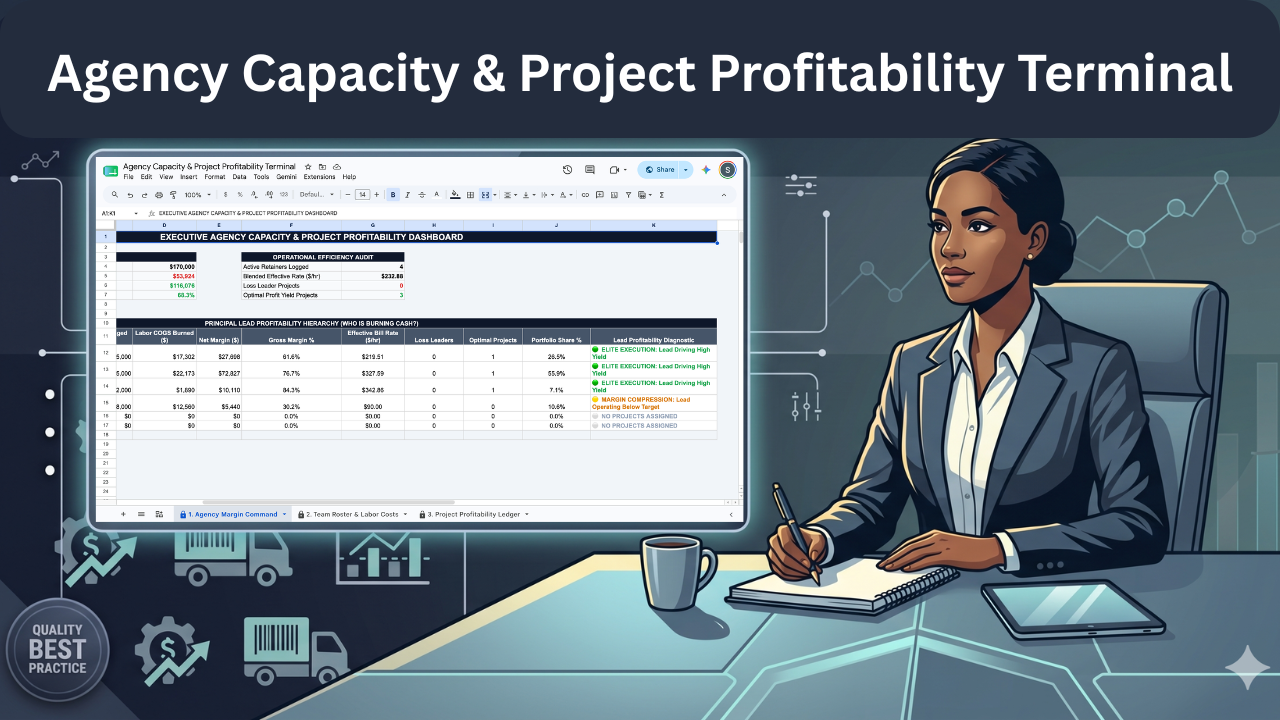
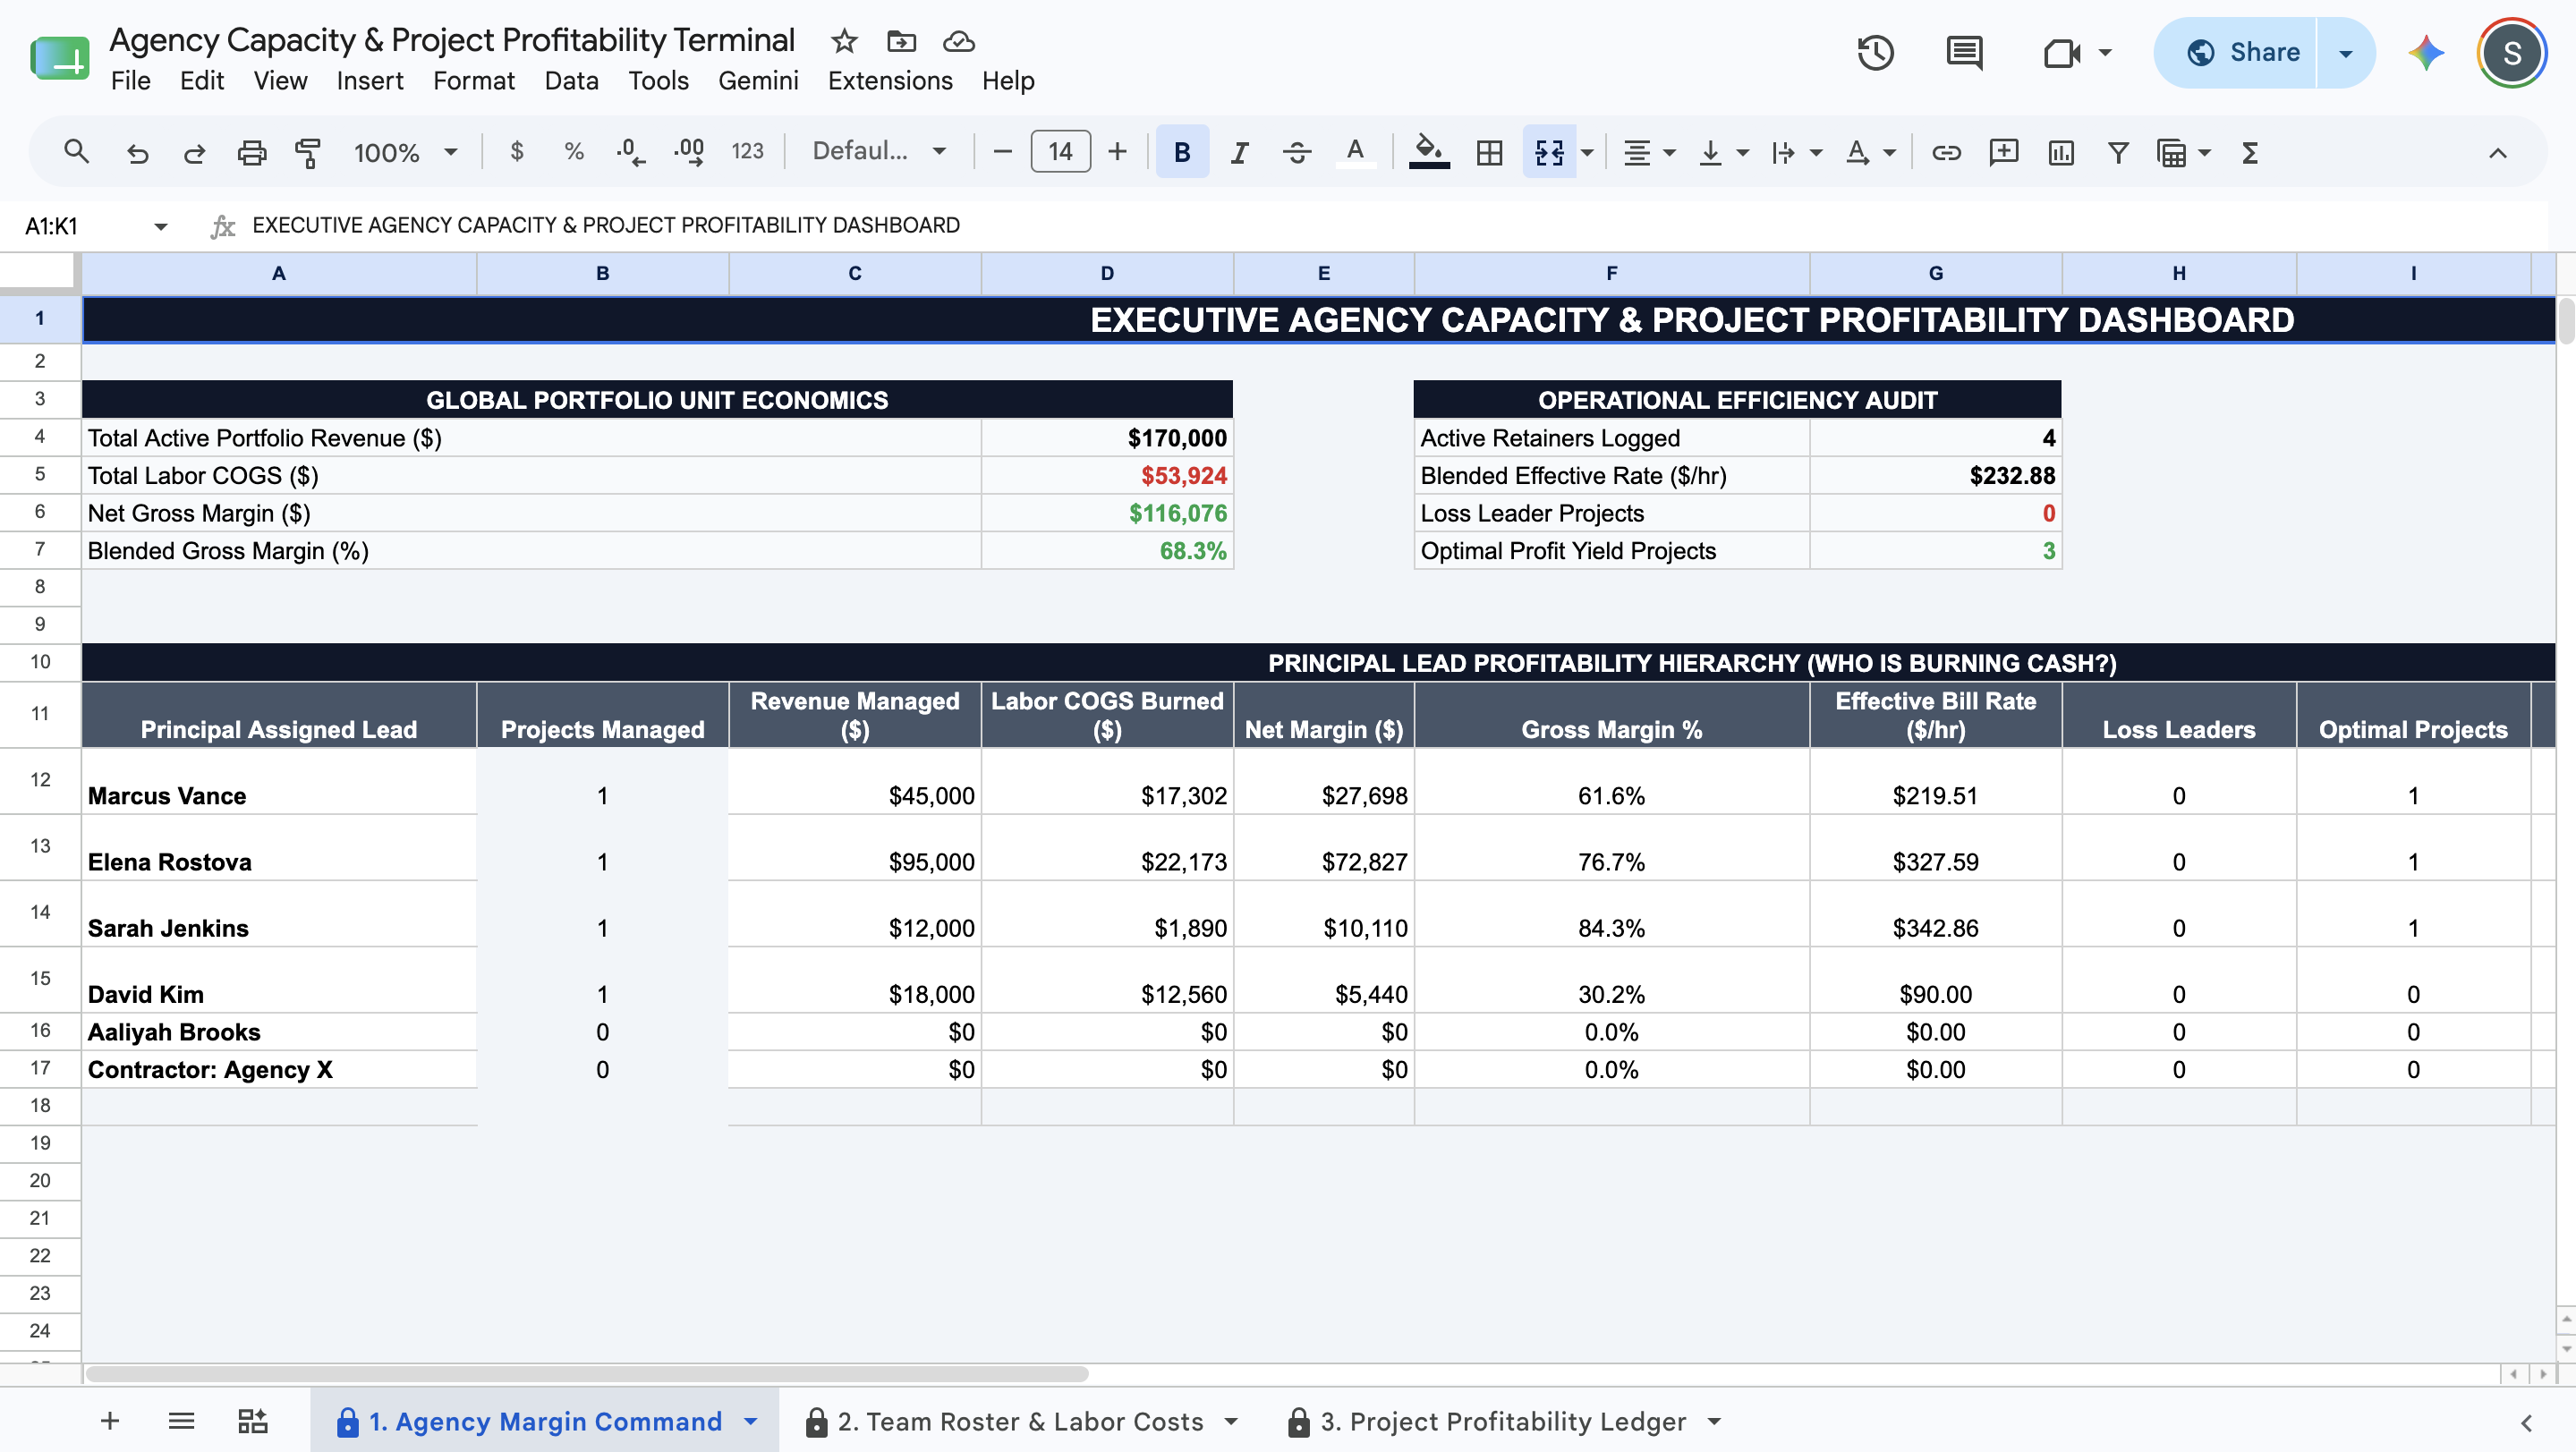
  • The CEO Margin Command Center: Get an instant, bird's-eye view of your entire agency's operational efficiency. Monitor Total Active Portfolio Revenue ($), Total Labor COGS ($), and your Blended Gross Margin (%) across the entire active client roster.

  • Principal Lead Profitability Hierarchy: A software-grade executive summary table that ranks your agency leads side-by-side. See exactly who is driving 🟢 ELITE EXECUTION and who is triggering 🚨 CRITICAL SCOPE CREEP. Hold managers accountable for the margins they actually produce, not just the revenue they manage.

  • Digitally Shrink-Wrapped Architecture: Engineered strictly as a cloud-native Google Sheet. Only the soft yellow (#FEF08A) input cells are unprotected. Your master labor COGS algorithms, effective rate equations, and presentation dashboards are entirely locked down to guarantee zero operational calculation drift or #REF! errors.


Stop guessing your agency margins, bleeding cash on scope creep, or letting unprofitable clients dictate your bandwidth. Establish institutional command over your unit economics, identify your true gross margin, and export clean, grid-free PDF profitability memorandums natively from your web browser.

This Best Practice includes
1 Google Sheet, 1 User Guide

Acquire business license for $19.00 $1.90

Add to cart

Add to bookmarks

Discuss

Further information

Calculate the exact fractional Internal Hourly Cost ($/hr) for every employee based on salary and target billable bandwidth

Measure true Labor COGS ($) against fixed-fee project retainers to determine accurate Net Gross Margin (%)

Automate risk detection by triggering visual alarms for loss leader projects and severe scope creep

Track the Blended Effective Bill Rate ($/hr) across the entire active client portfolio to ensure premium time valuation

Rank Principal Leads side-by-side to determine which managers drive elite margins and which managers burn internal cash

Export an immutable, grid-free PDF margin memorandum to run weekly resource allocation and partner syncs

Agency owners, Managing Directors, and CFOs running creative, development, or consulting firms

Resource managers who need to translate fixed-fee revenue into actual profitability based on internal labor costs

Scaling shops transitioning from basic revenue tracking to advanced unit economics and gross margin optimization

Teams looking to identify toxic, unprofitable legacy clients who are dragging down the agency's blended effective rate

Solo freelancers looking for a simple time-tracking sheet without internal cost or margin calculations

Agencies requiring real-time, bidirectional API integrations with enterprise time-tracking software like Harvest, Toggl, or Jira

Users looking for a standard Microsoft Excel (.xlsx) file workbook (This asset is built natively and exclusively for Google Sheets)


0.0 / 5 (0 votes)

please wait...