
Originally published: 13/05/2026 08:10
Publication number: ELQ-49948-1
View all versions & Certificate
Publication number: ELQ-49948-1
View all versions & Certificate

Parking Lot Development – 10 Year Financial Model
10-year financial model for a parking lot development providing forecasts, feasibility insights, and valuation to support investment planning and growth.
real estate developmentcommercial real estateparking lotparking spacespraking fees revenuevehicle parkingproject financecash flow analysisstartupfinancial model
Description
A parking lot is a land-based facility that provides designated spaces for vehicle parking, serving drivers who need short-term or long-term access near destinations such as offices, retail centers, airports, or event venues. It can operate as self-park or valet and may include features like payment kiosks or mobile payment, lighting, security cameras, access control, and EV charging. Revenue is typically generated through hourly, daily, or monthly fees and permits, with performance driven by location, utilization, pricing strategy, and operating costs such as staffing, maintenance, and security.
This 10-year Parking Lot Development financial model provides a full feasibility and underwriting view—from land acquisition and construction through ramp-up, stabilized operations, and exit. It models capacity and utilization, pricing by product (hourly/daily, monthly permits), seasonality, and ancillary income, while capturing key operating drivers including staffing, payment systems, maintenance, security, insurance, property taxes, and resurfacing capex reserves. The model is fully integrated with financing assumptions and return metrics, with scenario and sensitivity analysis to test demand, pricing, and cost inflation—supporting lender underwriting and investor decision-making.
The structure of the template follows Financial Modeling Best Practices principles and is fully customizable.
Model Structure
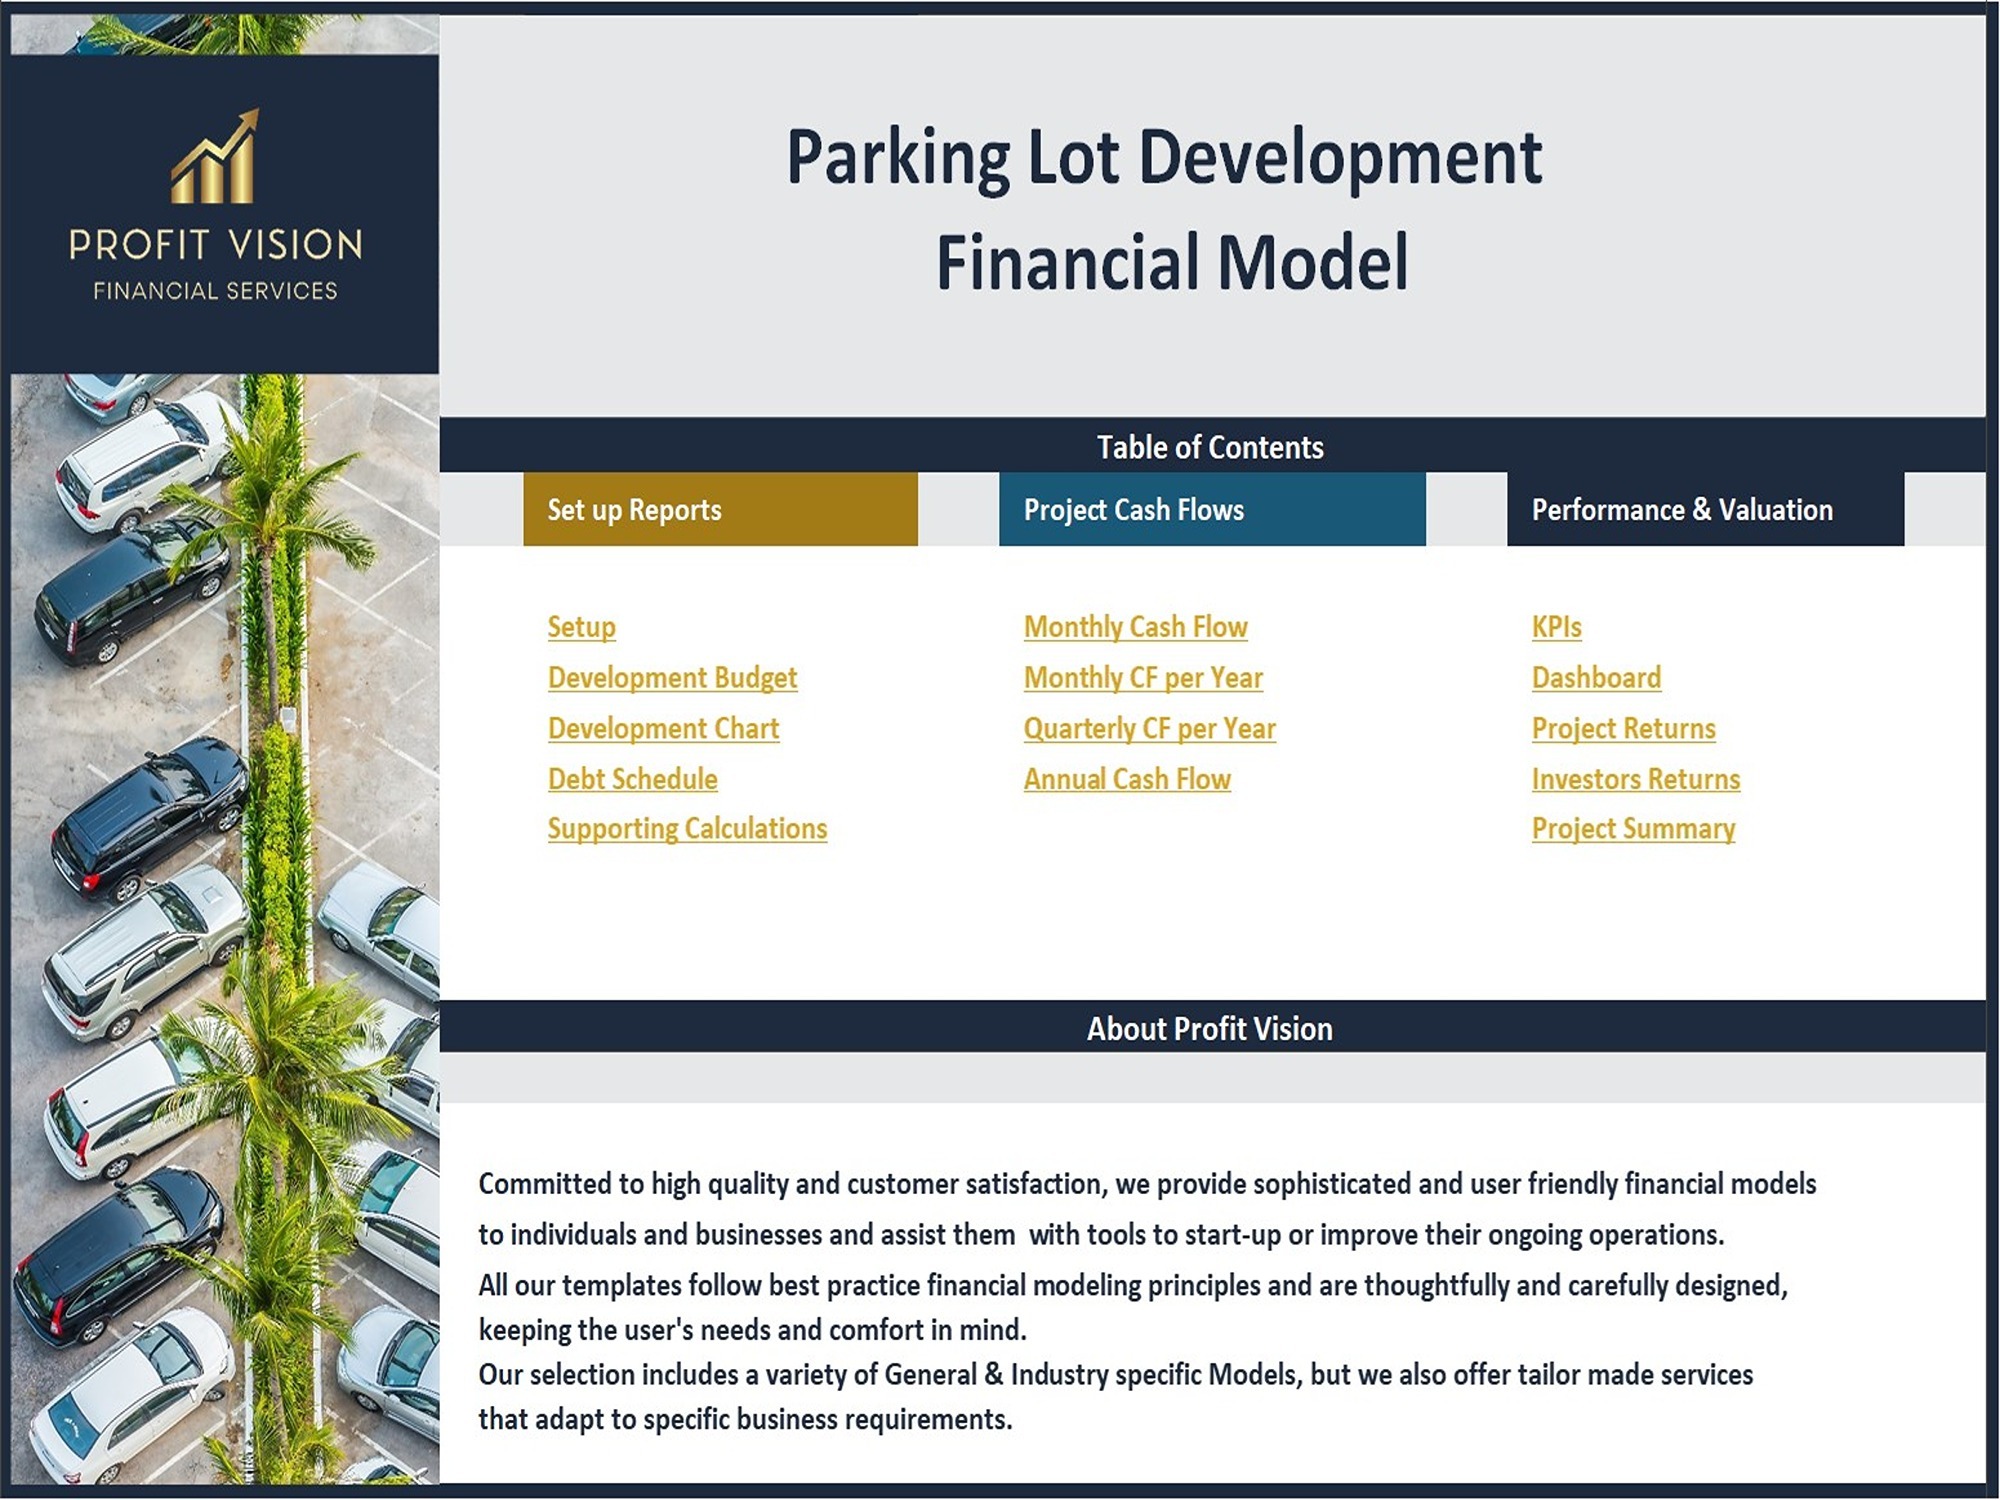
• Setup Assumptions
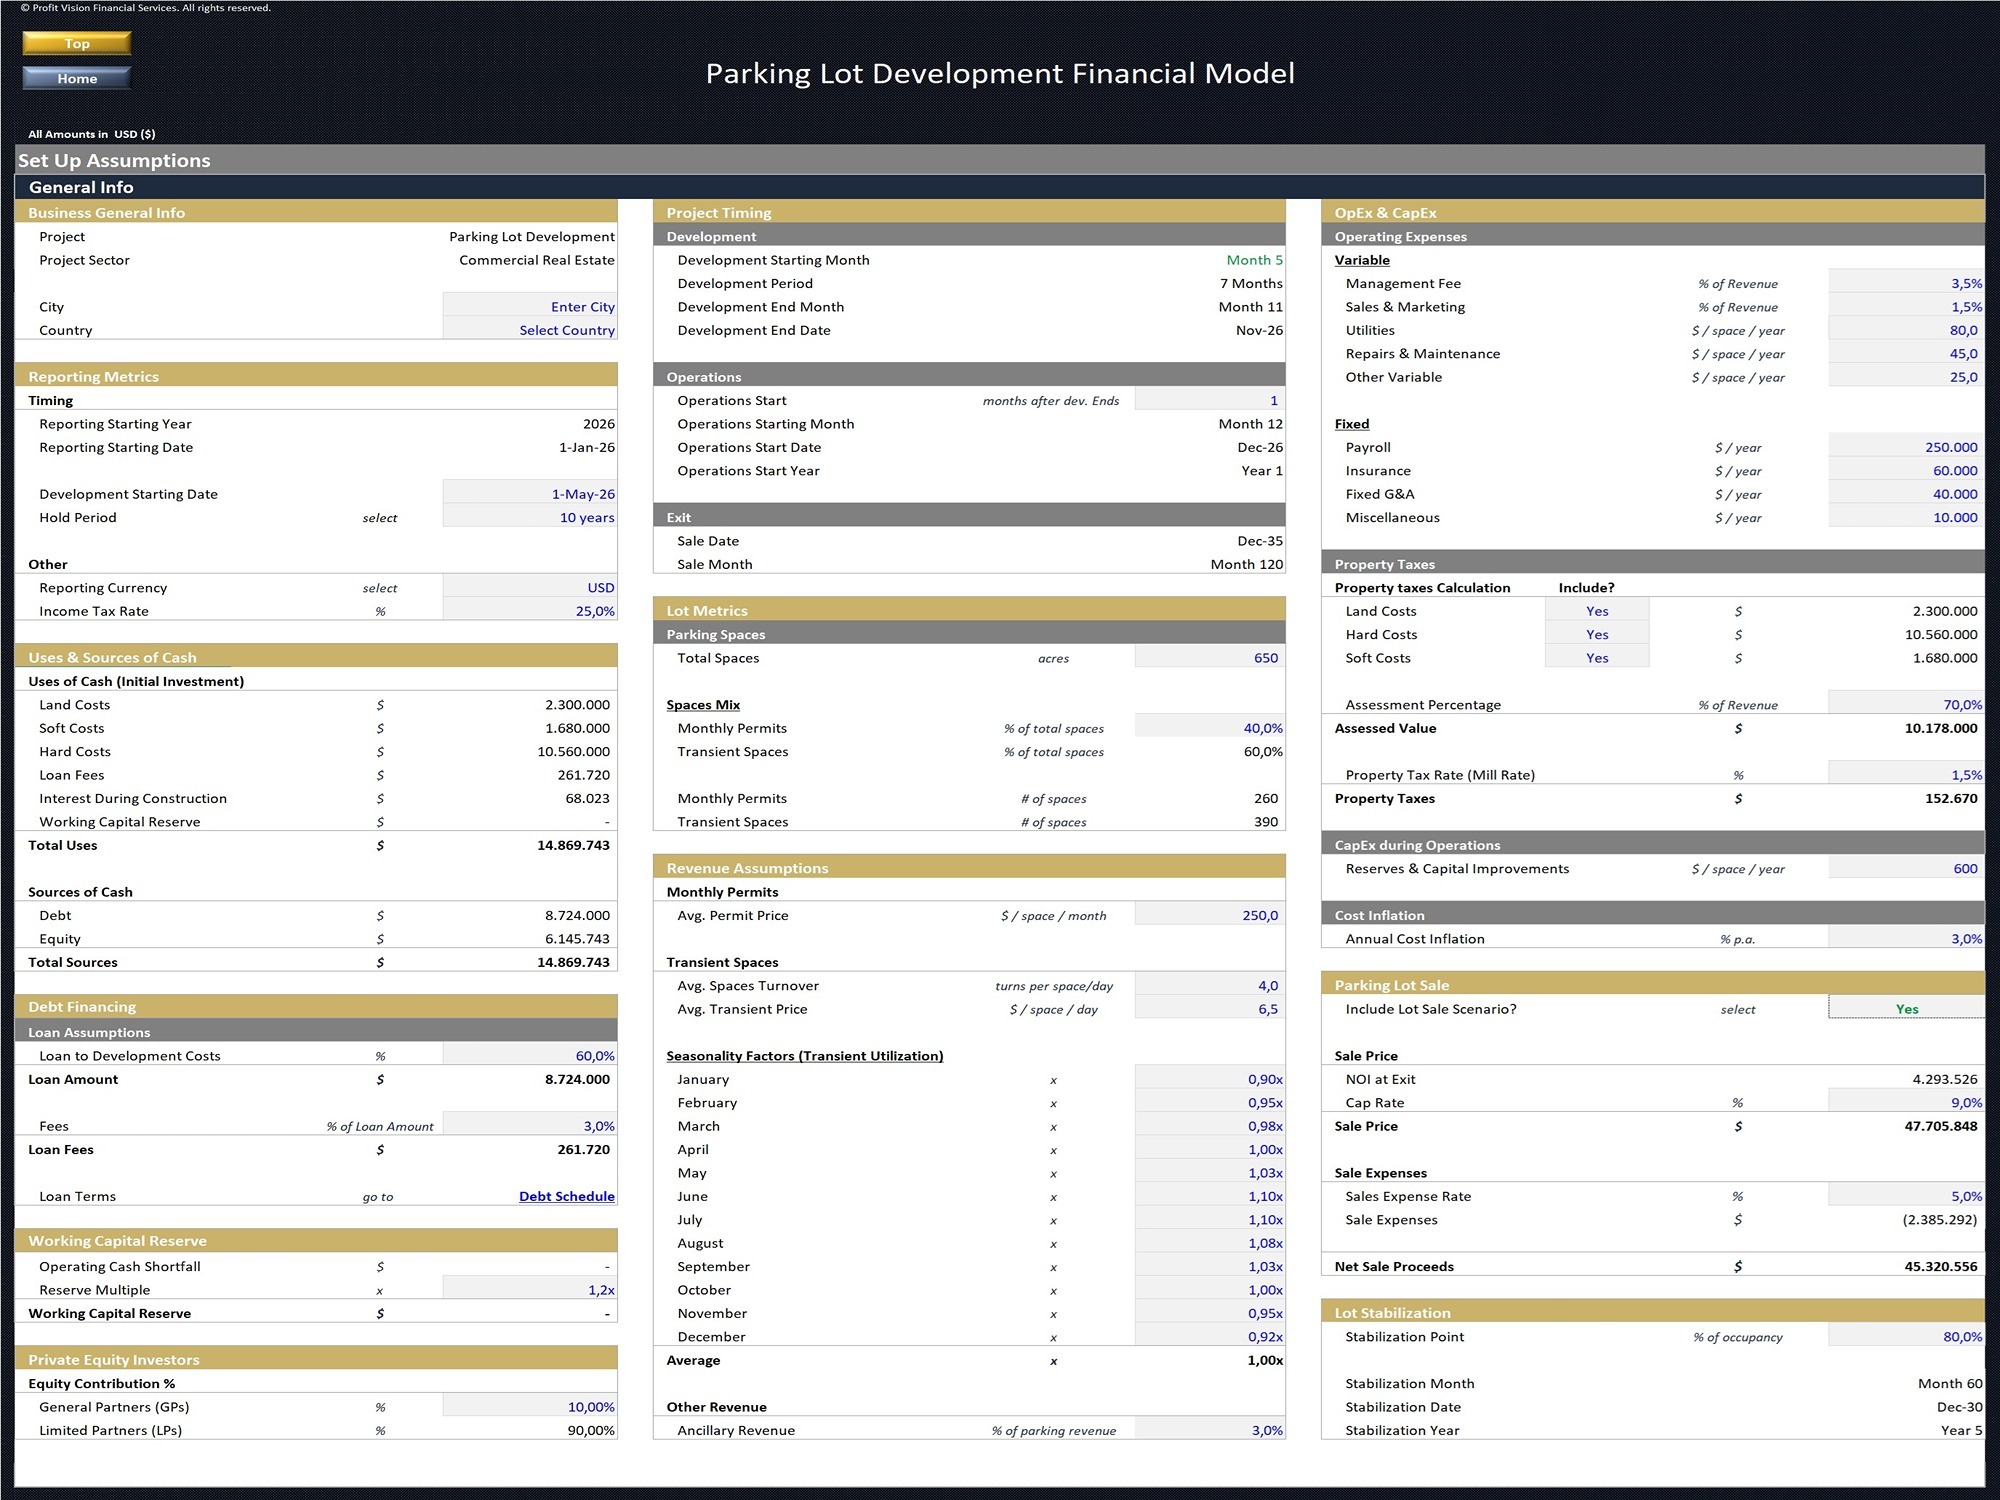
This section is used to input all the assumptions for the project.
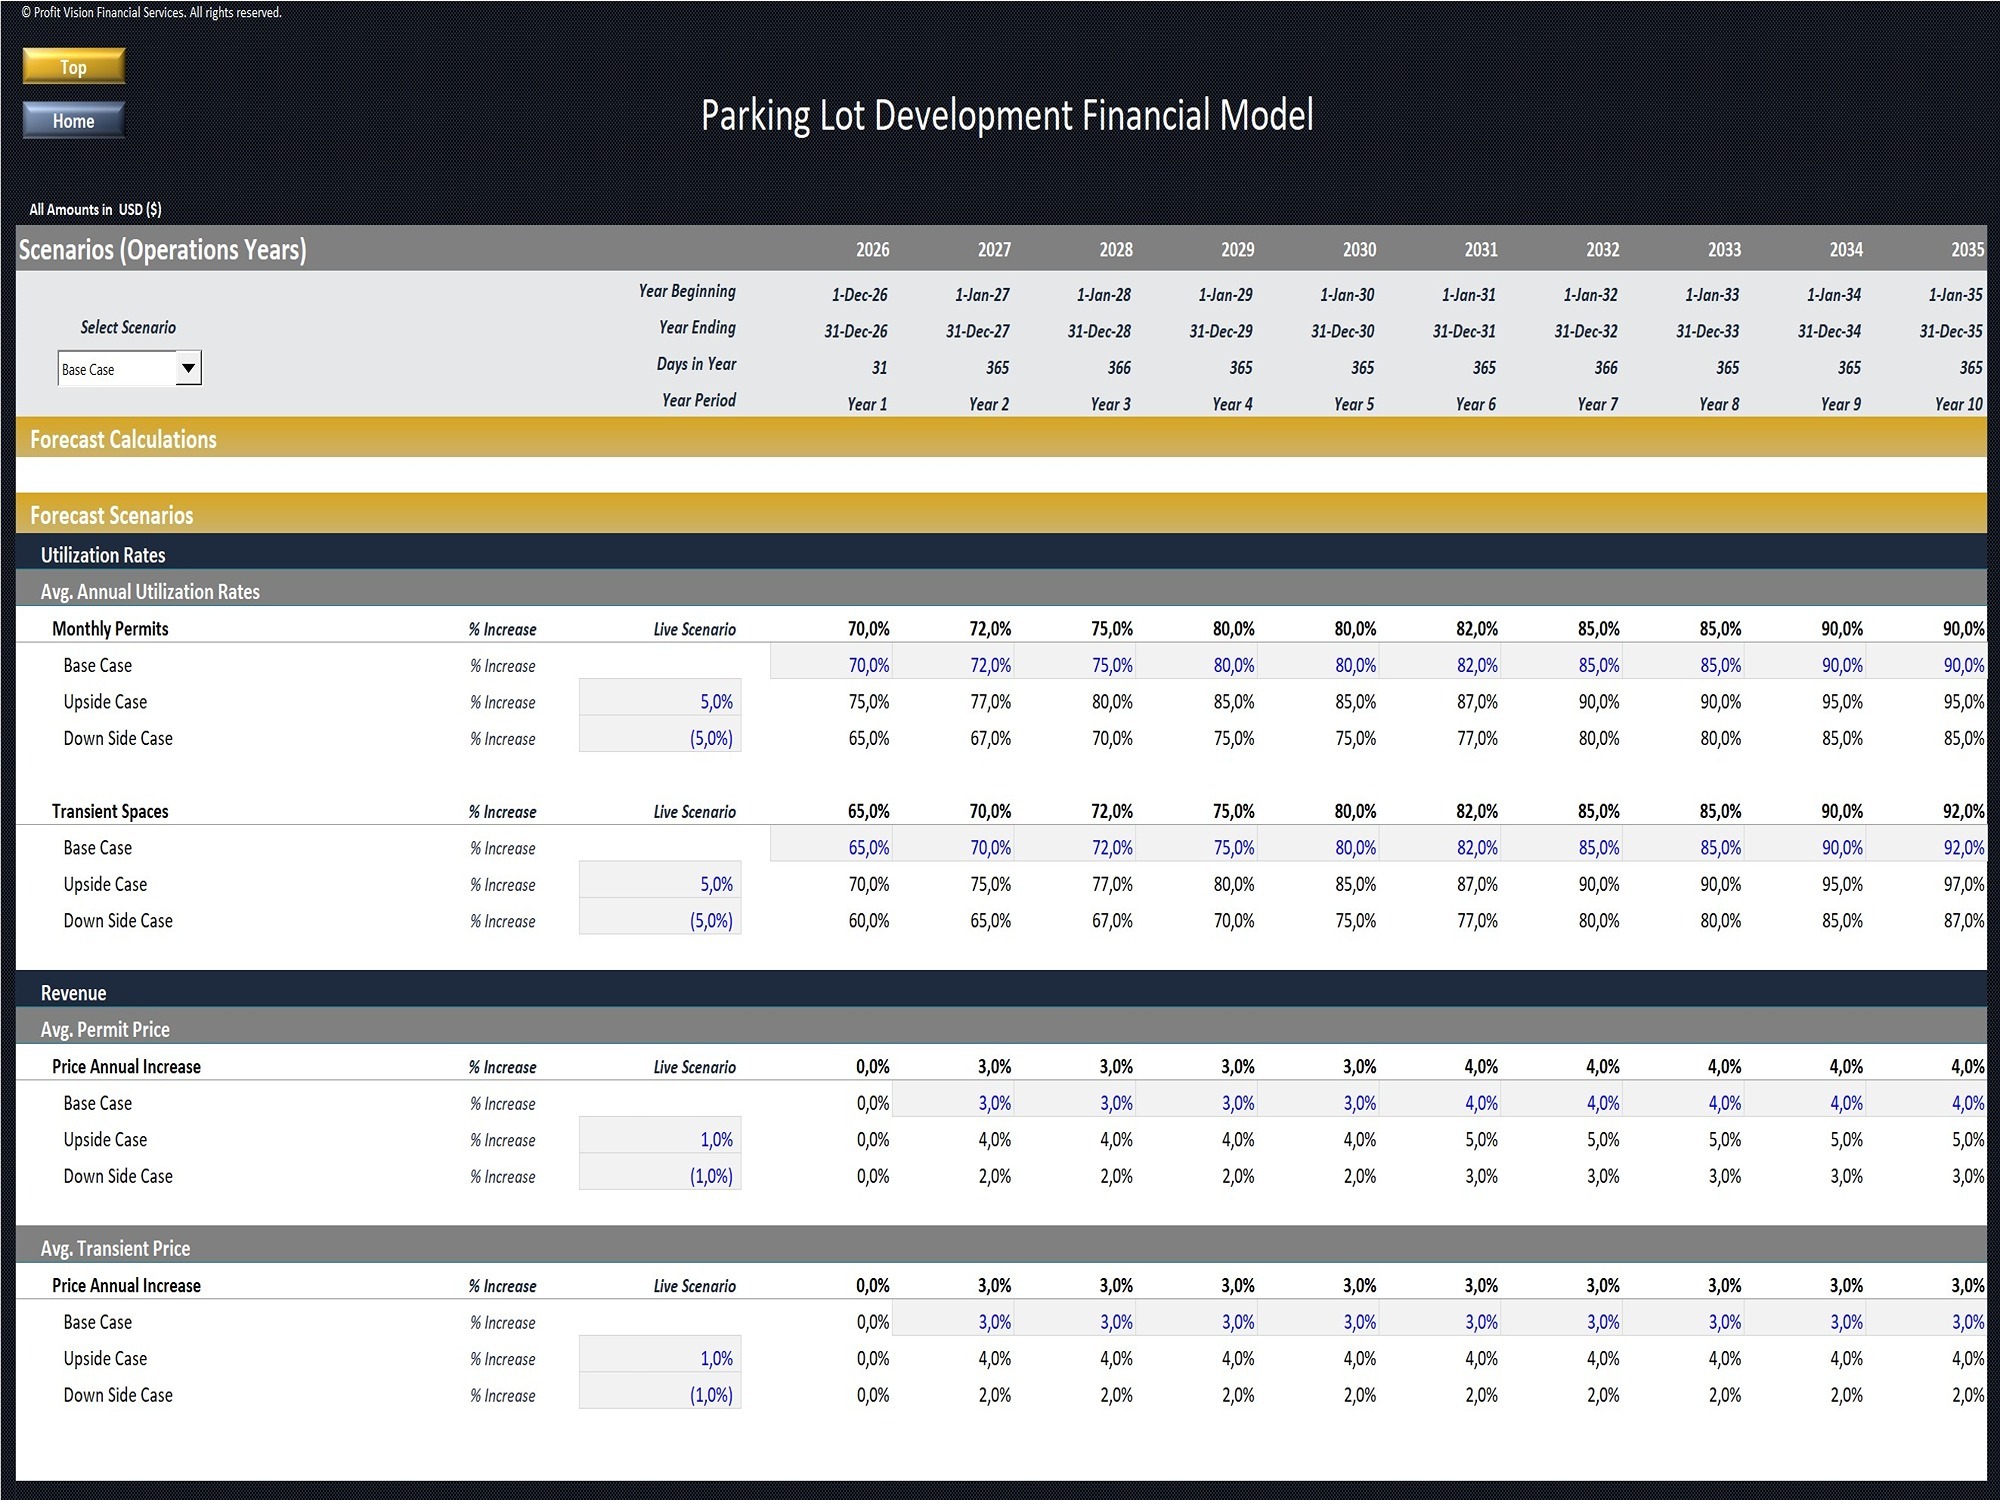
It includes assumptions for Project Timing, Total Parking Spaces, Revenue Assumptions (Monthly Permits, Transient Spaces, Ancillary revenue), Operating Expenses, Capital Expenditures, Uses & Sources of Cash, and Project Financing
• Development Budget & Development Chart
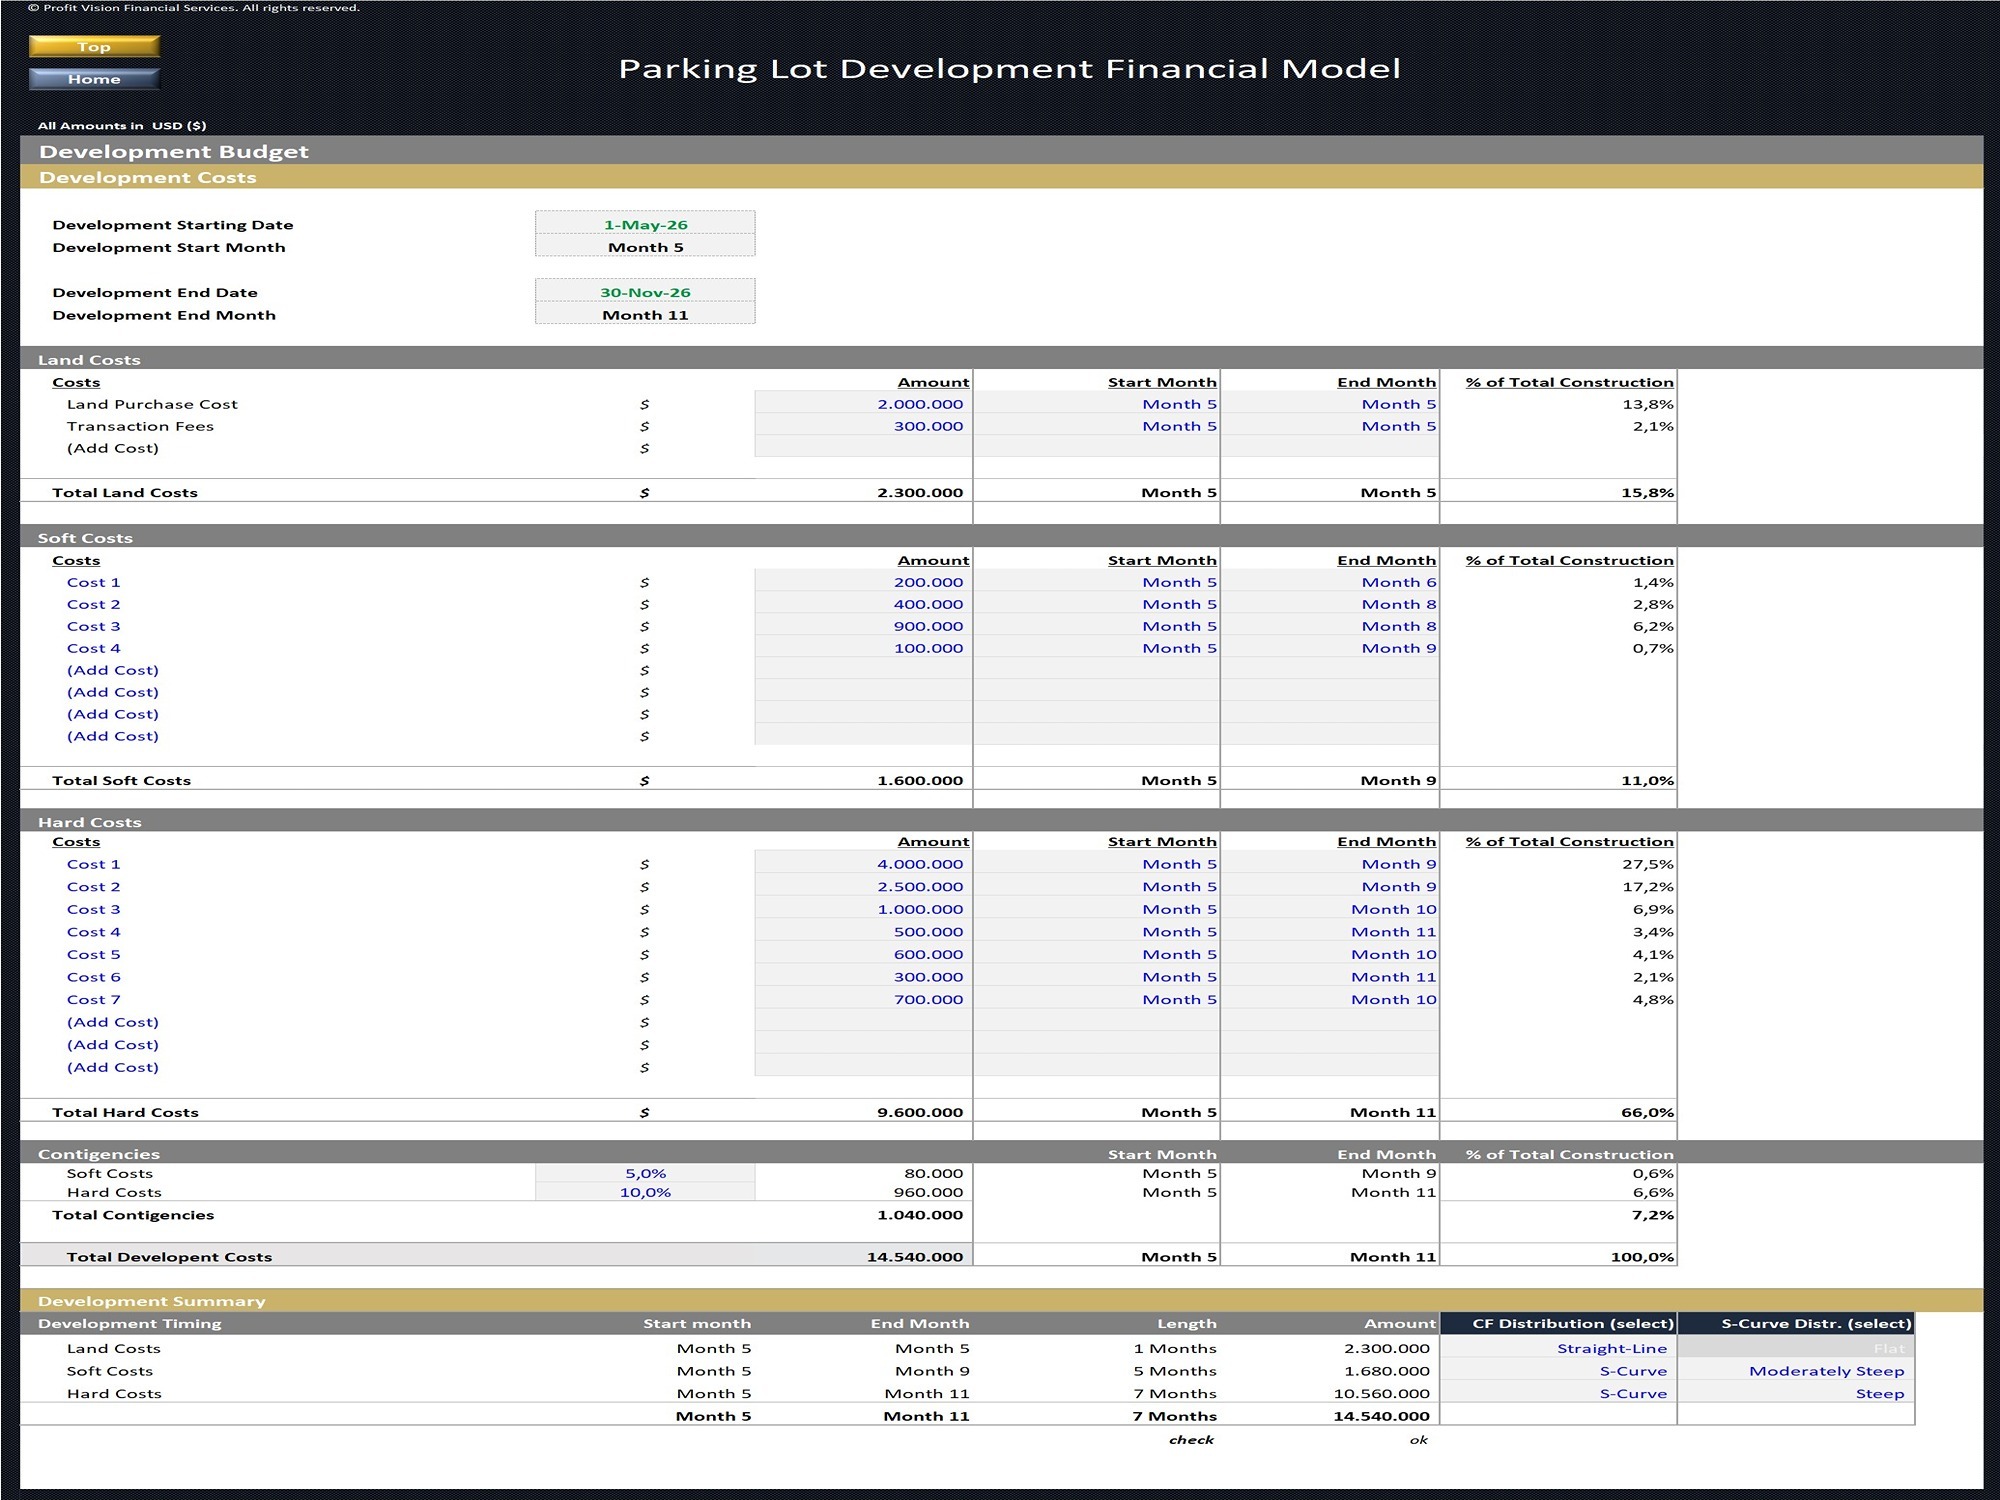
This section includes all assumptions for the property development.
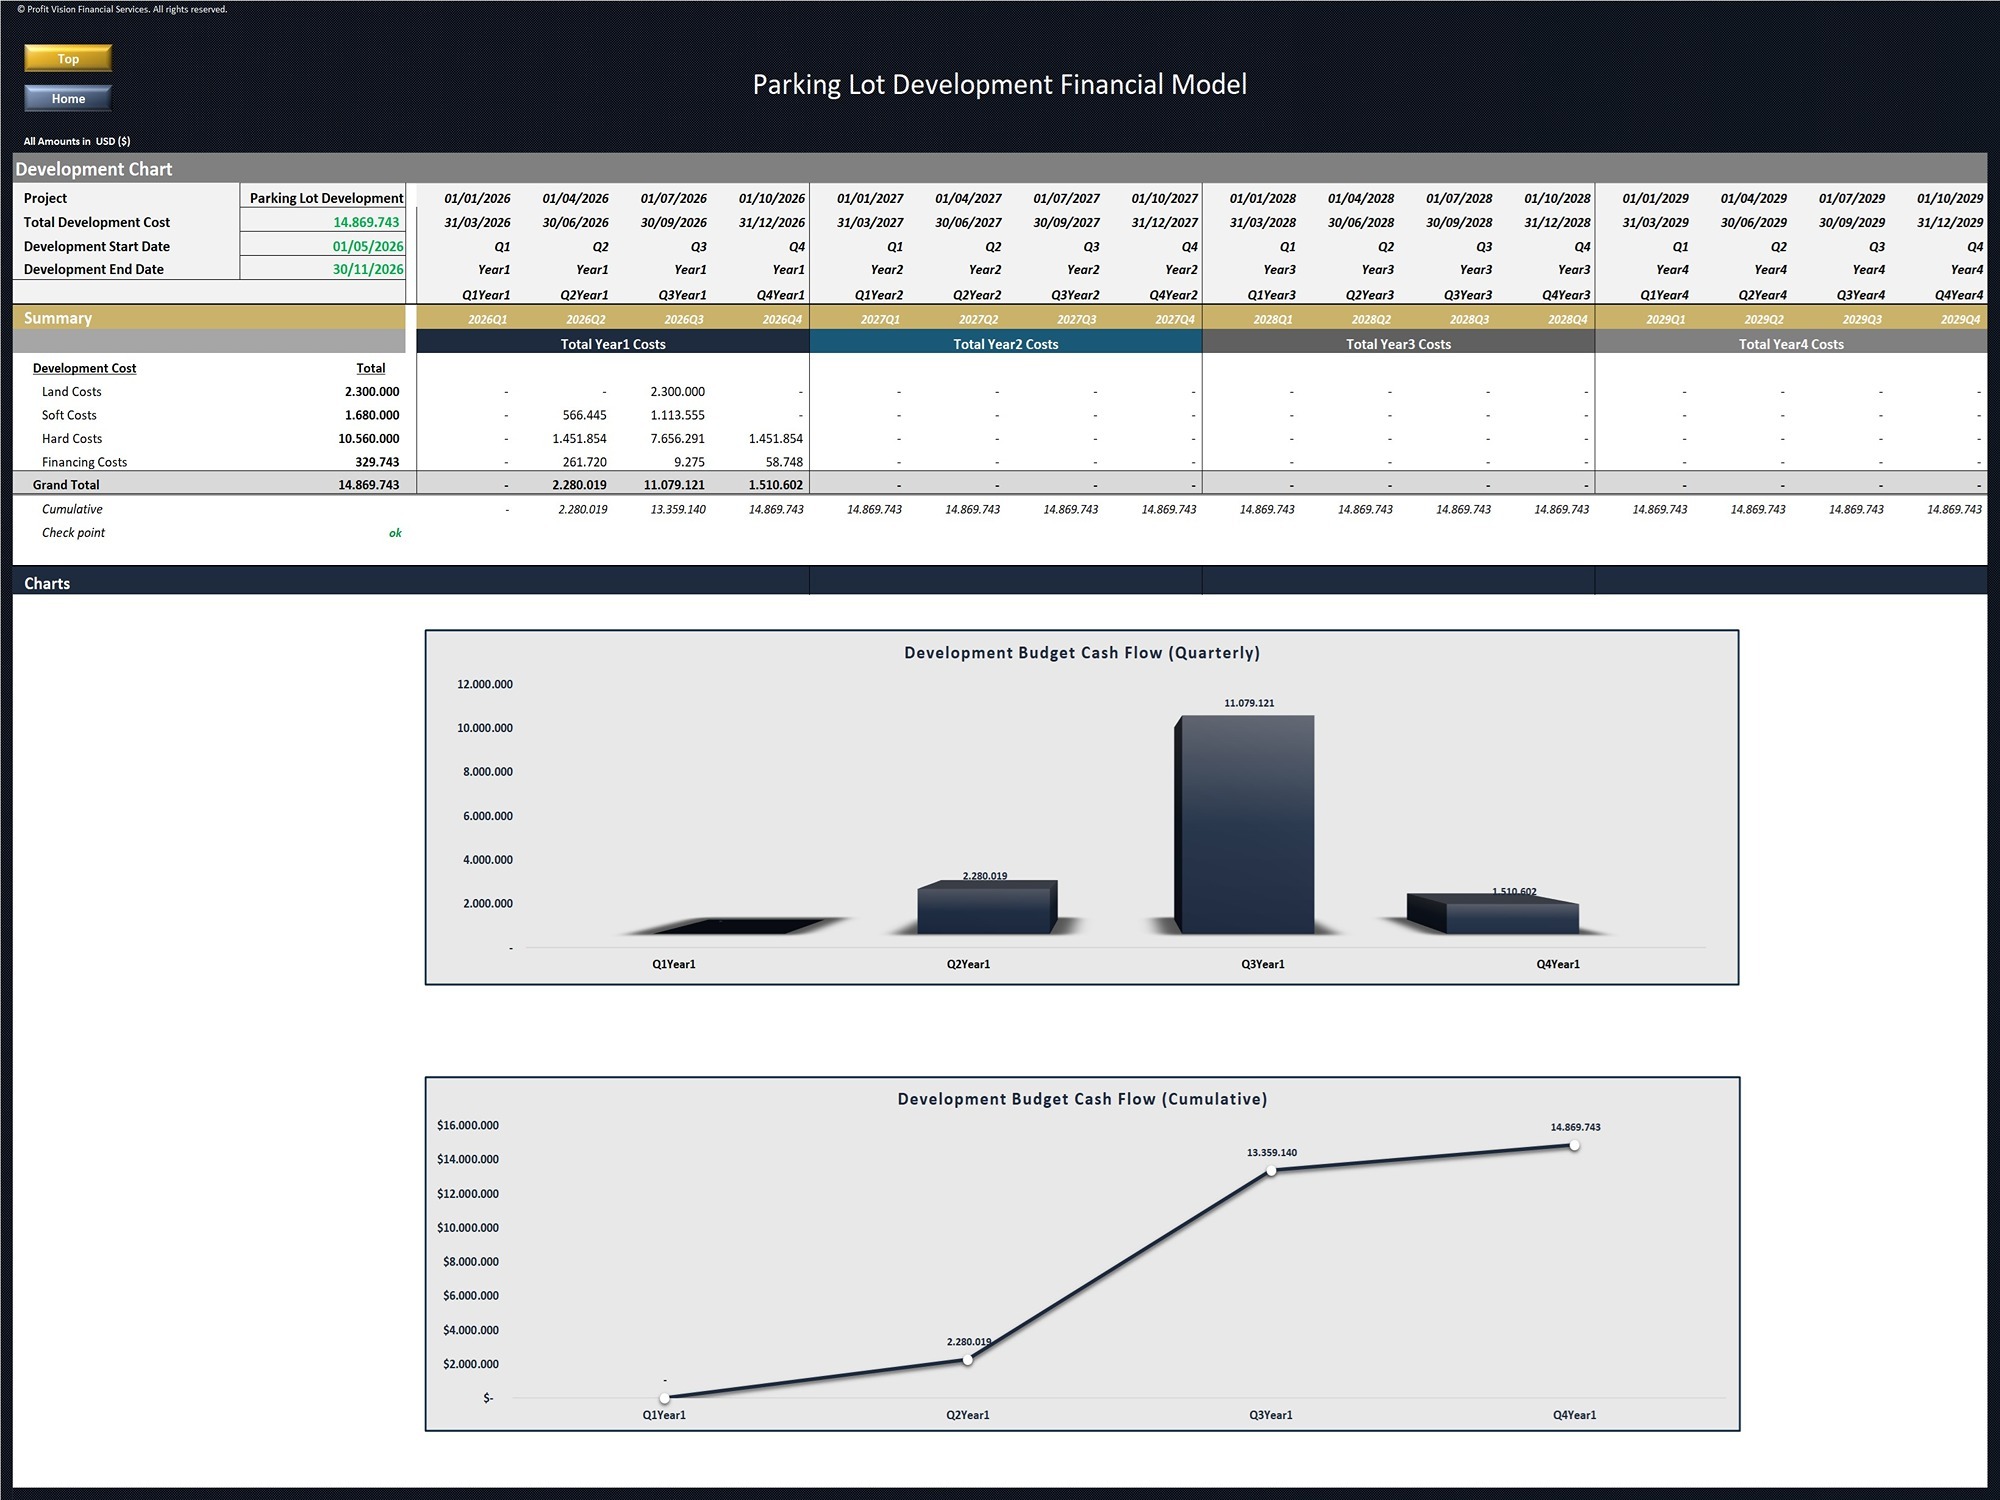
It includes Land Costs, Hard Costs , Soft Costs, Development Contigencies and Development timing. A dynamic chart presents the development cash flow.
• Debt Schedule
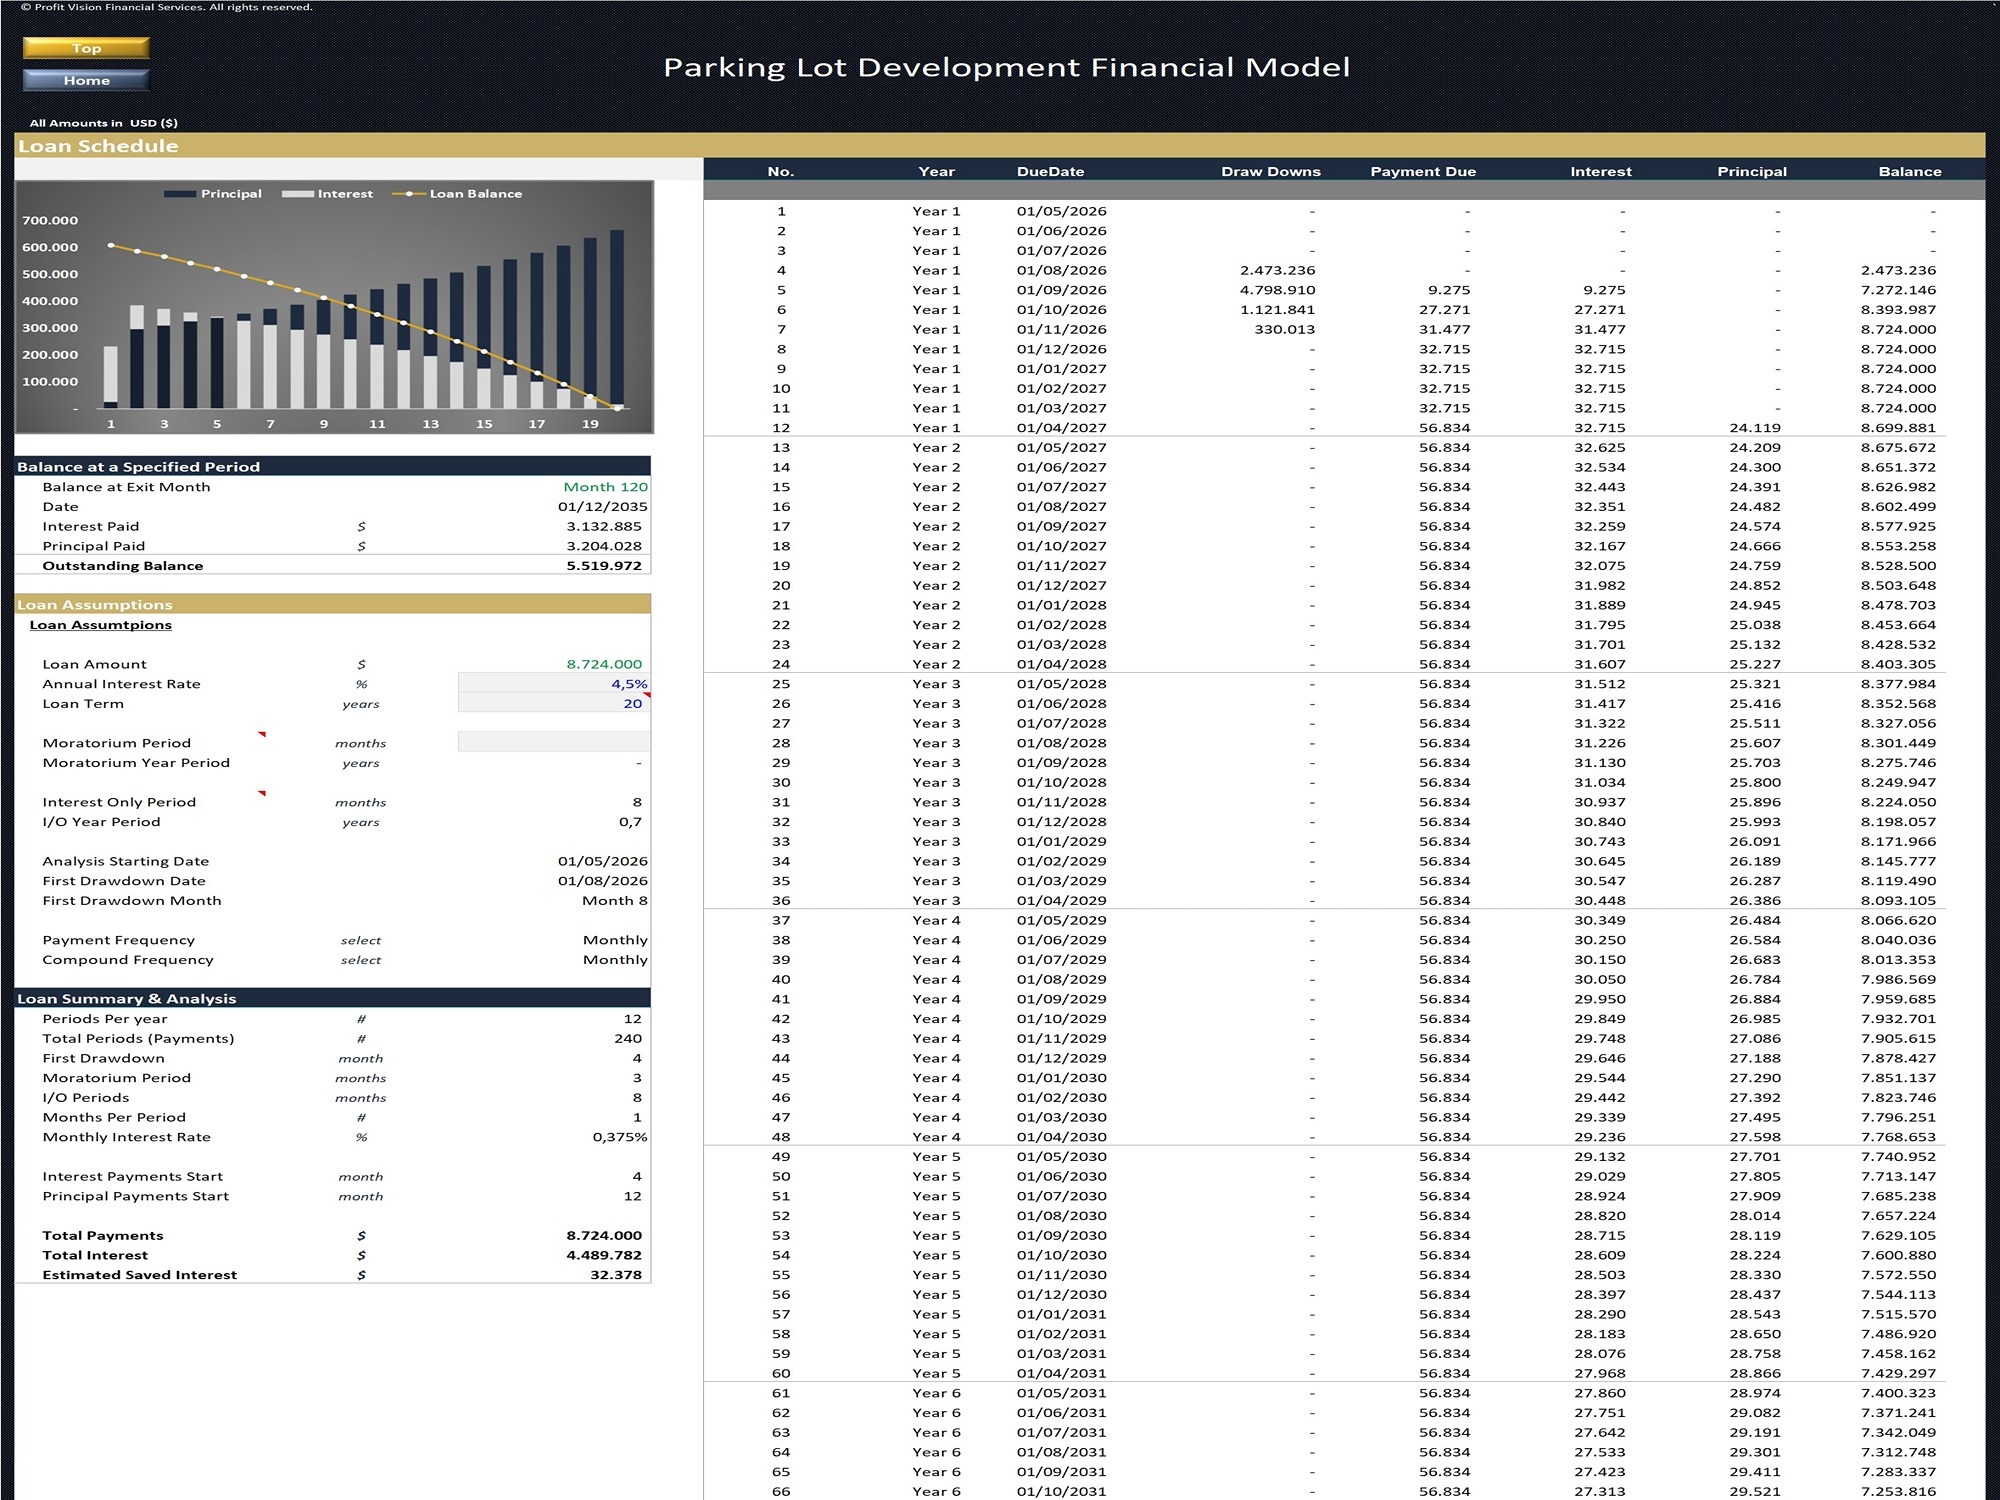
Loan amortization Schedule ( including an optional moratorium and interest-only (IO) period.
• Project Cash Flows and Return Metrics
Presentation of Project’s Cash Flow and Returns including the below reports:
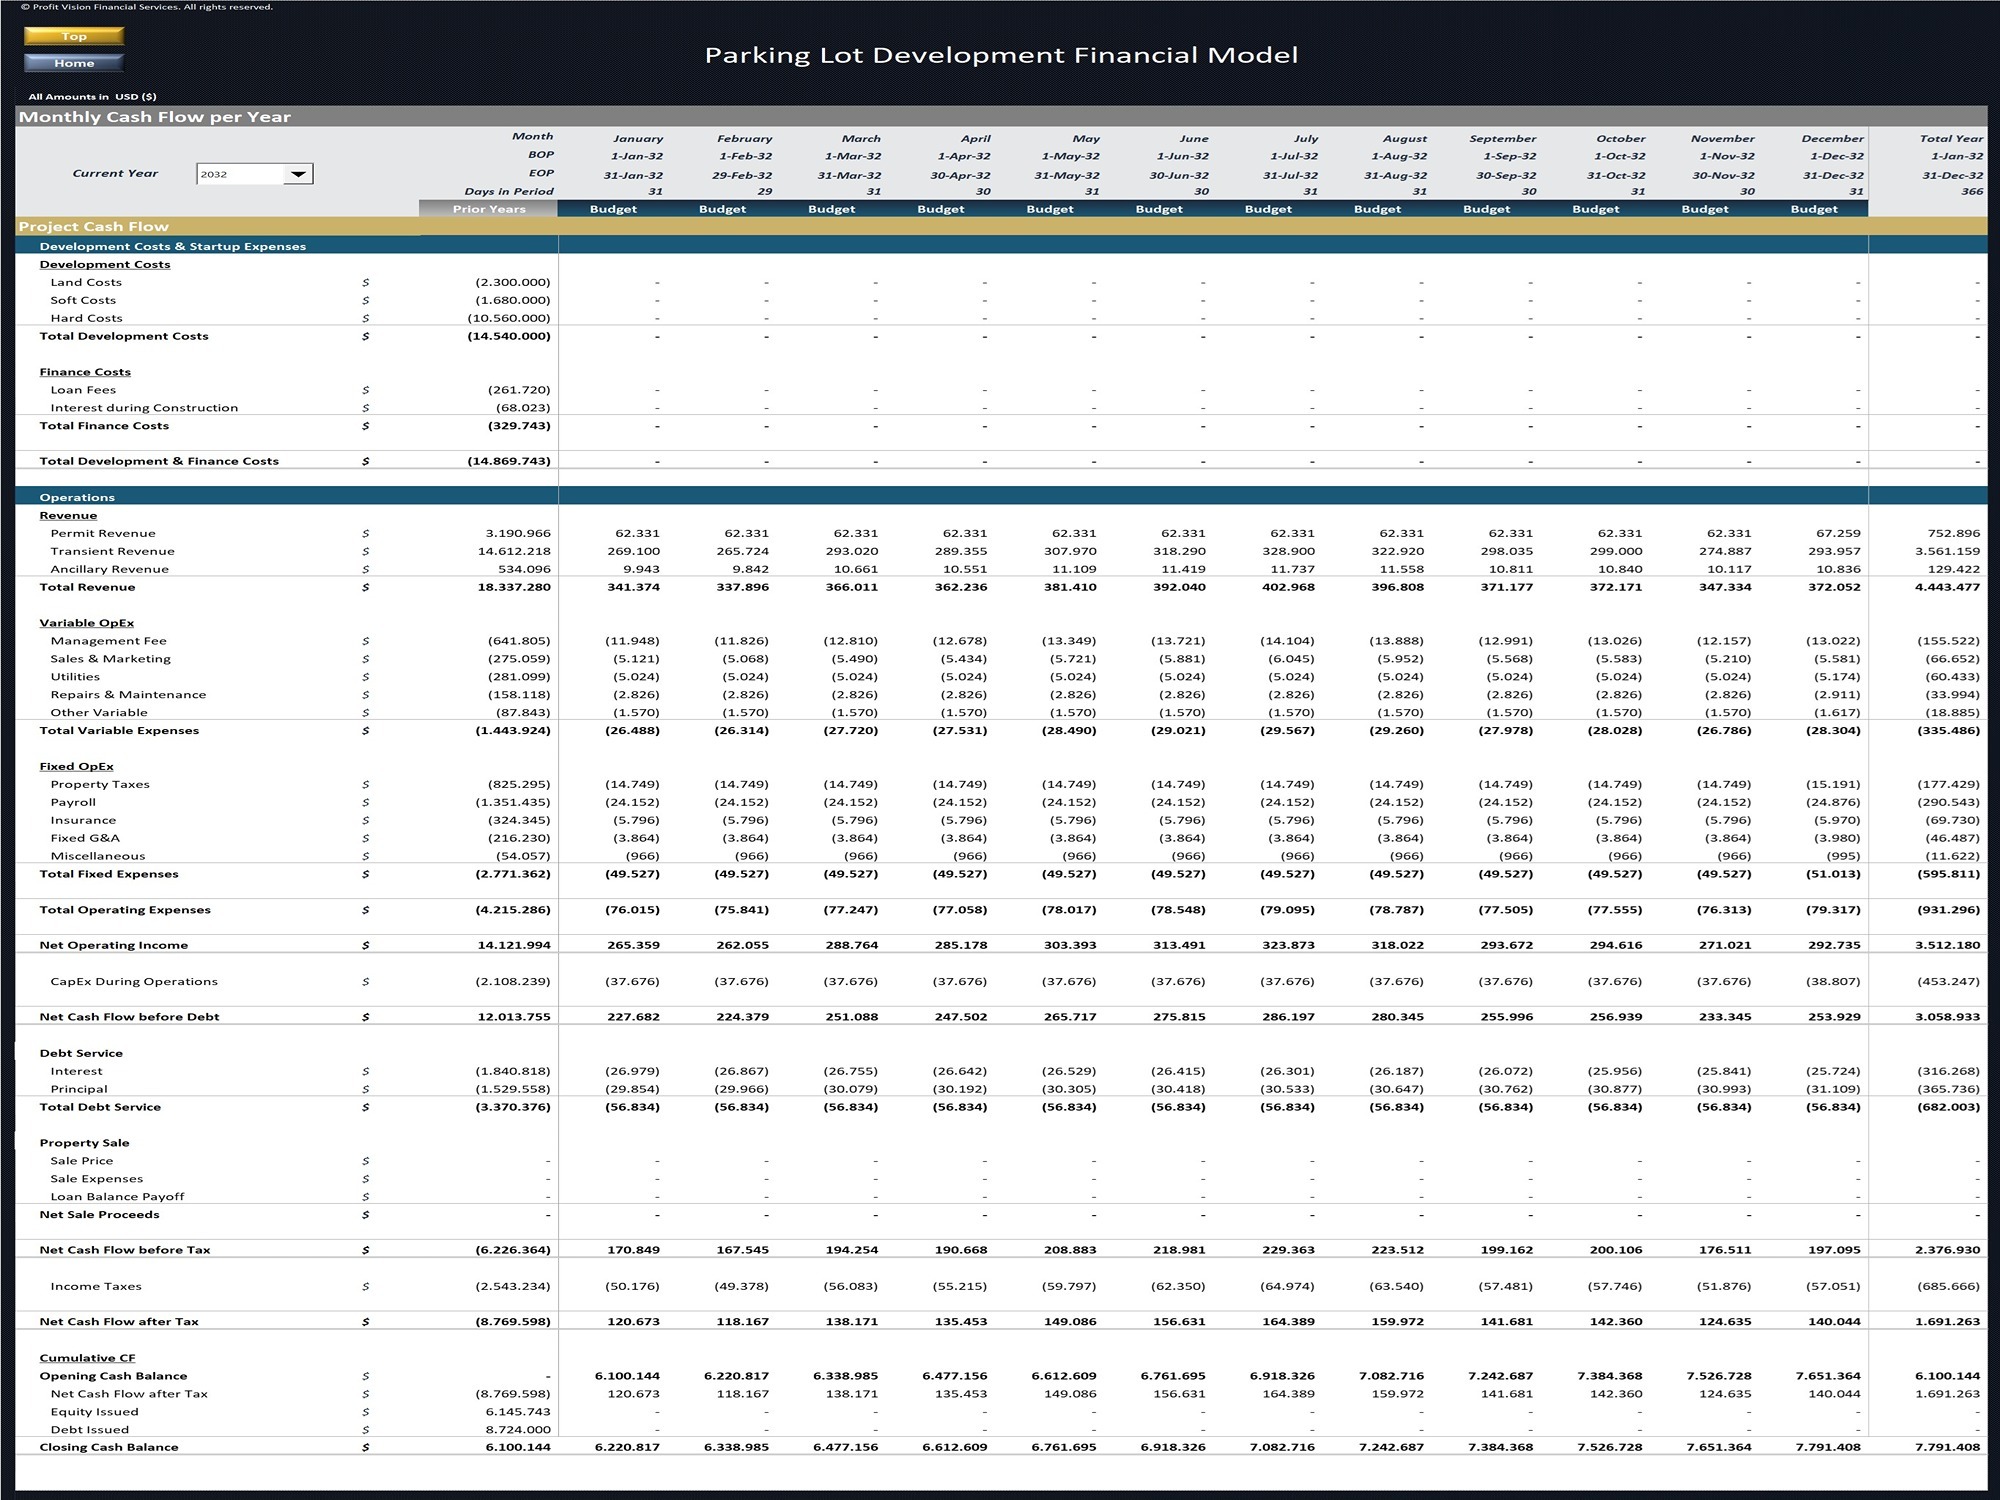
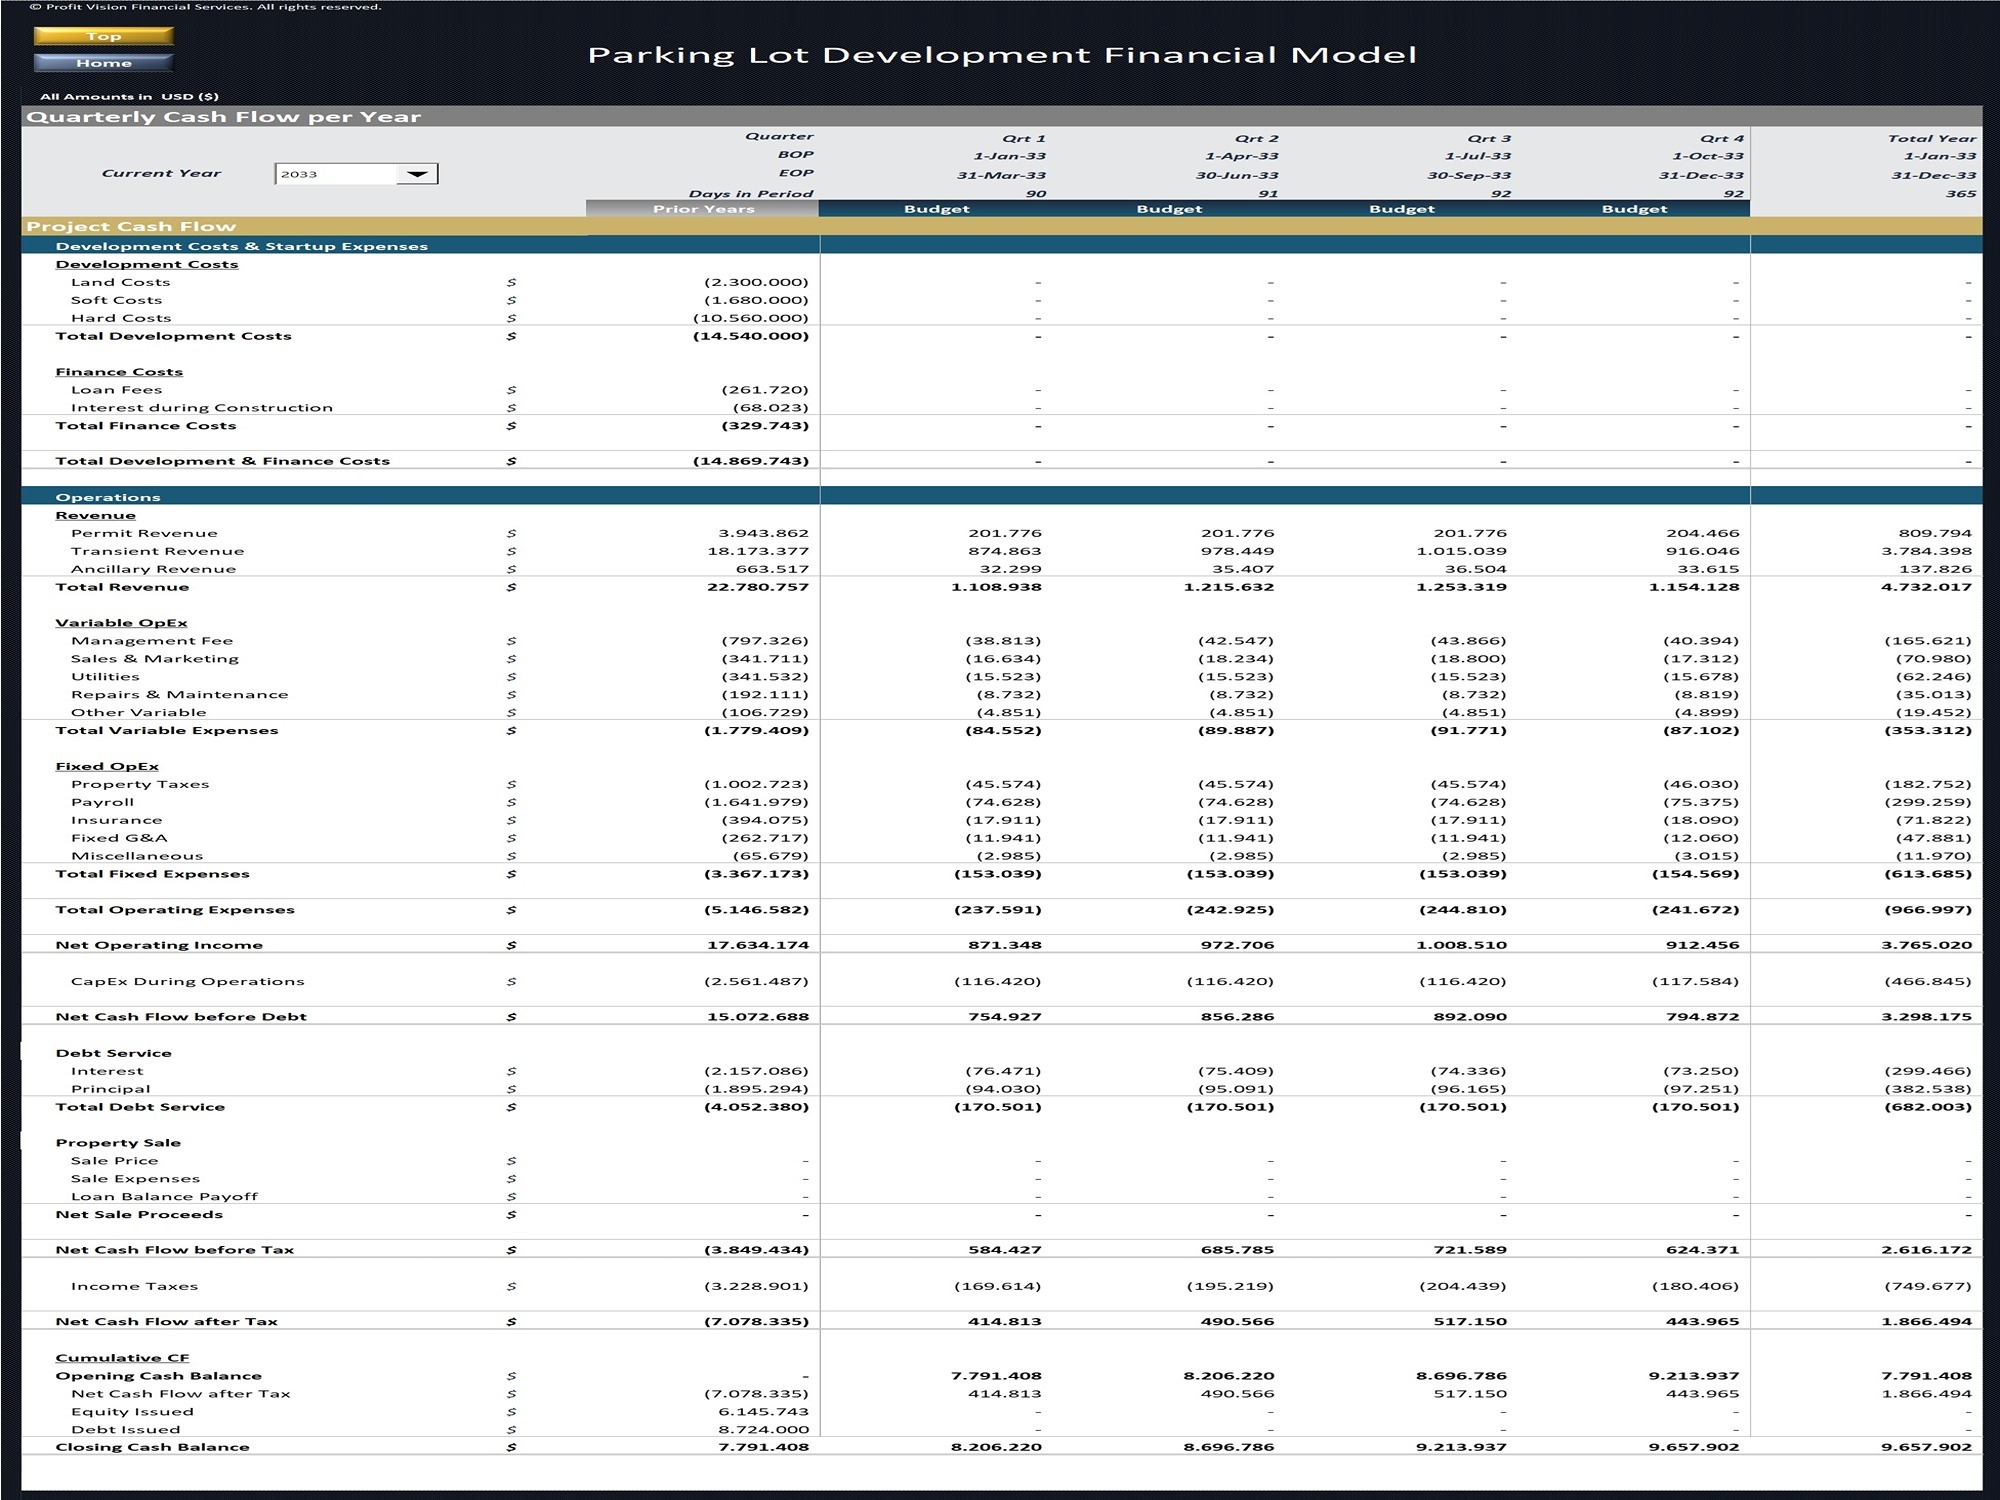
– Monthly and Quarterly Project Cash Flow per Year
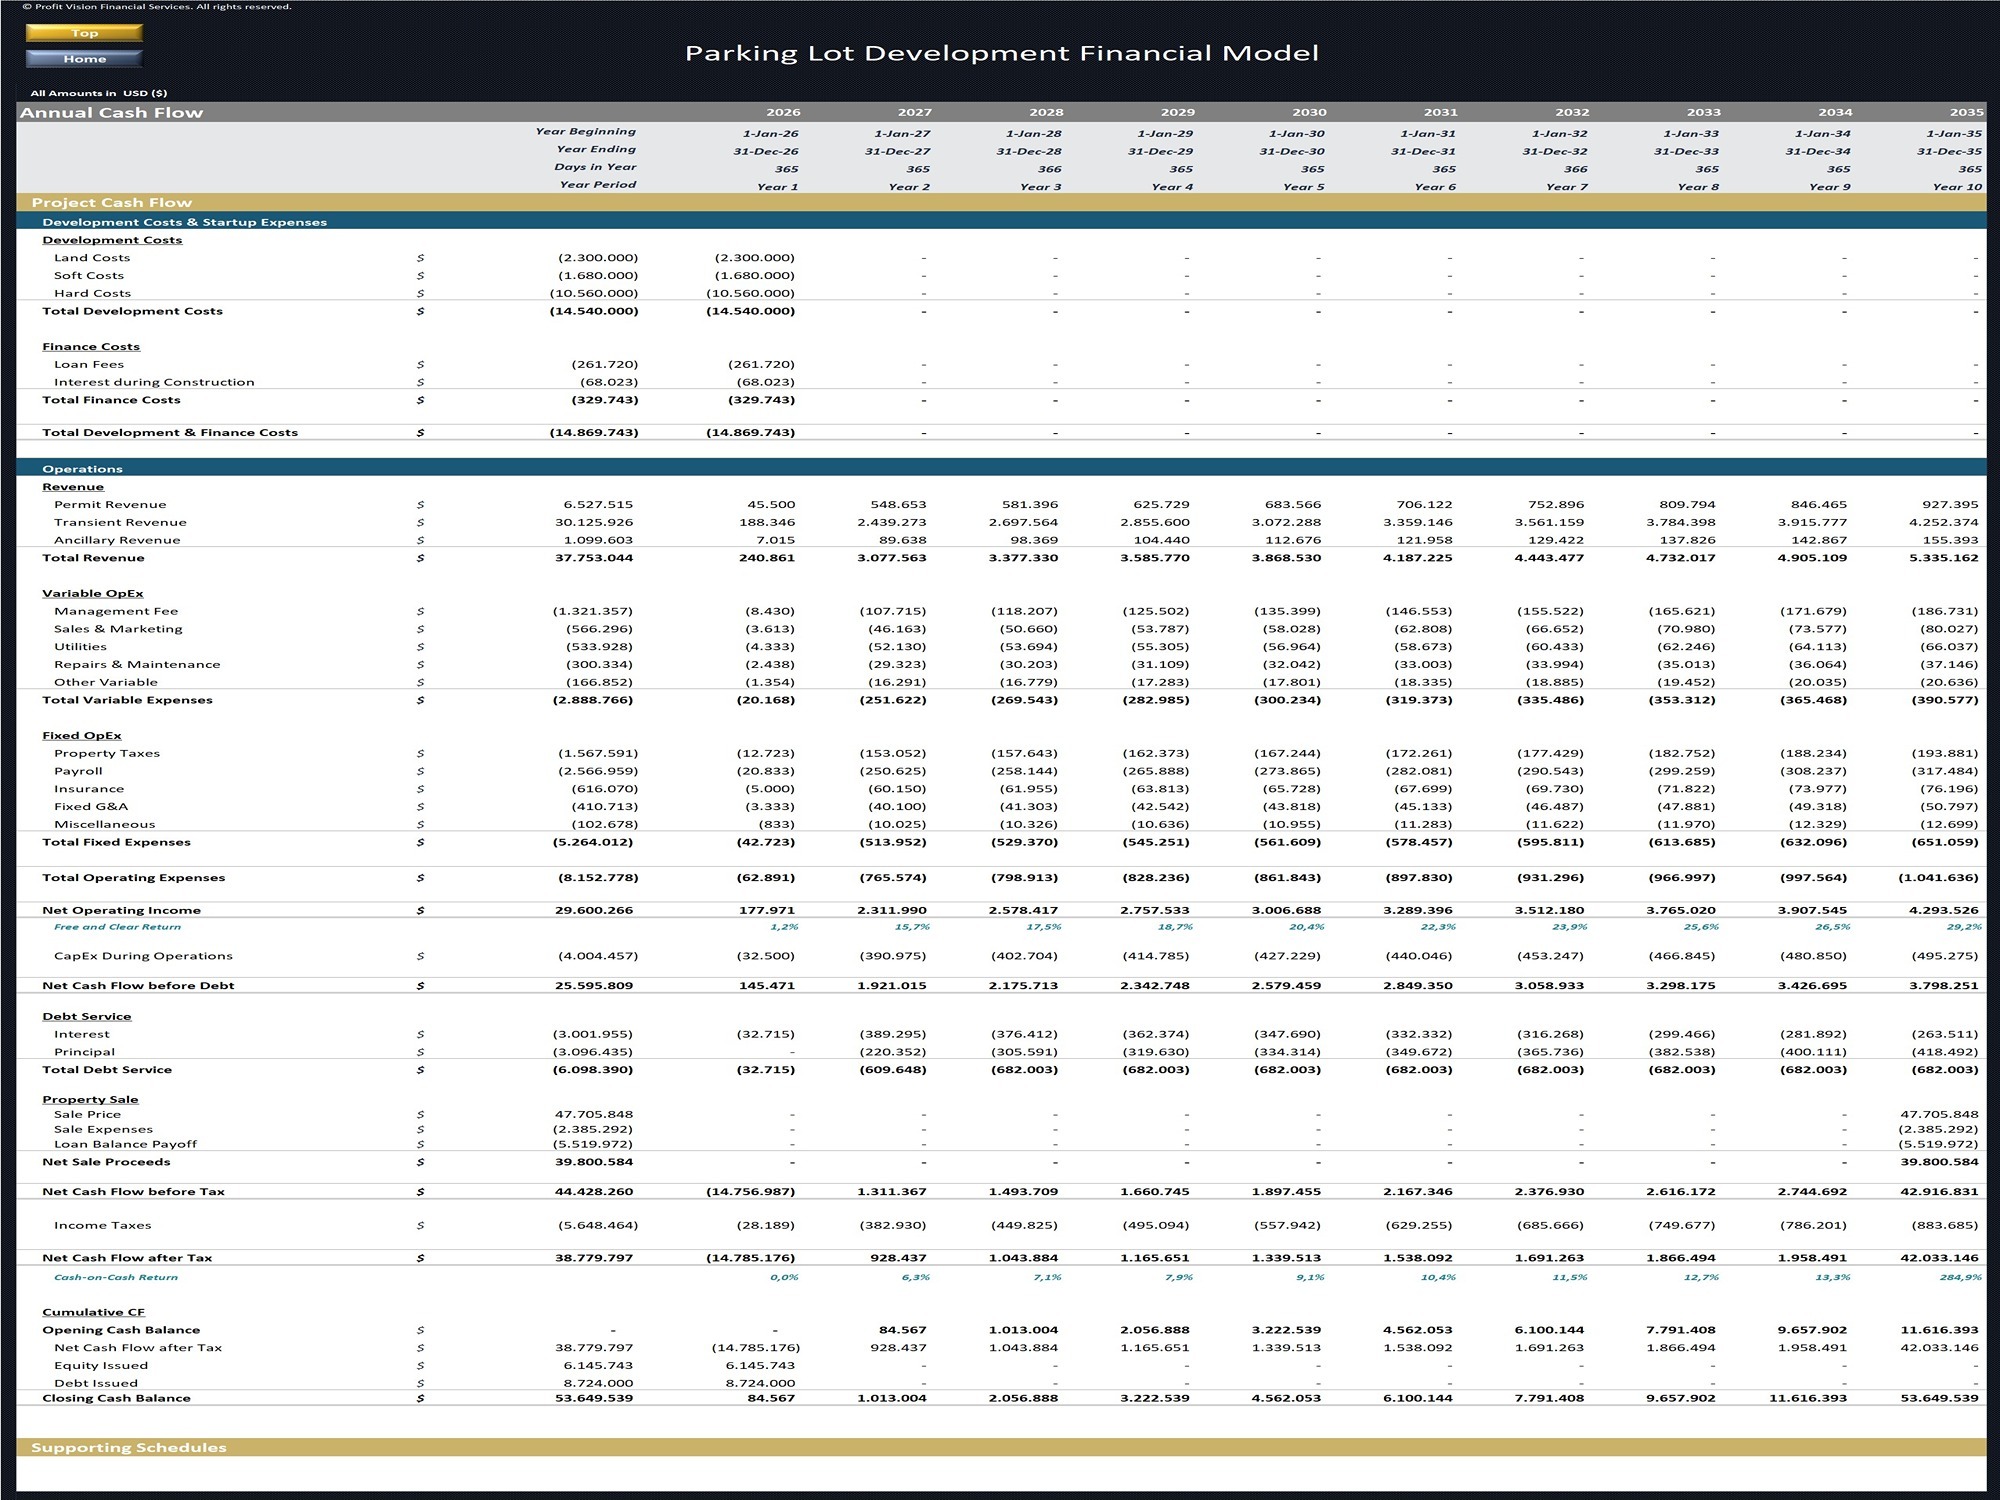
– Annual Project Cash Flow
– Financing and Tax Supporting Schedules
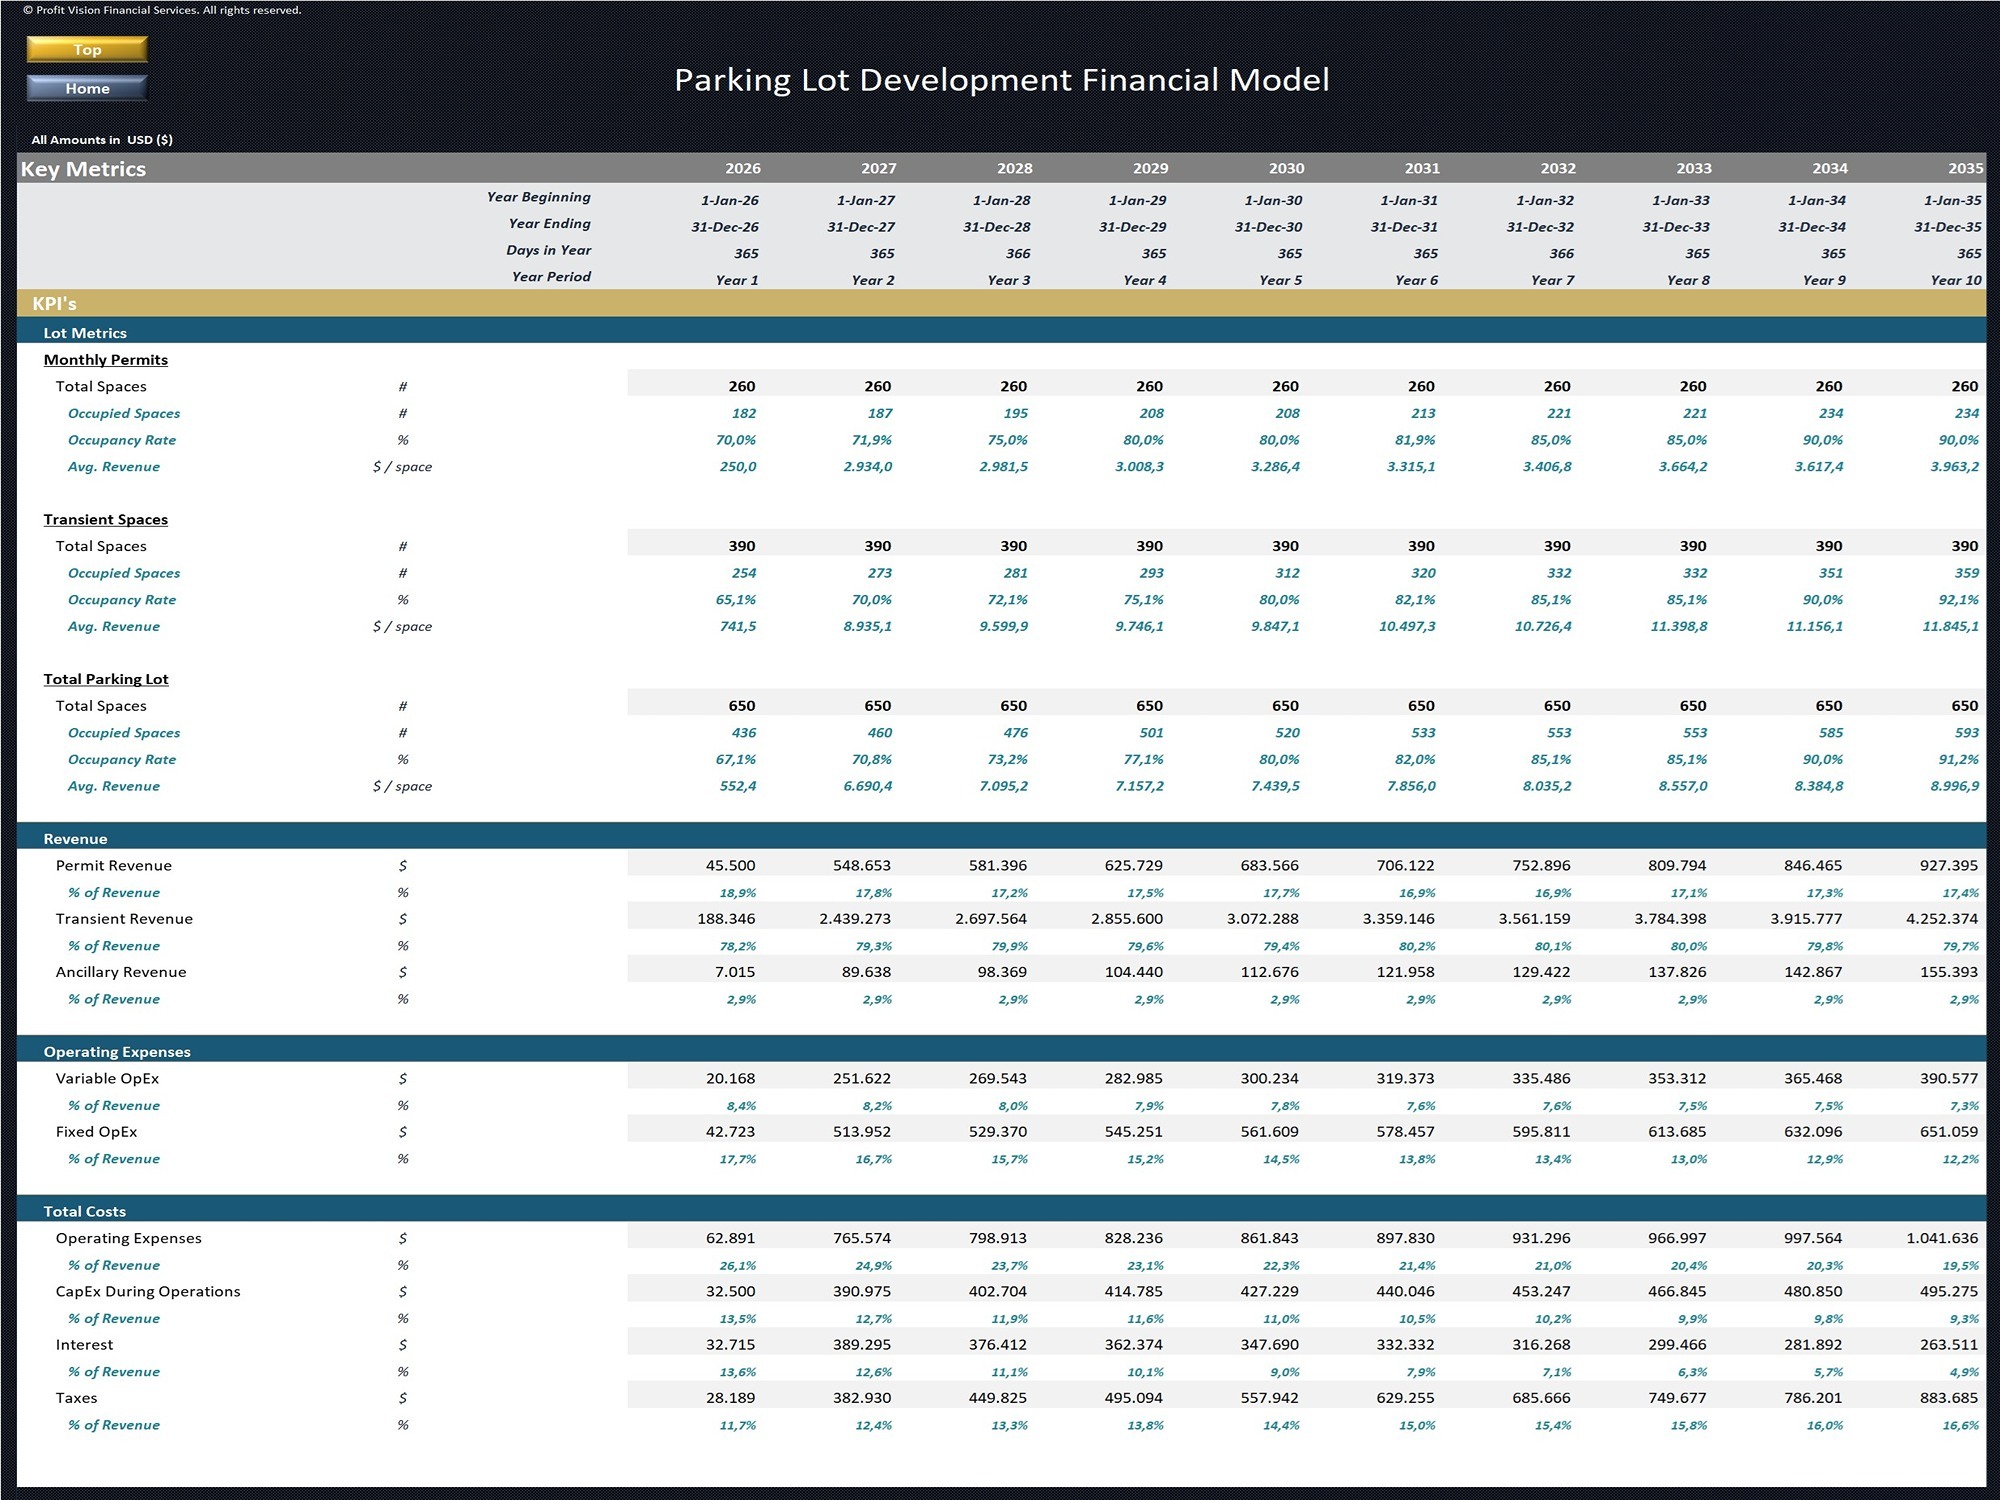
– Key Performance Indicators
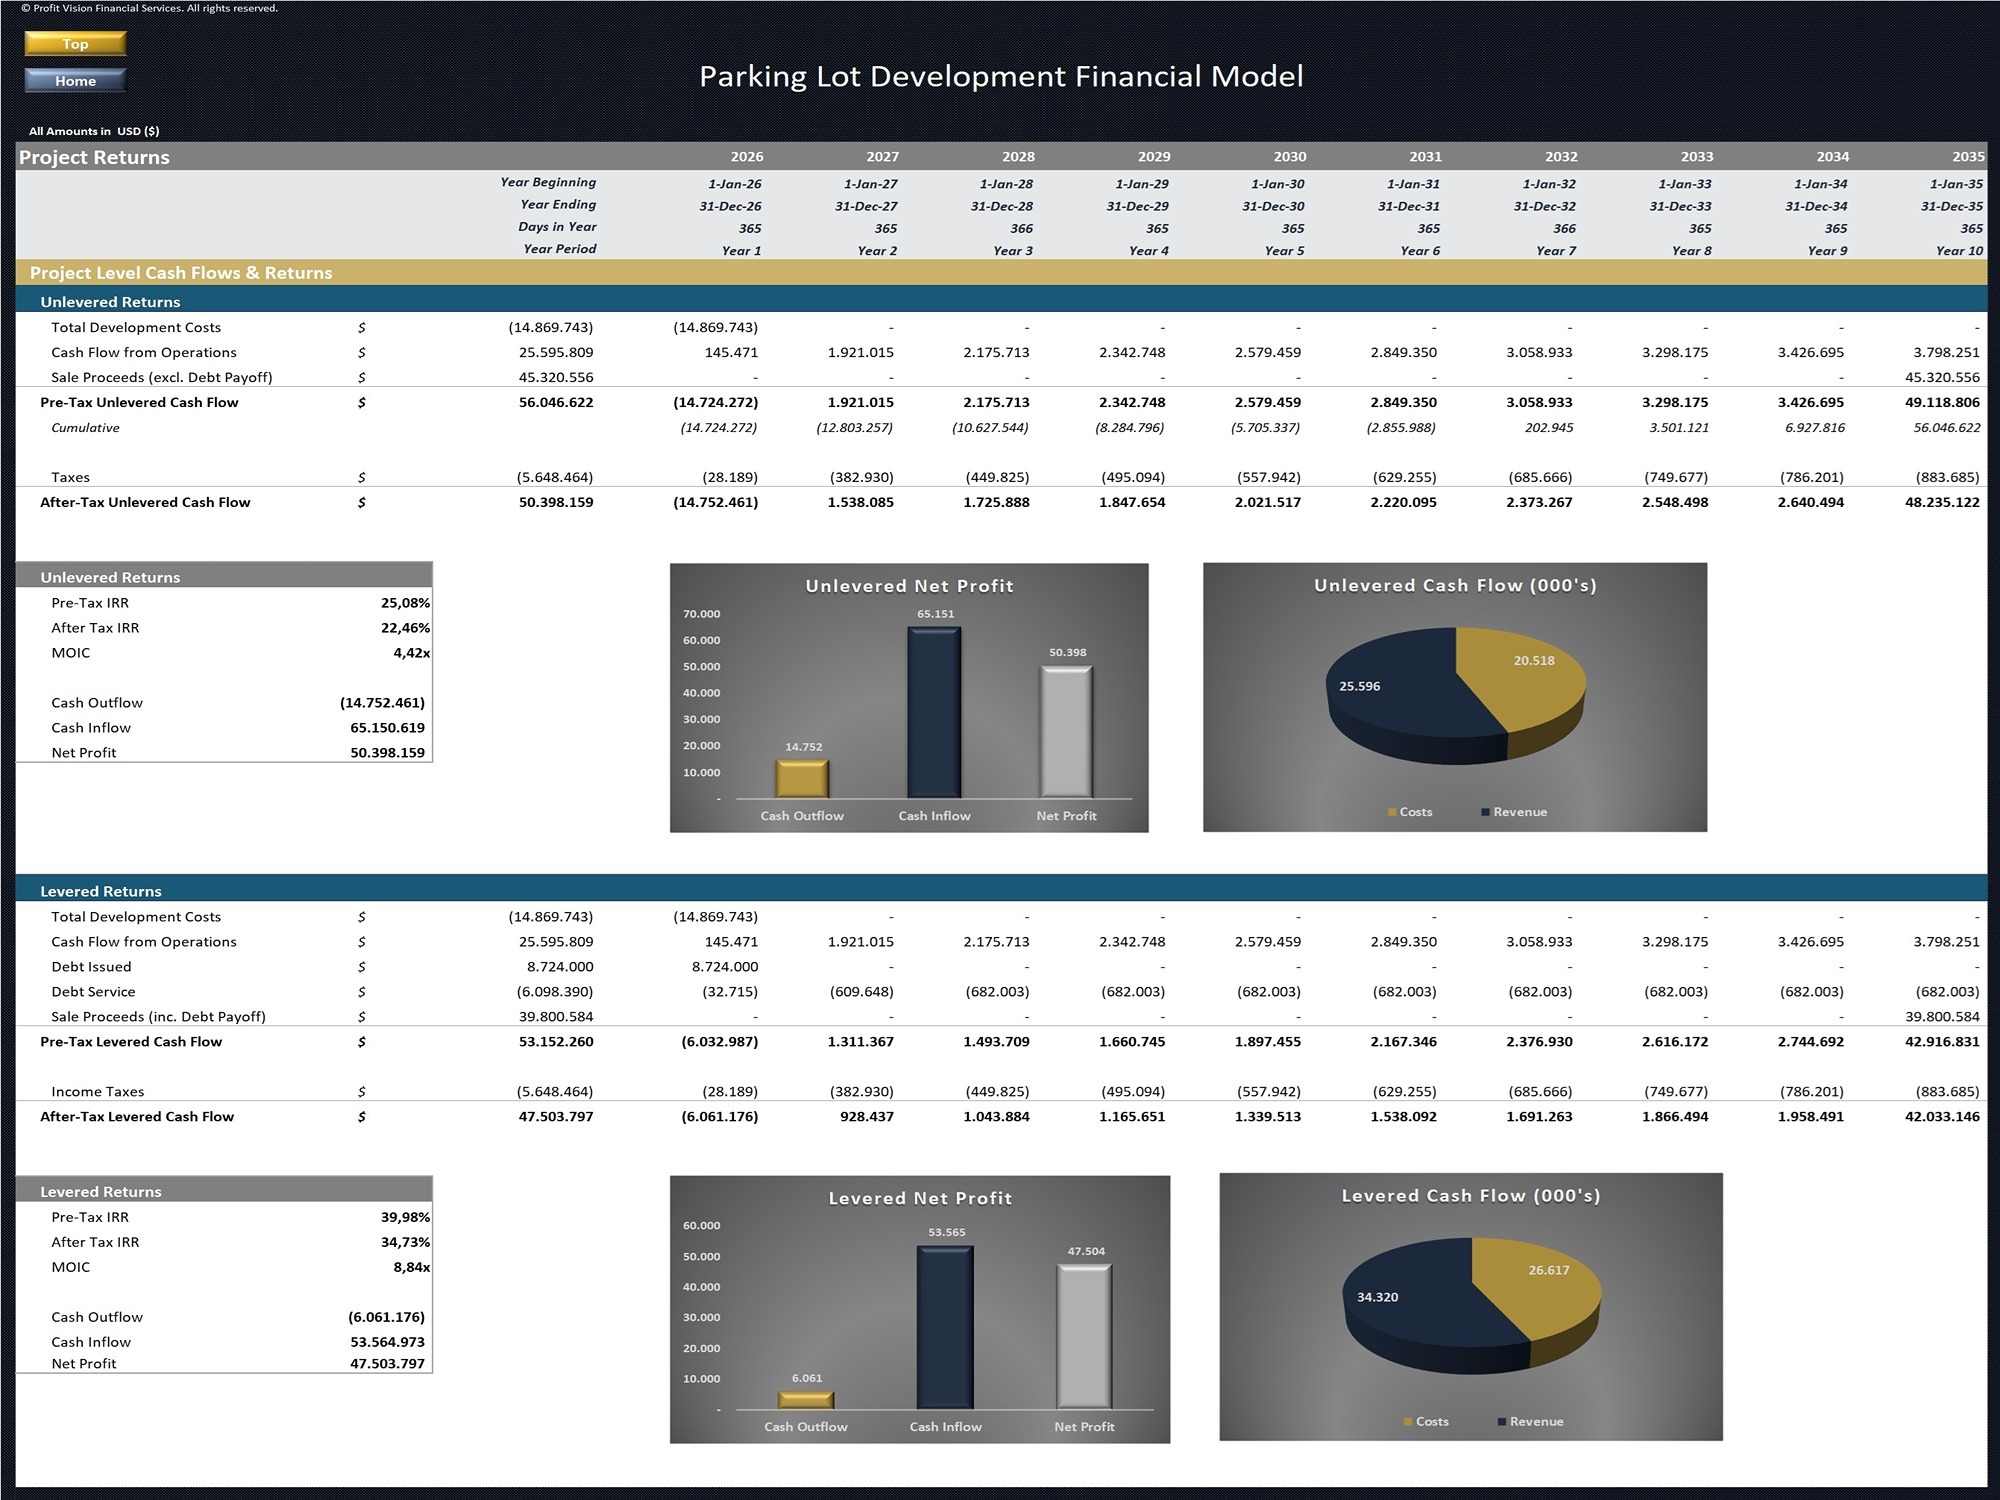
– Unlevered & Levered Project Return Metrics (IRR, MOIC, Payback, NPV)
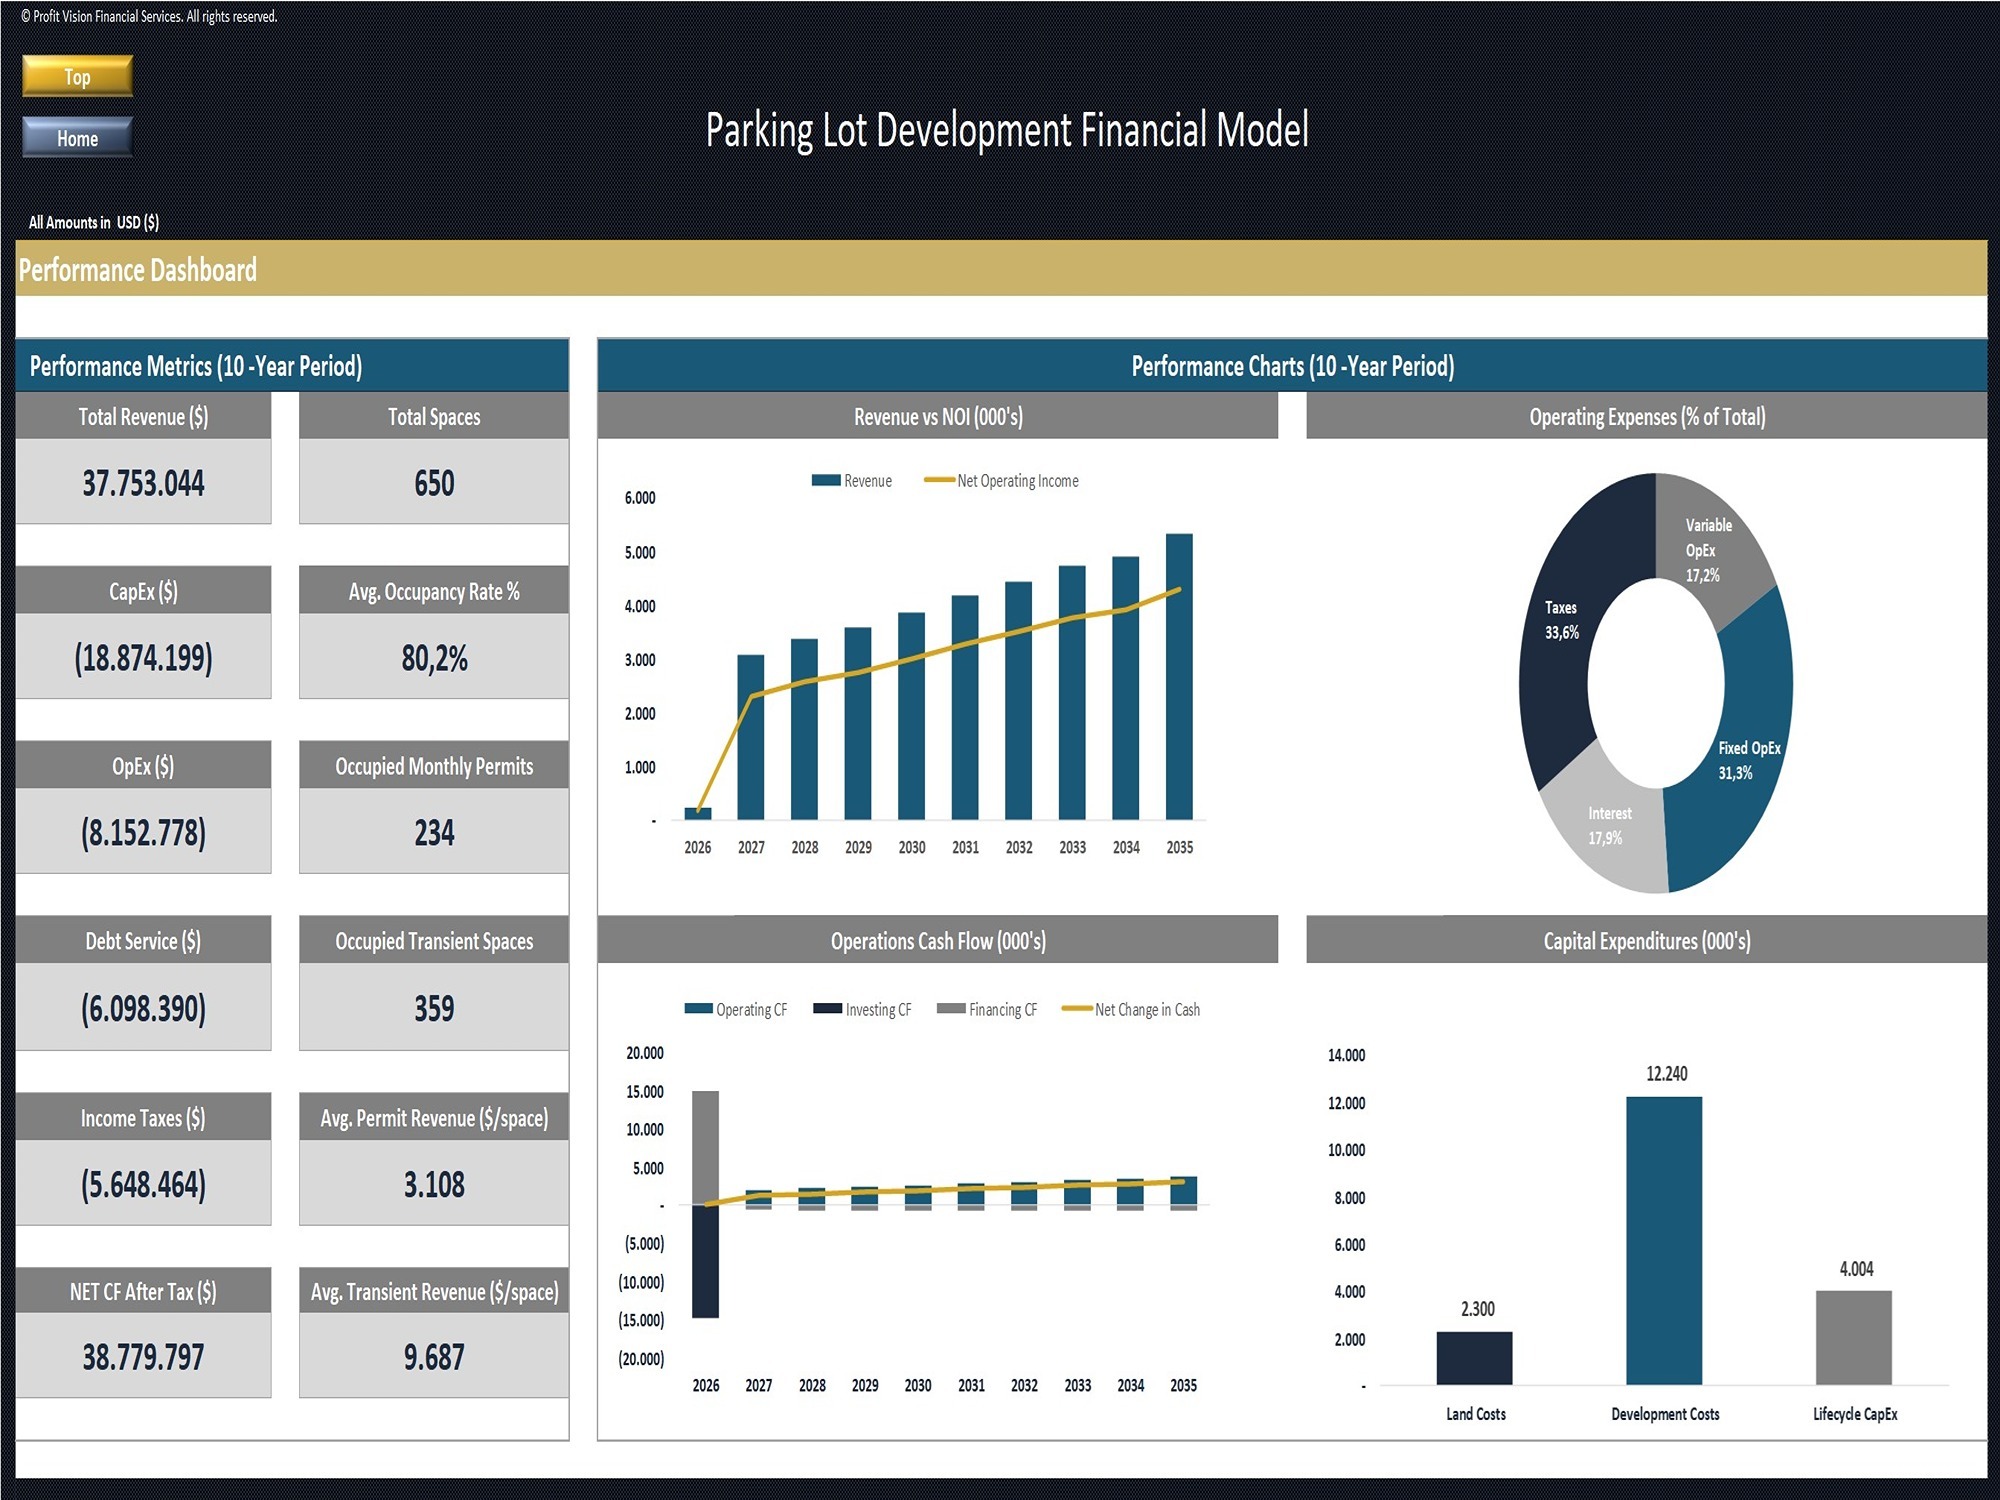
– Project Dashboard including performance metrics and charts
• Investors Distribution Waterfall
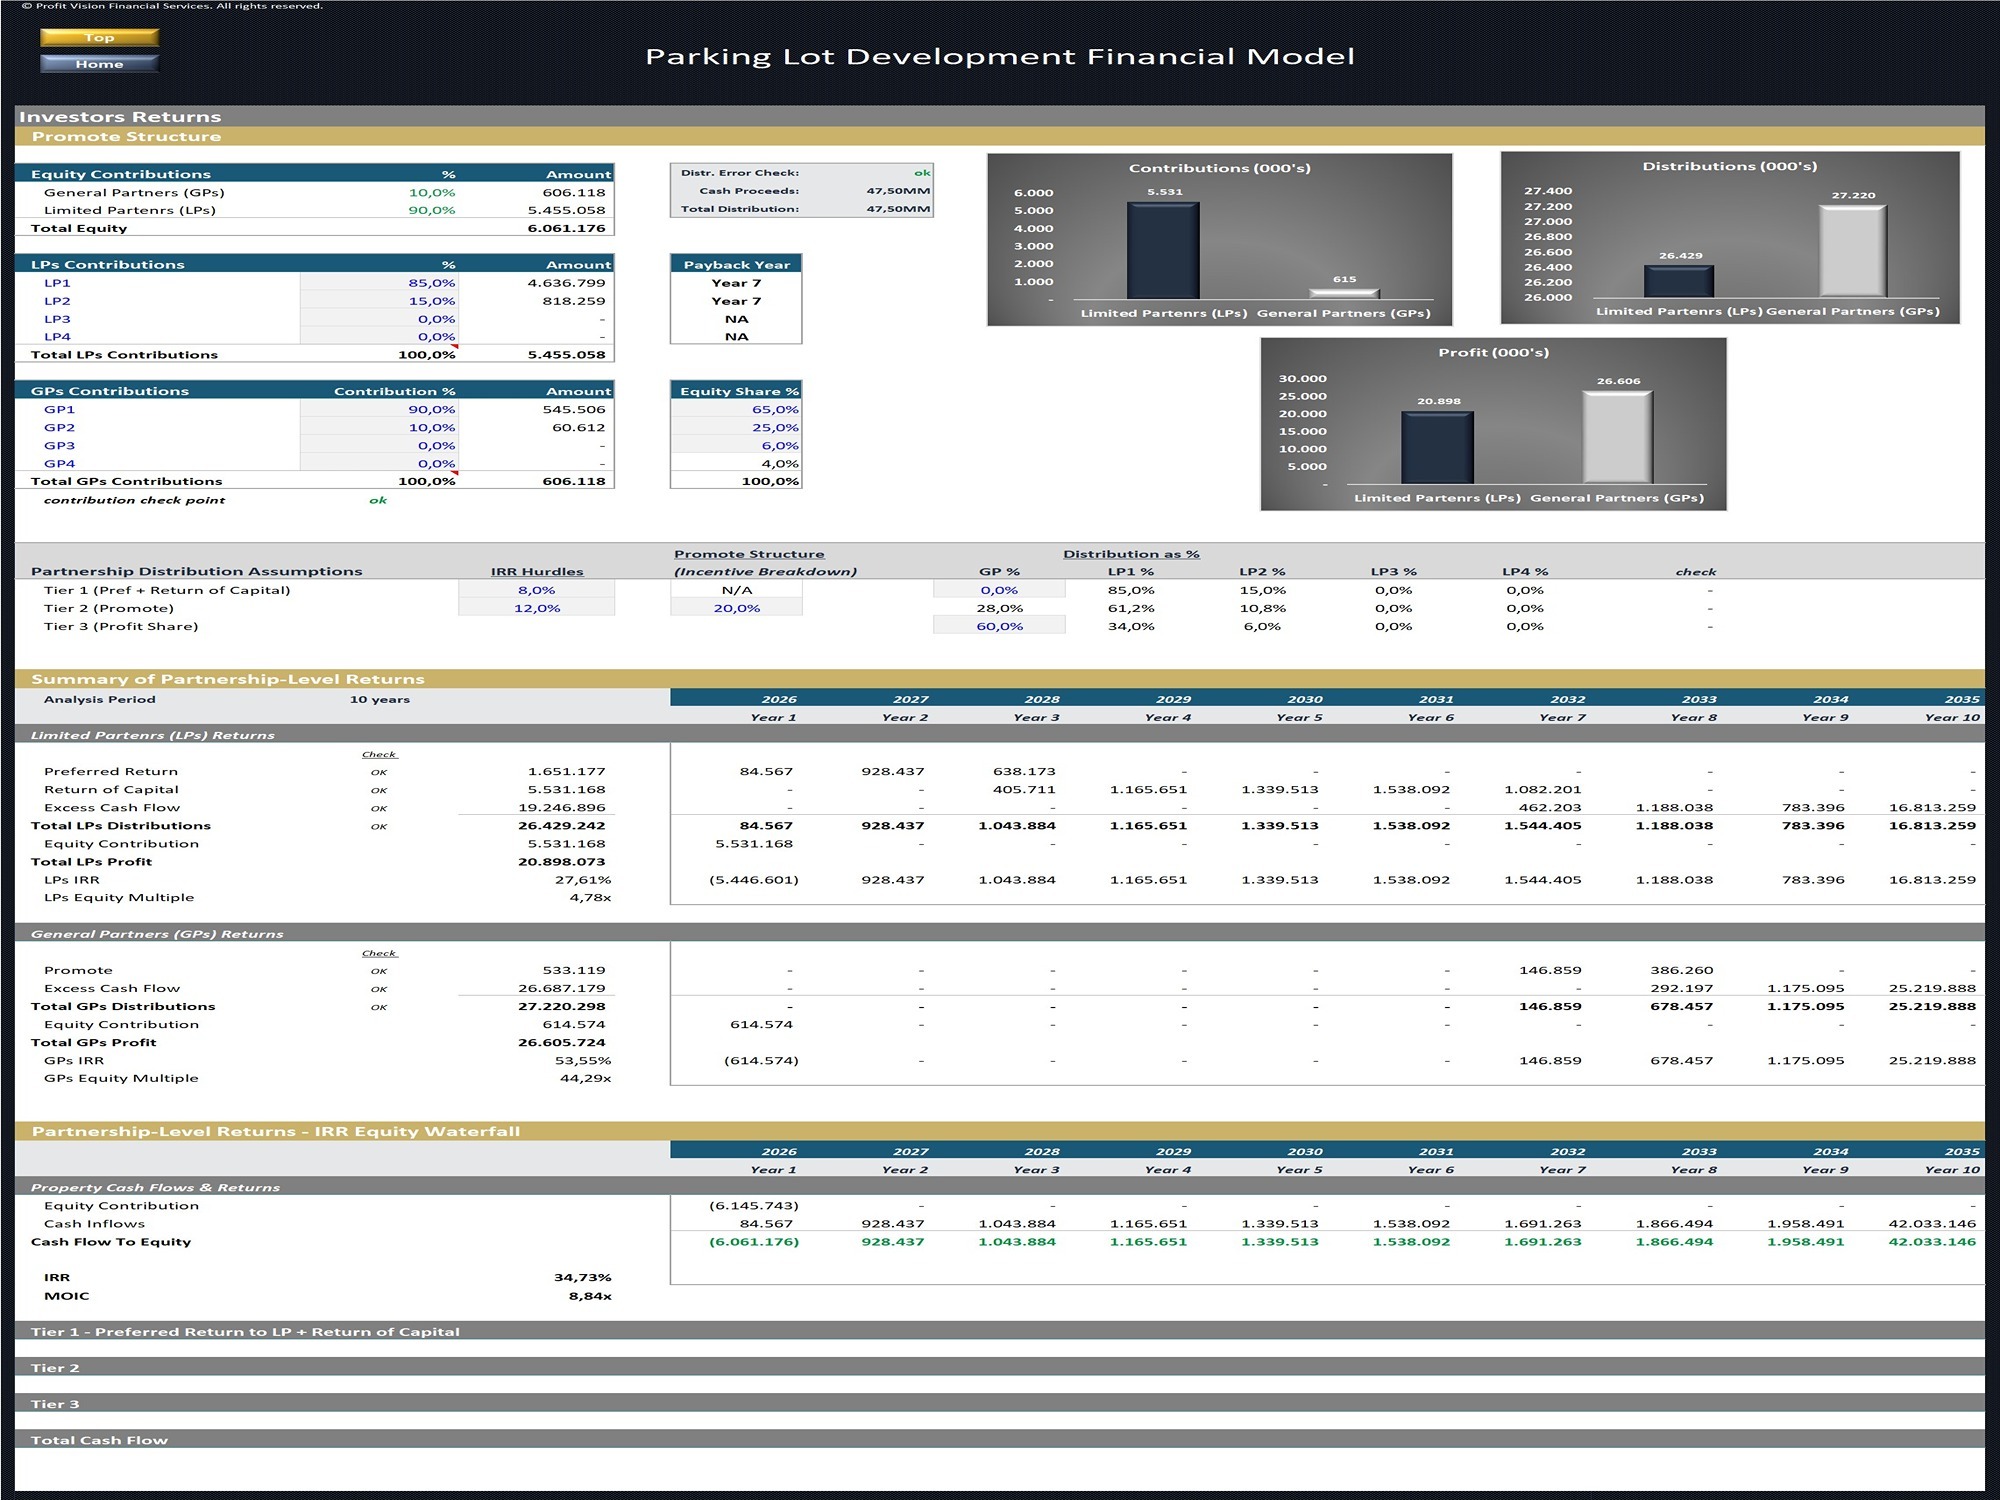
A 3-tier IRR hurdle waterfall model to distribute proceeds between investors. The report provides inputs for up to 4 different LPs with different equity contribution percentages and up to 4 different GPs with different equity contributions and equity share percentages. The first tier distributes cash flow to the partners until the LPs has achieved some defined preferred return and received a full return of capital. Assuming the preferred return hurdle is hit in tier one, cash flow is distributed in tiers two and three based on a defined promote structure and hurdle rates as outlined by the user.
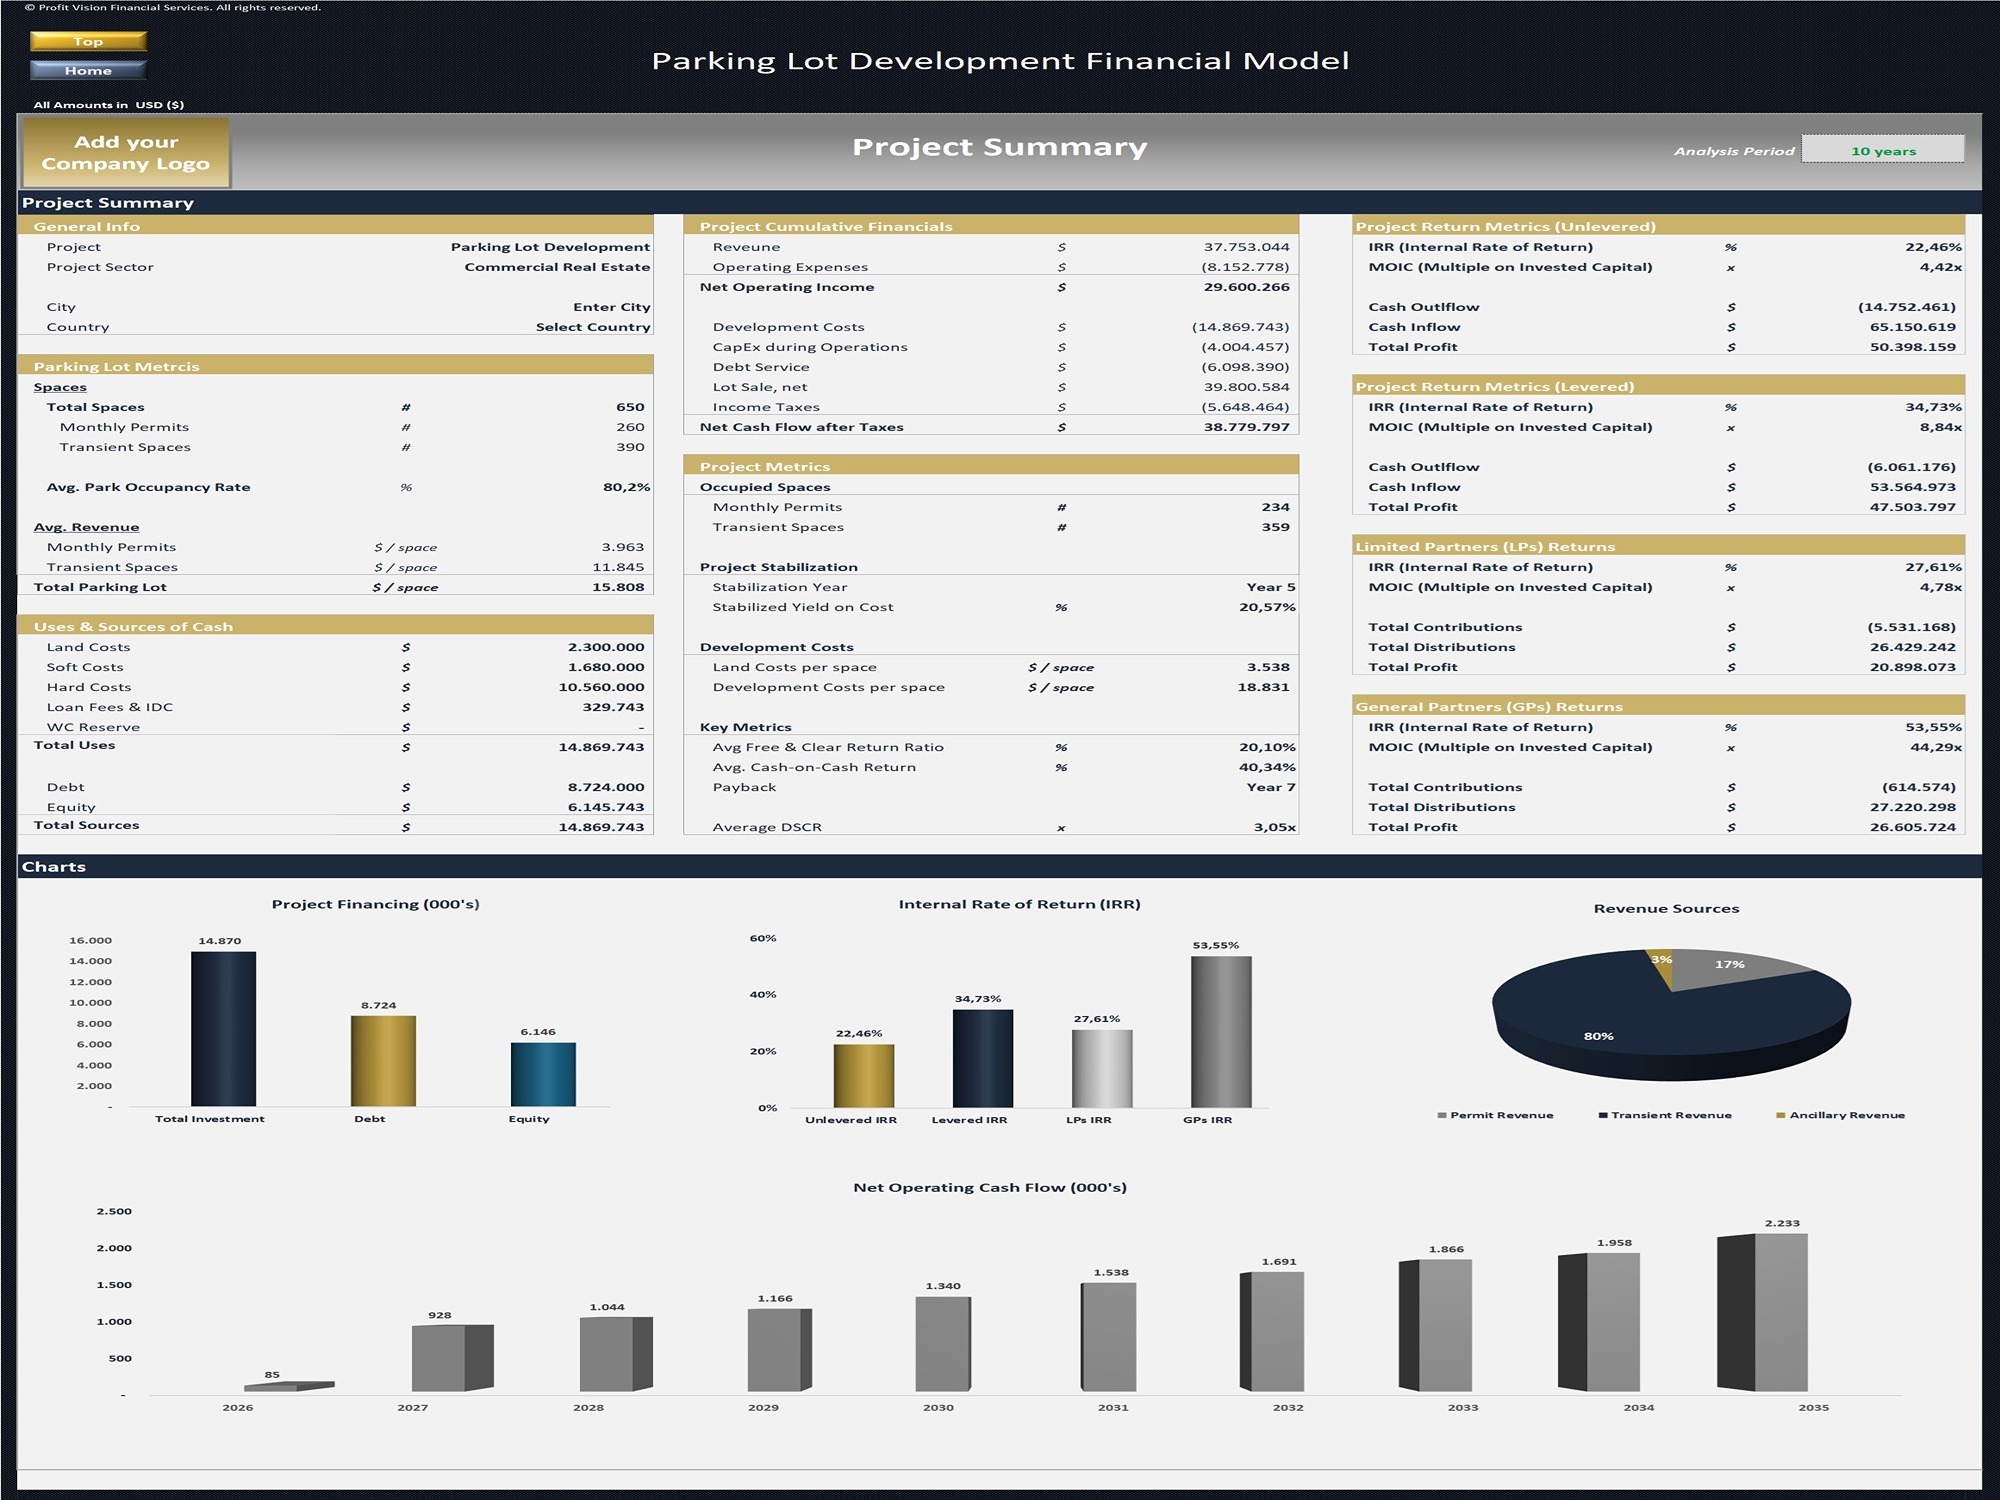
• Project Executive Summary
Professional Executive Summary report containing all of the high-level relevant information for review and is designed to be easy to read, print, and save to pdf. The report includes Project General Info, Timing, Sources, and Uses of Cash, Operations Summary and Key Metrics, Project and Investor return metrics.
A parking lot is a land-based facility that provides designated spaces for vehicle parking, serving drivers who need short-term or long-term access near destinations such as offices, retail centers, airports, or event venues. It can operate as self-park or valet and may include features like payment kiosks or mobile payment, lighting, security cameras, access control, and EV charging. Revenue is typically generated through hourly, daily, or monthly fees and permits, with performance driven by location, utilization, pricing strategy, and operating costs such as staffing, maintenance, and security.
This 10-year Parking Lot Development financial model provides a full feasibility and underwriting view—from land acquisition and construction through ramp-up, stabilized operations, and exit. It models capacity and utilization, pricing by product (hourly/daily, monthly permits), seasonality, and ancillary income, while capturing key operating drivers including staffing, payment systems, maintenance, security, insurance, property taxes, and resurfacing capex reserves. The model is fully integrated with financing assumptions and return metrics, with scenario and sensitivity analysis to test demand, pricing, and cost inflation—supporting lender underwriting and investor decision-making.
The structure of the template follows Financial Modeling Best Practices principles and is fully customizable.
Model Structure
• Setup Assumptions
This section is used to input all the assumptions for the project.
It includes assumptions for Project Timing, Total Parking Spaces, Revenue Assumptions (Monthly Permits, Transient Spaces, Ancillary revenue), Operating Expenses, Capital Expenditures, Uses & Sources of Cash, and Project Financing
• Development Budget & Development Chart
This section includes all assumptions for the property development.
It includes Land Costs, Hard Costs , Soft Costs, Development Contigencies and Development timing. A dynamic chart presents the development cash flow.
• Debt Schedule
Loan amortization Schedule ( including an optional moratorium and interest-only (IO) period.
• Project Cash Flows and Return Metrics
Presentation of Project’s Cash Flow and Returns including the below reports:
– Monthly and Quarterly Project Cash Flow per Year
– Annual Project Cash Flow
– Financing and Tax Supporting Schedules
– Key Performance Indicators
– Unlevered & Levered Project Return Metrics (IRR, MOIC, Payback, NPV)
– Project Dashboard including performance metrics and charts
• Investors Distribution Waterfall
A 3-tier IRR hurdle waterfall model to distribute proceeds between investors. The report provides inputs for up to 4 different LPs with different equity contribution percentages and up to 4 different GPs with different equity contributions and equity share percentages. The first tier distributes cash flow to the partners until the LPs has achieved some defined preferred return and received a full return of capital. Assuming the preferred return hurdle is hit in tier one, cash flow is distributed in tiers two and three based on a defined promote structure and hurdle rates as outlined by the user.
• Project Executive Summary
Professional Executive Summary report containing all of the high-level relevant information for review and is designed to be easy to read, print, and save to pdf. The report includes Project General Info, Timing, Sources, and Uses of Cash, Operations Summary and Key Metrics, Project and Investor return metrics.
This Best Practice includes
Excel Financial Model
Further information
Provides a solid financial framework to assess project viability, optimize returns, and guide strategic development decisions.
