
Originally published: 19/04/2024 07:02
Publication number: ELQ-42208-1
View all versions & Certificate
Publication number: ELQ-42208-1
View all versions & Certificate

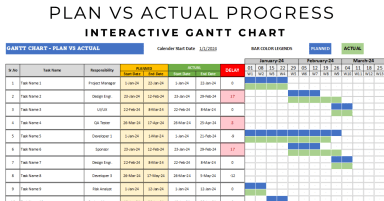
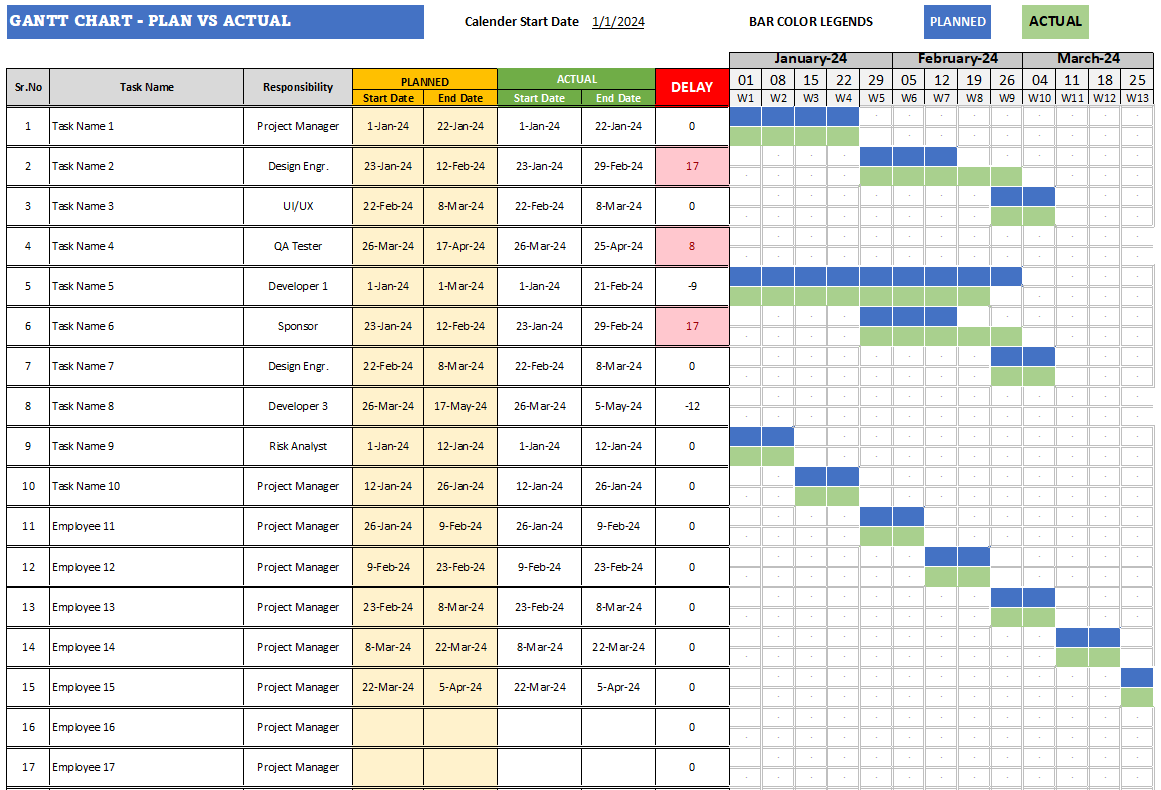
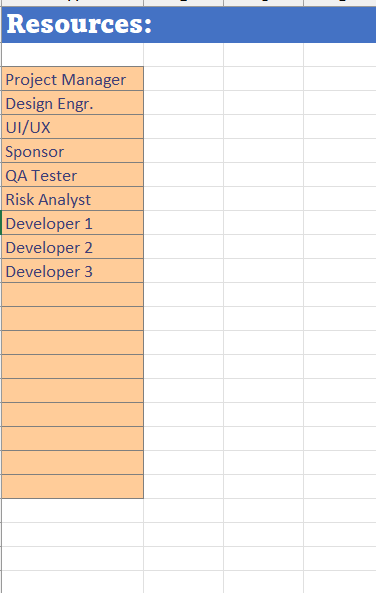
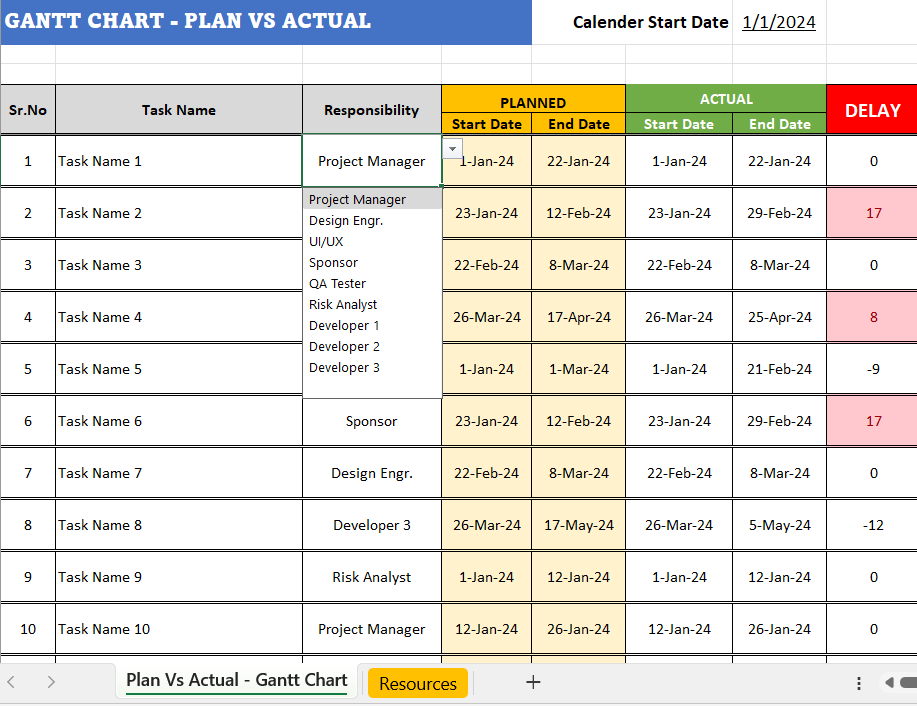
Plan Vs Actual Progress Gantt Chart in Excel
Track and compare planned vs actual progress seamlessly with our automated Gantt chart. Colorful, year-long calendar view for easy monitoring.
Business Planning and Project Management Professional | Top Rated Freelancer at Fiverr | CERT 5 at PeopleperhourFollow 17
