Originally published: 13/02/2024 11:21
Publication number: ELQ-88889-1
View all versions & Certificate
Publication number: ELQ-88889-1
View all versions & Certificate

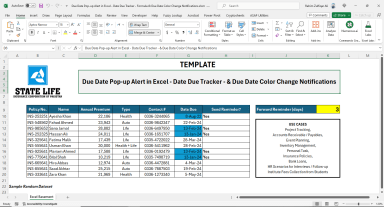
Due Date Pop-up Alert & Tracker with Color Change Notifications in Microsoft Excel
Due Date Pop-up Alert in Excel - Date Due Tracker - Due Date Color Change Notifications
Founder & CEO - Excel Basement, Microsoft MVP (Excel) 2025, MCT, MSOM, Excel & POWER BI Trainer & Consultant, MBA (MIS), Emerging Data ScientistFollow 463
