Restaurant P&L & Ops Command Center (Monthly Budget vs Actual)
Originally published: 25/09/2026 16:26
Publication number: ELQ-18140-1
View all versions & Certificate
certified

Restaurant P&L & Ops Command Center (Monthly Budget vs Actual)

Plan and track restaurant P&L, prime cost, and labor—with real Actuals entry, scenarios, Fav/Unfav variance, and a Checks audit.

Description
A macro-free Excel ops command center for a single restaurant location. Edit one Assumptions sheet; Labor_COGS, P&L, Dashboard, and Checks update from the same drivers. Sample Base case ships ready to explore (fictional Harbor & Hearth Bistro, Charleston).

Not another static annual budget spreadsheet. It ties category sales, COGS %, labor hours×wages, and OpEx to a live monthly P&L—with Budget vs Actual, Base/Upside/Downside scenarios, prime-cost alerts, and a 21-check audit so buyers trust the math.


What you get on the Dashboard:
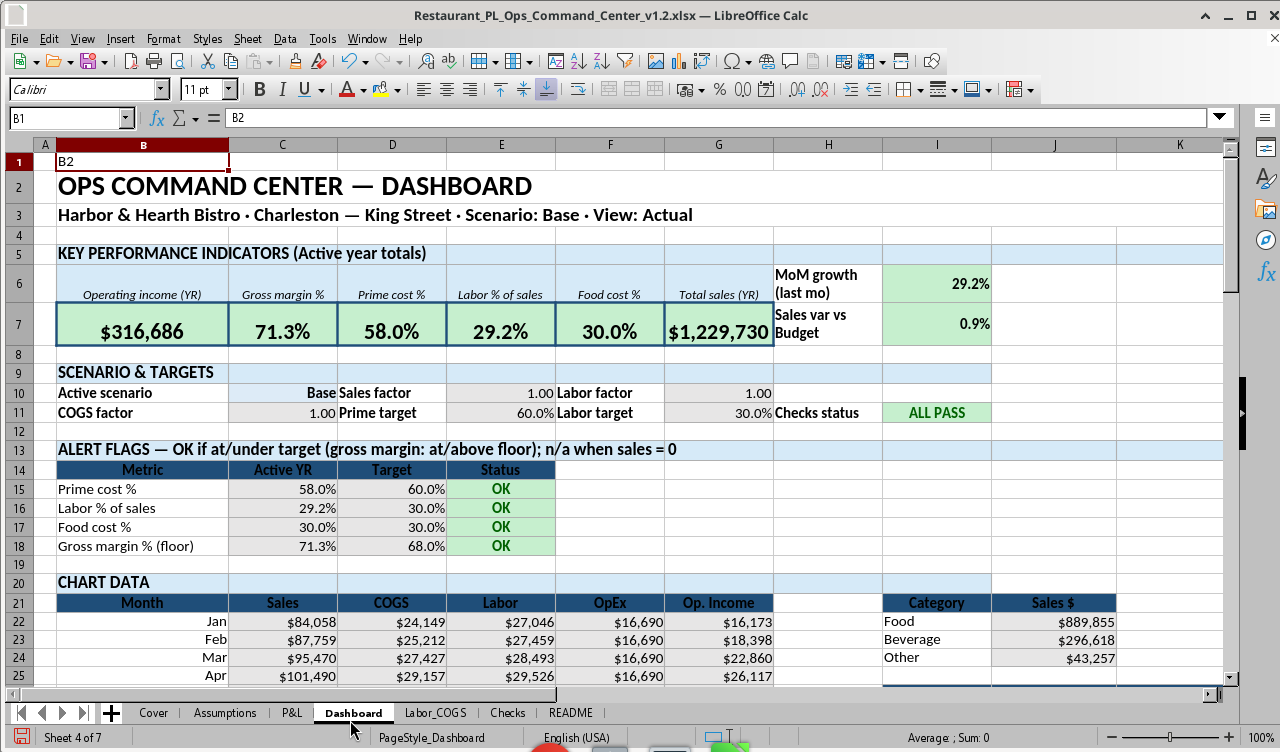
• Operating income, gross margin %, prime cost %, labor % of sales, food cost %, total sales (YR)
• Active scenario + sales/labor/COGS factors + editable targets
• Checks status tile (sample Base: ALL PASS)
• Alert flags: prime / labor / food / GM — OK / ALERT / n/a (n/a when year sales = 0)
• Charts: monthly P&L bars, category mix, prime-cost trend
• Print tip: landscape, fit to 1 page wide


Genuine upgrades (v1.2):
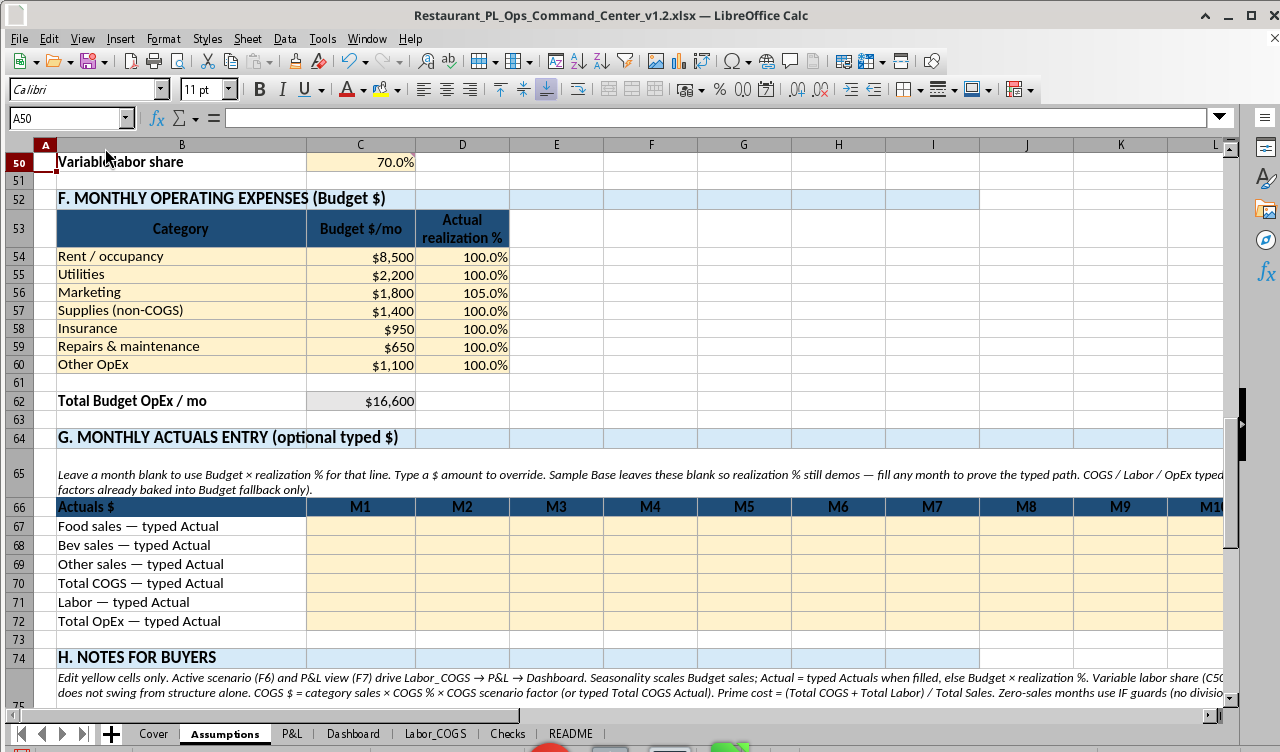
1. Real Actuals entry + realization fallback — enter Food / Bev / Other sales $, Total COGS $, Labor $, and Total OpEx $ by month. Blank → Budget × realization %; filled → typed $.
2. Variable labor share — Assumptions C50 (default 70%). Labor flexes with seasonality; annual Budget labor is no


Intentional limits: single-location, 12-month engine. No multi-unit rollup, covers×check-average / daypart engine, inventory / theoretical vs actual food-cost, tip pooling, balance sheet, cash flow, or tax. Typed Total COGS / OpEx allocate by mix (not independent category Actuals grids). Planning aid—reconcile to POS and books before lender or board use.


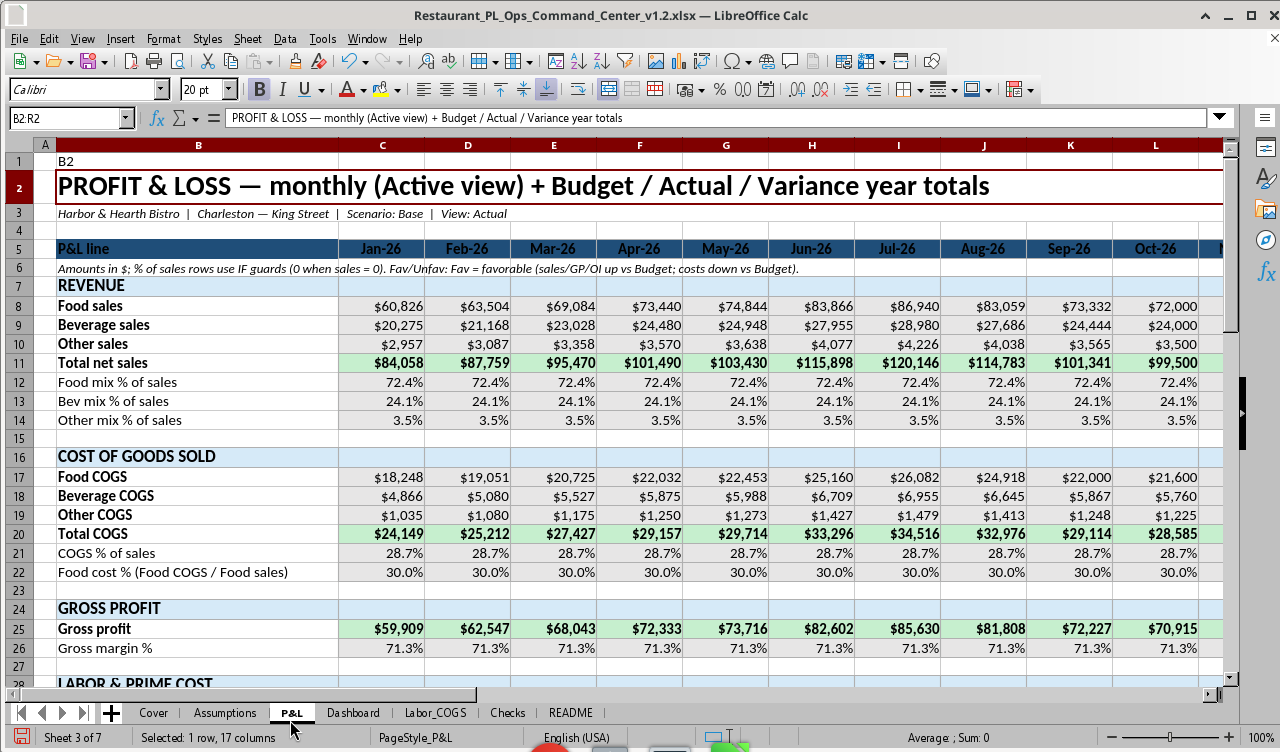
Sample Base case: Harbor & Hearth Bistro · Charleston — King Street · FY start Jan 2026 · Scenario Base · View Actual. Budget base ~ $99.5k/mo (Food $72k / Bev $24k / Other $3.5k) × seasonality. Actuals entry blank → realization % demos (~96–108% by month). COGS: Food 30% / Bev 24% / Other 35%. Targets: prime 60%, labor 30%, food cost 30%, GM floor 68%. Variable labor share 70%; Labor Budget YR = 12 × C48 (~$356k). Actual year sample: sales ~$1.23M · OI ~$317k · GM ~71.3% · prime ~58% · labor ~29% · food cost 30%. Alerts all OK · Checks YES — ALL PASS (21).


Who it’s for: restaurant owners / GMs needing monthly P&L, prime cost, and labor in one workbook; multi-unit operators running one file per location; fractional CFOs / F&B finance leads; and operators who want typed Actuals with realization fallback. Not for multi-unit consolidators, full recipe costing / inventory variance, tip pooling or jurisdiction wage rules, full 3-statement accounting models, or buyers who only want a simple sales and labor % sheet.


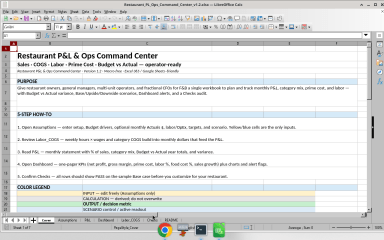
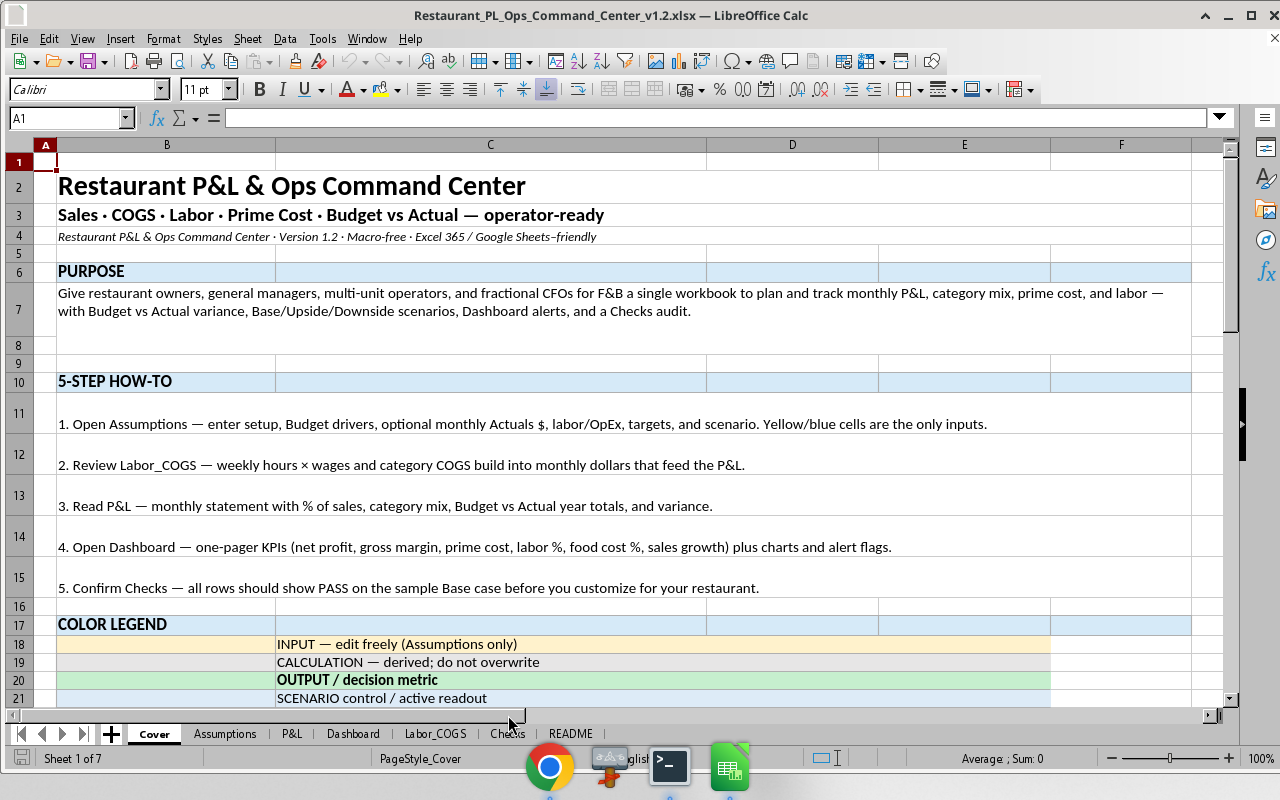
How to use (5 steps): Open Assumptions and enter setup, Budget drivers, optional monthly Actuals $, labor/OpEx, targets, and scenario; review Labor_COGS; read P&L; open Dashboard; confirm Checks all show PASS before customization.


Compatibility: Excel 365 / Excel 2021+ recommended. Google Sheets generally works (charts may need light re-insert); LibreOffice Calc opens and recalculates. Macro-free; sample figures fictional. Product ID: RPL-OC-v1.2.


Integrity note: Original structure, labels, sample data, and wording. Inspired by category demand for restaurant P&L / ops dashboards on Eloquens—not cloned from any seller’s file.
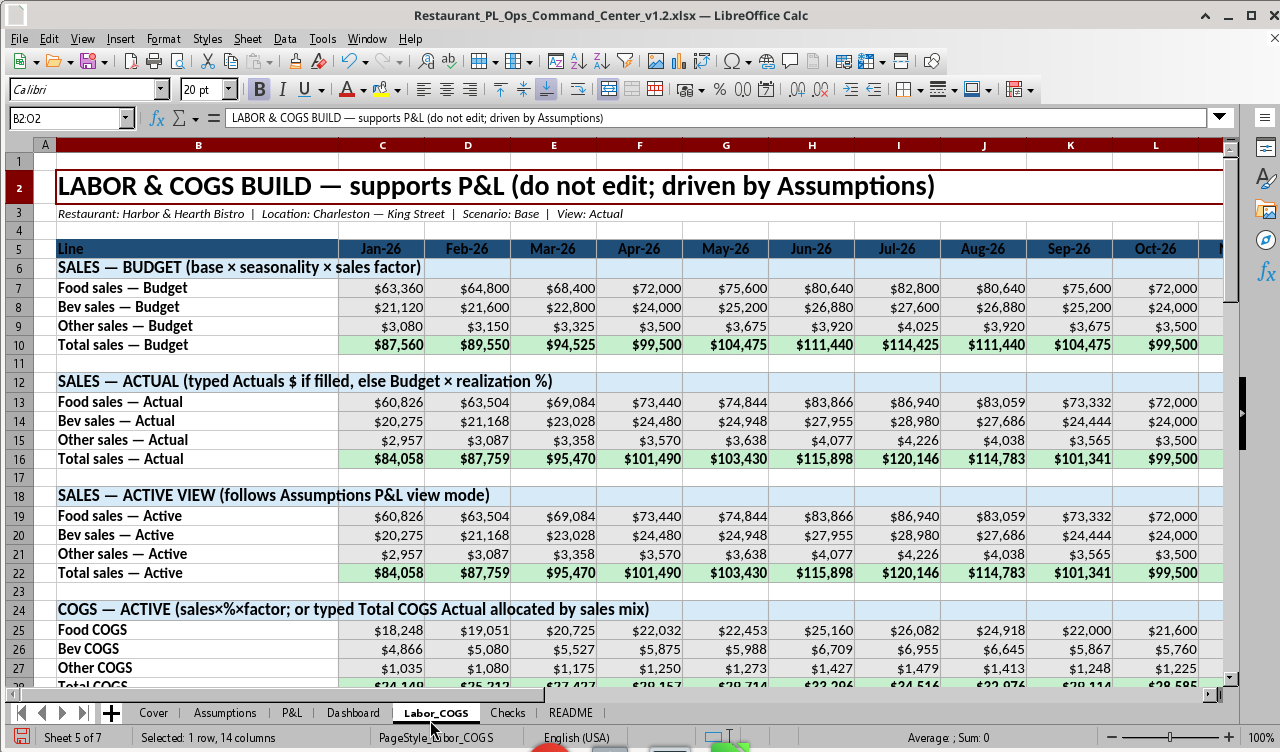
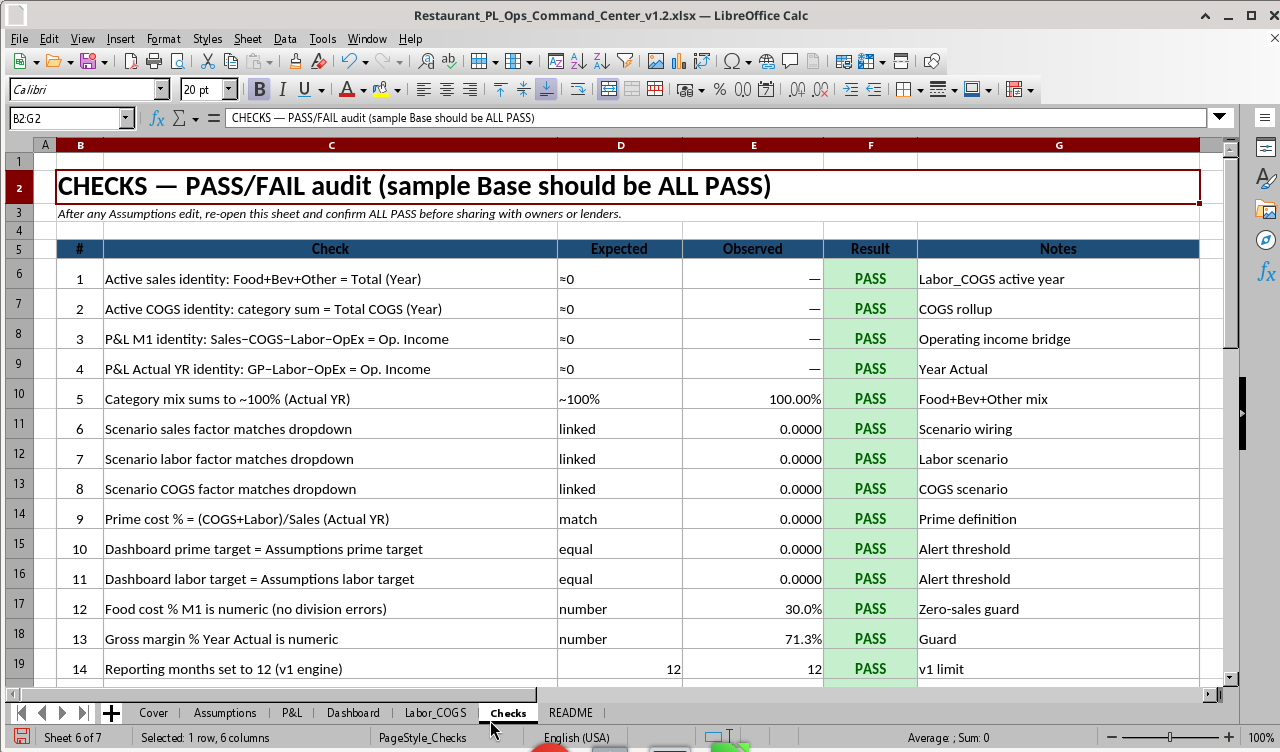
What’s included: Cover (purpose, 5-step how-to, color legend, sheet map, disclaimer); Assumptions (sole input sheet: setup, sales, COGS, labor, OpEx, scenario, Actuals entry); P&L (monthly P&L + % of sales + Budget/Actual/Variance/Fav-Unfav year totals); Dashboard (ops one-pager, KPIs, charts, alerts, Checks tile); Labor_COGS (hours×wage labor build + COGS); Checks (PASS/FAIL audit, 21 checks); README (methodology, metric definitions, limits, version, compatibility). Yellow/blue = inputs; gray = calculations; green = key outputs. Macro-free, no VBA, no circular refs by design.rmalized to 12 × C48 × labor factor.
3. Fav / Unfav variance — Fav = sales/GP/OI up vs Budget, or costs down vs Budget.
4. Dashboard Checks tile + 21 checks — identities include Actual YR category COGS sum = Total COGS Actual. Sample Base: YES — ALL PASS (21/21).
5. Zero-sales n/a alerts; percentage-of-sales cells use IF guards.
6. Budget vs Actual view mode drives monthly P&L + Dashboard; year columns show Budget, Actual, Variance $, Var %, and Fav/Unfav.
7. Typed Total COGS path allocates category Food/Bev/Other COGS Actual so category lines sum to the total; Check 21 locks it.

This Best Practice includes
Excel workbook (.xlsx) with 7 sheets: Cover, Assumptions, P&L, Dashboard, Labor_COGS, Checks, README; 6 screenshots in o

Acquire business license for $39.00

Add to cart

Add to bookmarks

Discuss

Further information

Plan and track a single restaurant location’s monthly P&L, prime cost, labor, Budget vs Actual performance, scenarios, alerts, and audit checks in one macro-free workbook.

Best for restaurant owners and GMs, one-file-per-location multi-unit operators, fractional CFOs, F&B finance leads, and operators who need typed Actuals with realization fallback.

Not intended for multi-unit consolidation, full recipe costing or inventory variance, tip pooling or jurisdiction wage rules, full three-statement accounting, or lender/board reporting without reconciliation to POS and books.


0.0 / 5 (0 votes)

please wait...