


Integrated S&OP Planning Workbook — Demand, Capacity, Inventory and Margin in One Excel Model
Originally published: 19/08/2026 16:31
Publication number: ELQ-15160-1
View all versions & Certificate
certified

Integrated S&OP Planning Workbook — Demand, Capacity, Inventory and Margin in One Excel Model

A complete monthly S&OP model in one Excel file: statistical safety stock, 18-month production plan, capacity check, and a financial reconciliation.

Description
Built for manufacturers running an ERP with no advanced planning module — where the monthly cycle still means exporting to Excel and rebuilding the same analysis by hand. The workbook connects the whole planning chain in one file.
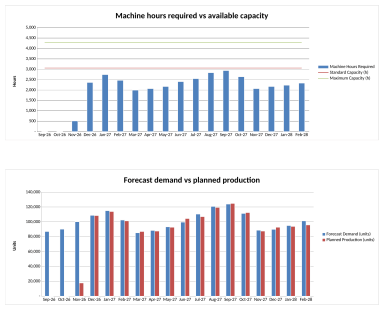
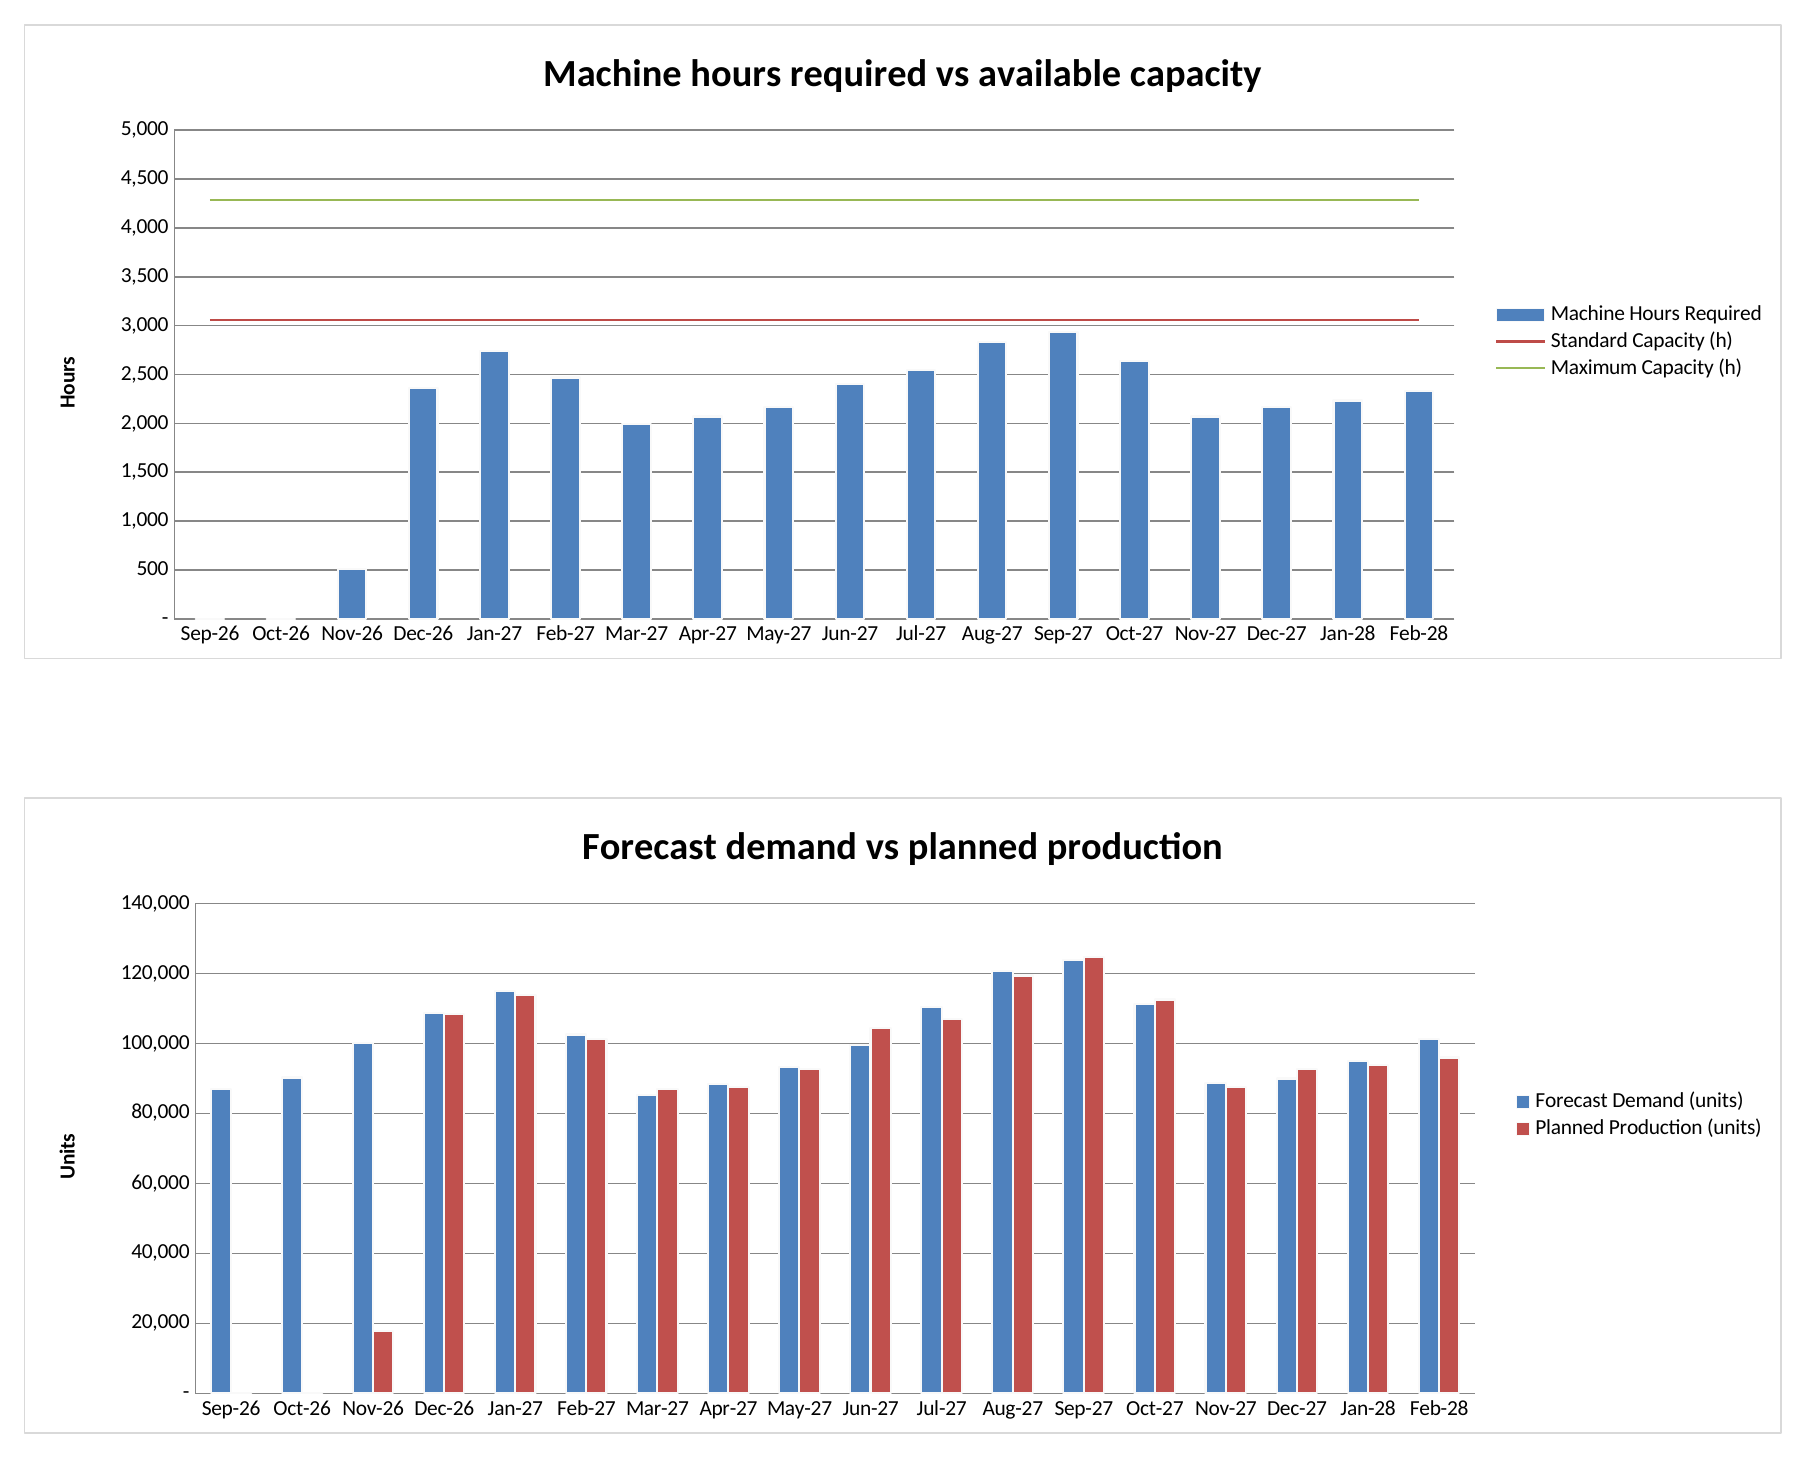
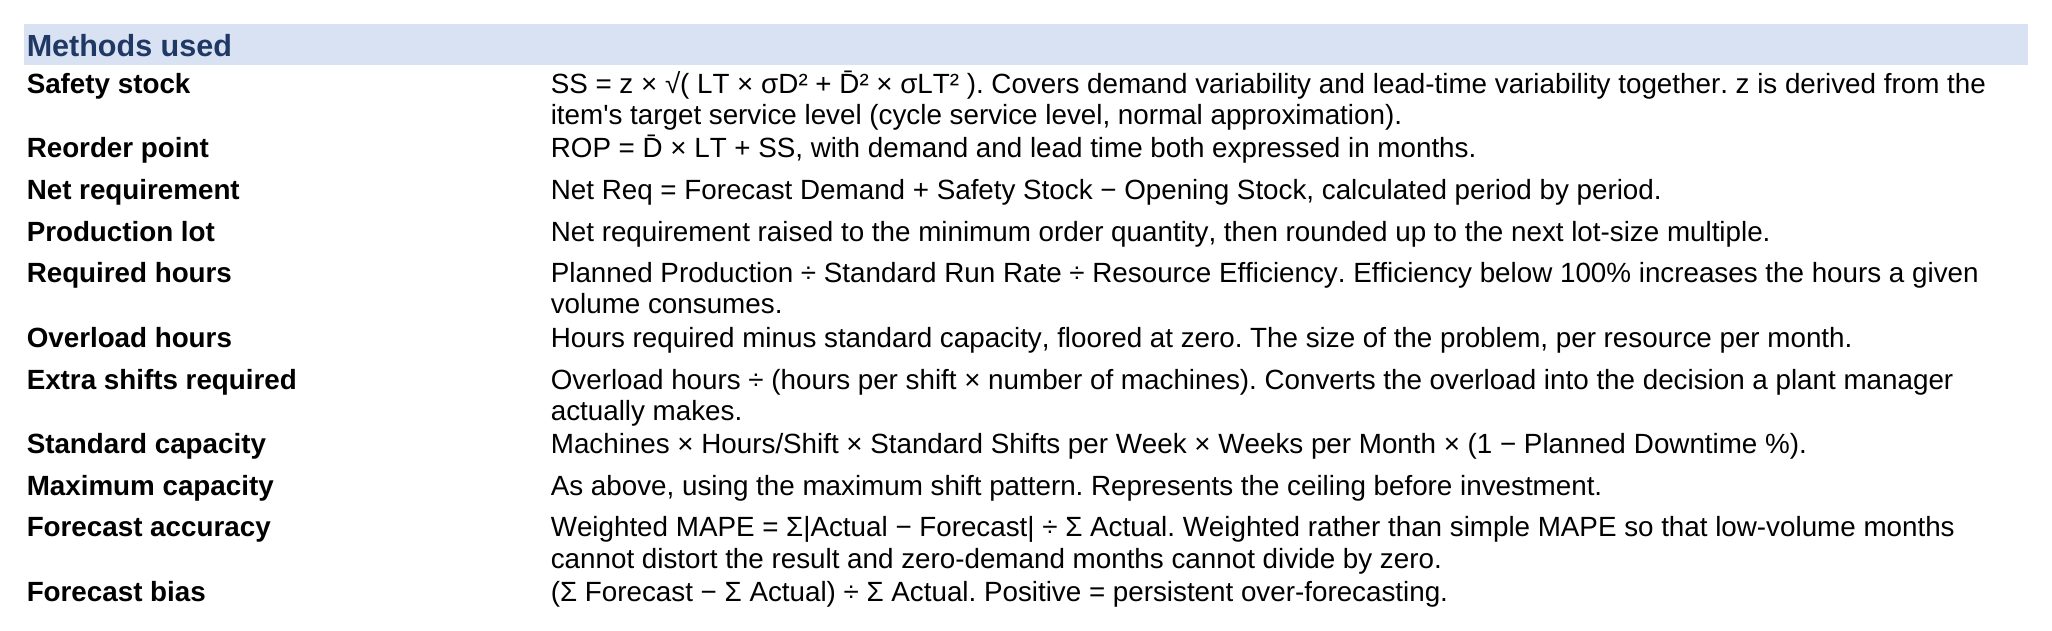
A demand forecast and twelve months of history drive statistical safety stock, calculated from demand variability and lead-time variability at each item's target service level. Net requirements become a production plan that respects minimum order quantity and lot size. That plan converts into machine hours and is tested against standard and maximum capacity, reporting overload hours and the additional shifts needed to close the gap. Projected stock, forward coverage and reorder points follow, with shortfalls and thin coverage flagged automatically.
Forecast quality is measured alongside it — weighted MAPE and bias across the history window — so you can see whether the plan rests on a forecast worth trusting.

A financial reconciliation restates the same volume plan in money: revenue and standard-cost COGS from the demand plan, gross margin against target, budget variance by month, working capital tied up in projected inventory, and what it would cost to buy the machine hours the plan needs. Revenue follows demand rather than production, so building stock never flatters the P&L. A product-family view splits the horizon by family.

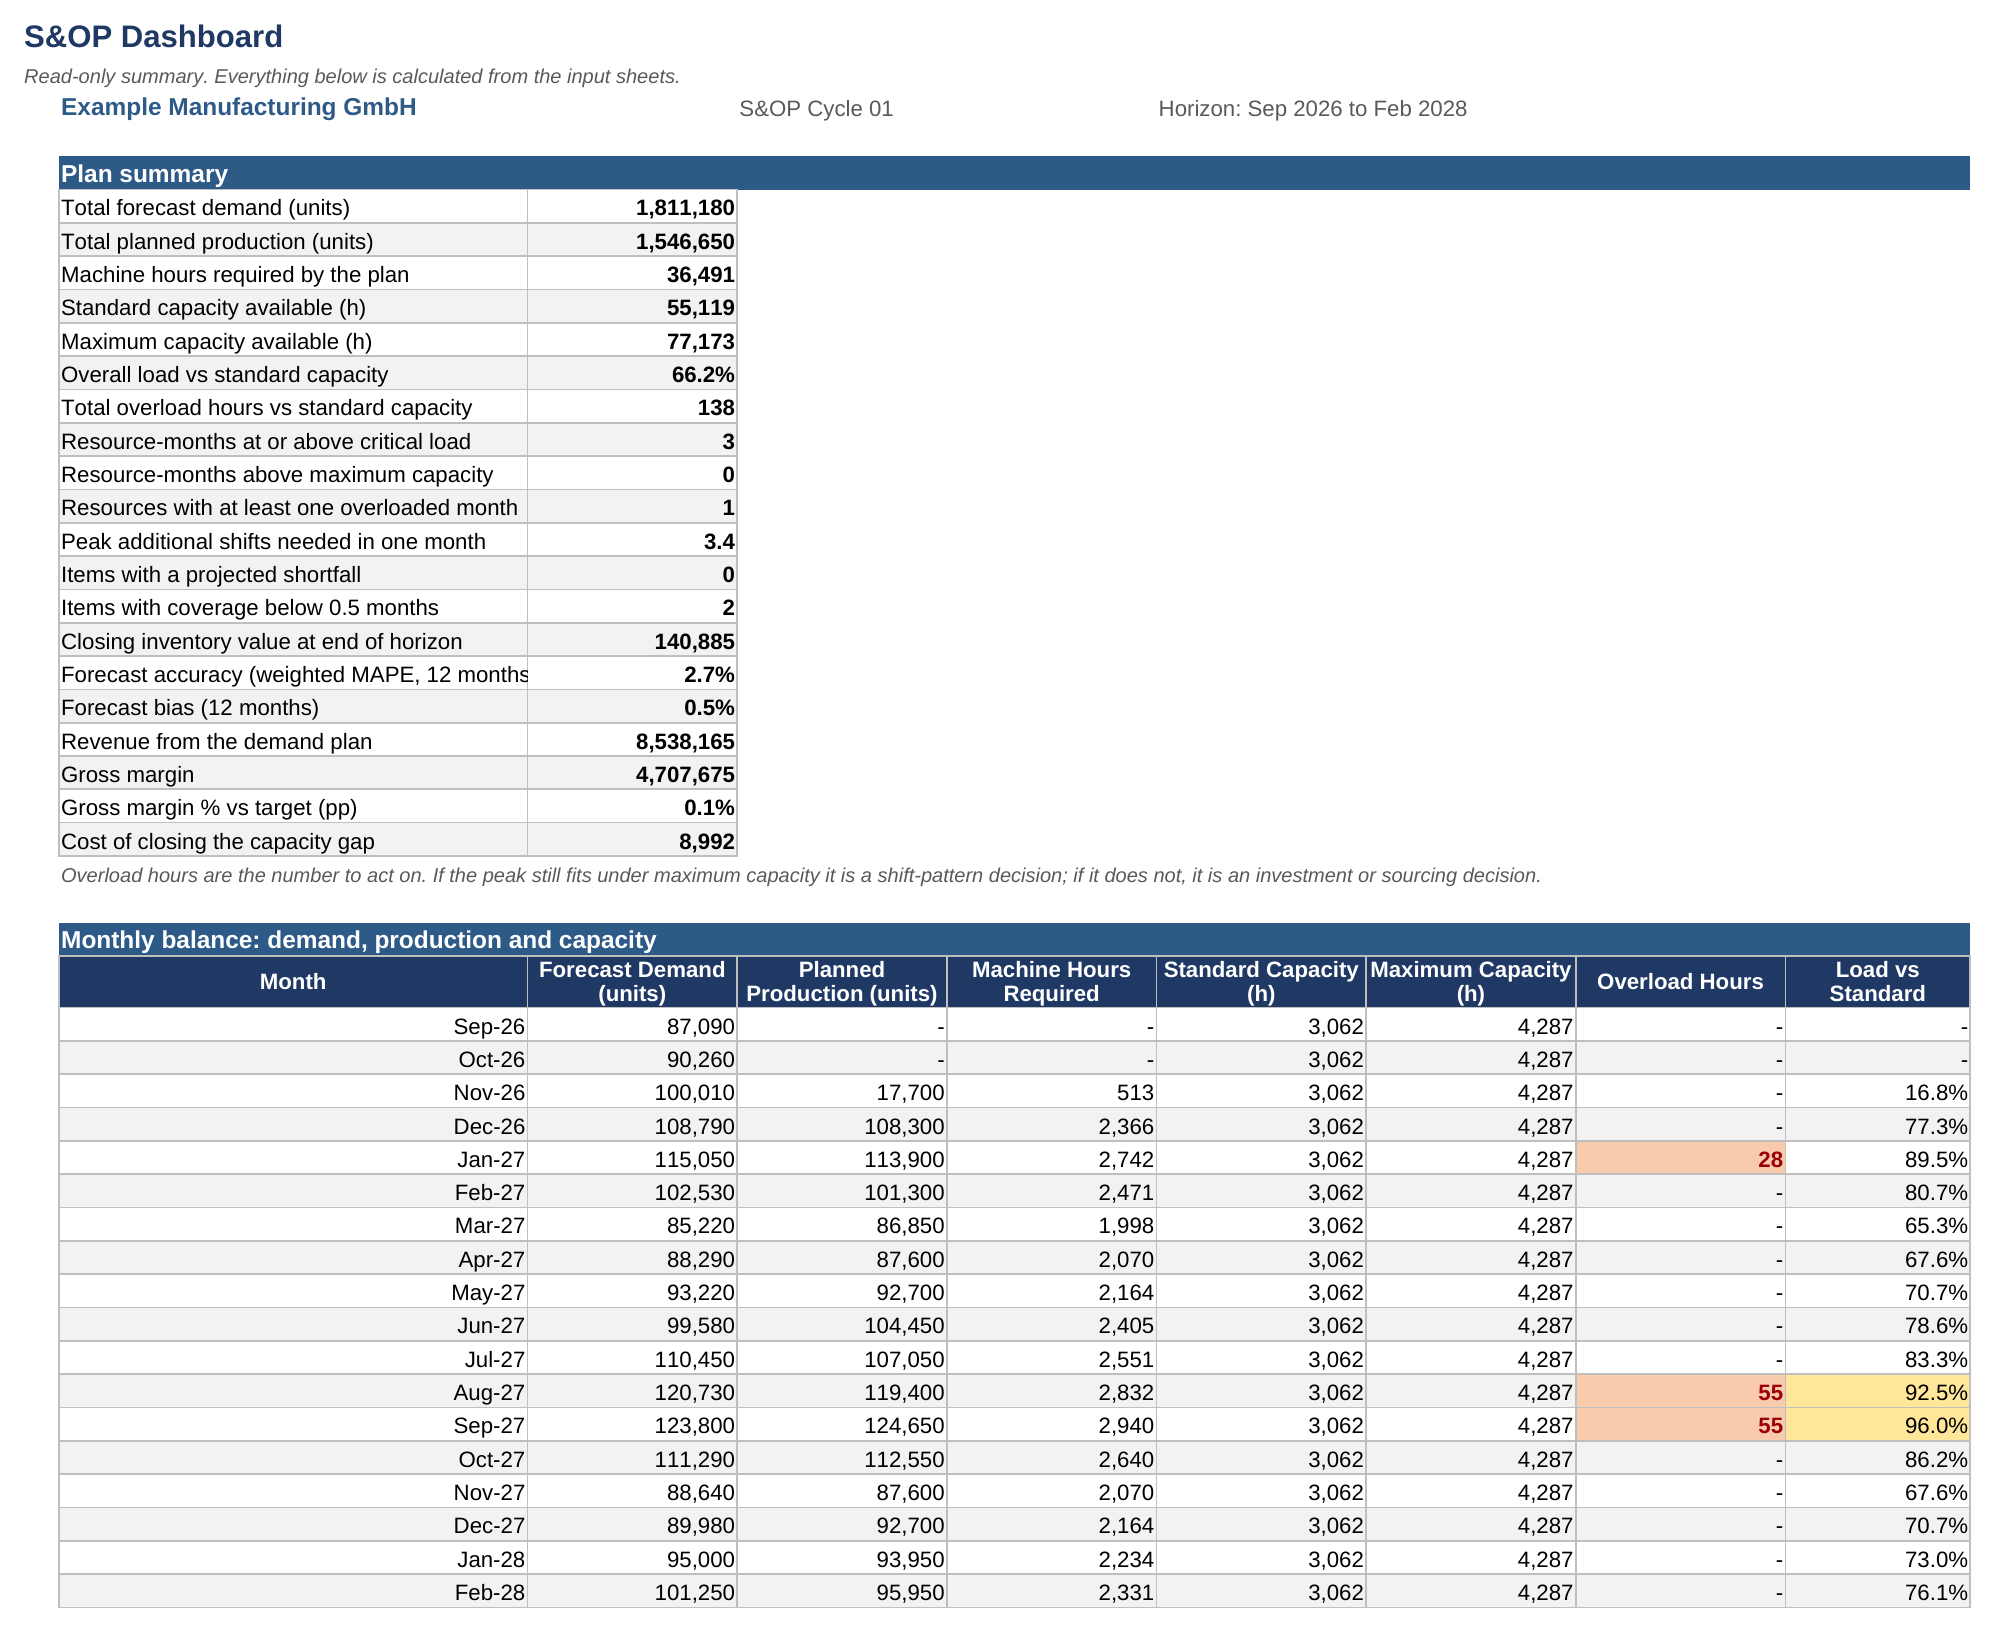
A dashboard summarises the cycle on one page: load against capacity, the resources that constrain it, items at service risk, margin against target, and supporting charts.

Everything recalculates from five input sheets. Input cells are colour-coded, worked example data is included, and the methods, formulas and assumptions are documented inside the workbook.

Pure Excel — no macros, no add-ins, no system connection. Sized for 60 planning items, 20 resources and an 18-month horizon.

This is rough-cut capacity planning: it sizes the capacity gap, it does not re-sequence production.

This Best Practice includes
1 Excel workbook (.xlsx), 11 sheets

Acquire business license for $39.00

Add to cart

Add to bookmarks

Discuss

Further information

Run a monthly S&OP cycle in one Excel file: set safety stock statistically instead of by rule of thumb, build an 18-month production plan, find the capacity bottleneck before it becomes a backorder, and show finance the revenue, margin and working capital that the same plan implies.

- You manufacture, and you run an ERP with no advanced planning module (no IBP, Kinaxis, o9 or APS)
- Planning happens at product family or planning-item level, up to 60 items and 20 resources
- Monthly buckets over a 12–18 month horizon
- Demand is reasonably regular, and you have 12 months of history
- Capacity is constrained by machines and shift patterns
- Operations and finance need to agree on one set of numbers

- You need weekly or daily scheduling, sequencing or changeover optimisation — use an APS
- Demand is highly intermittent or slow-moving; normal-distribution safety stock will understate the requirement
- You plan thousands of SKUs individually rather than at family level
- Material or component availability, not machine capacity, is your binding constraint
- You need actual costing, overhead absorption or purchase price variance rather than standard cost
- You already own an advanced planning system


0.0 / 5 (0 votes)

please wait...