
Originally published: 12/10/2023 14:10
Last version published: 08/04/2024 07:27
Publication number: ELQ-26395-3
View all versions & Certificate
Last version published: 08/04/2024 07:27
Publication number: ELQ-26395-3
View all versions & Certificate

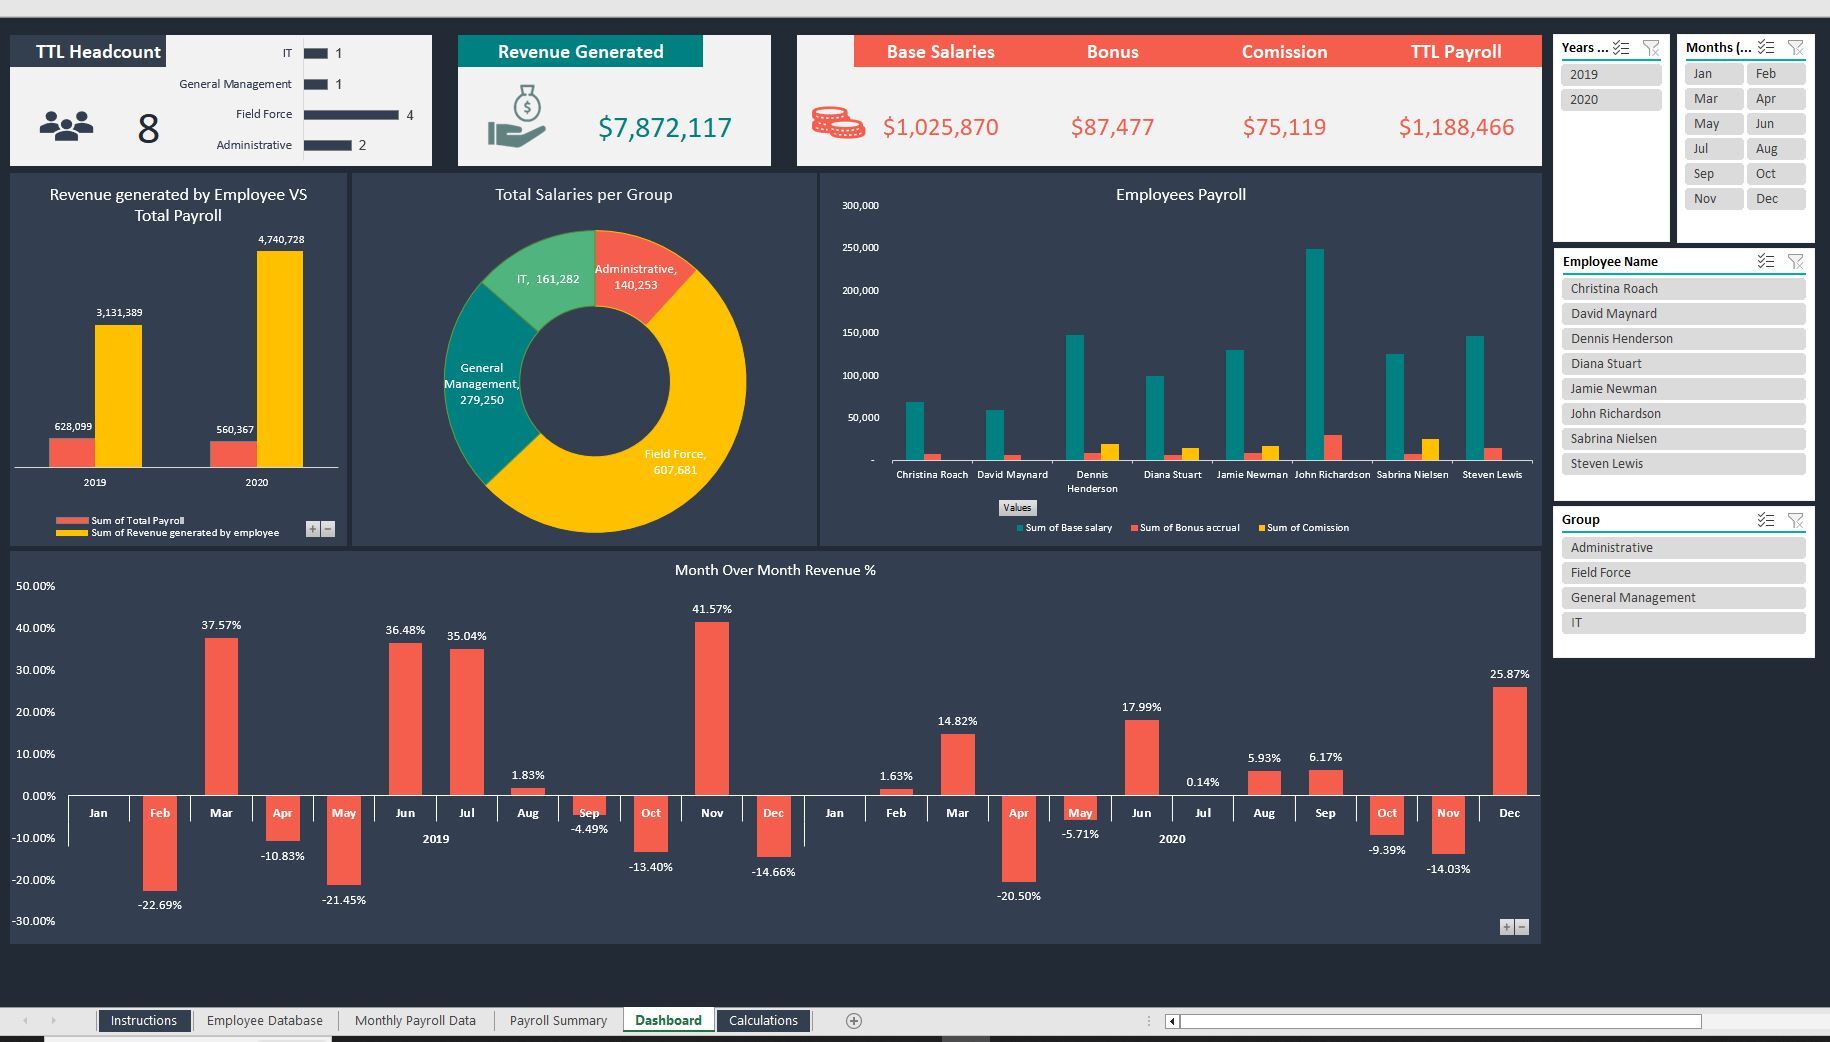
Human Resource Performance Metrics Template
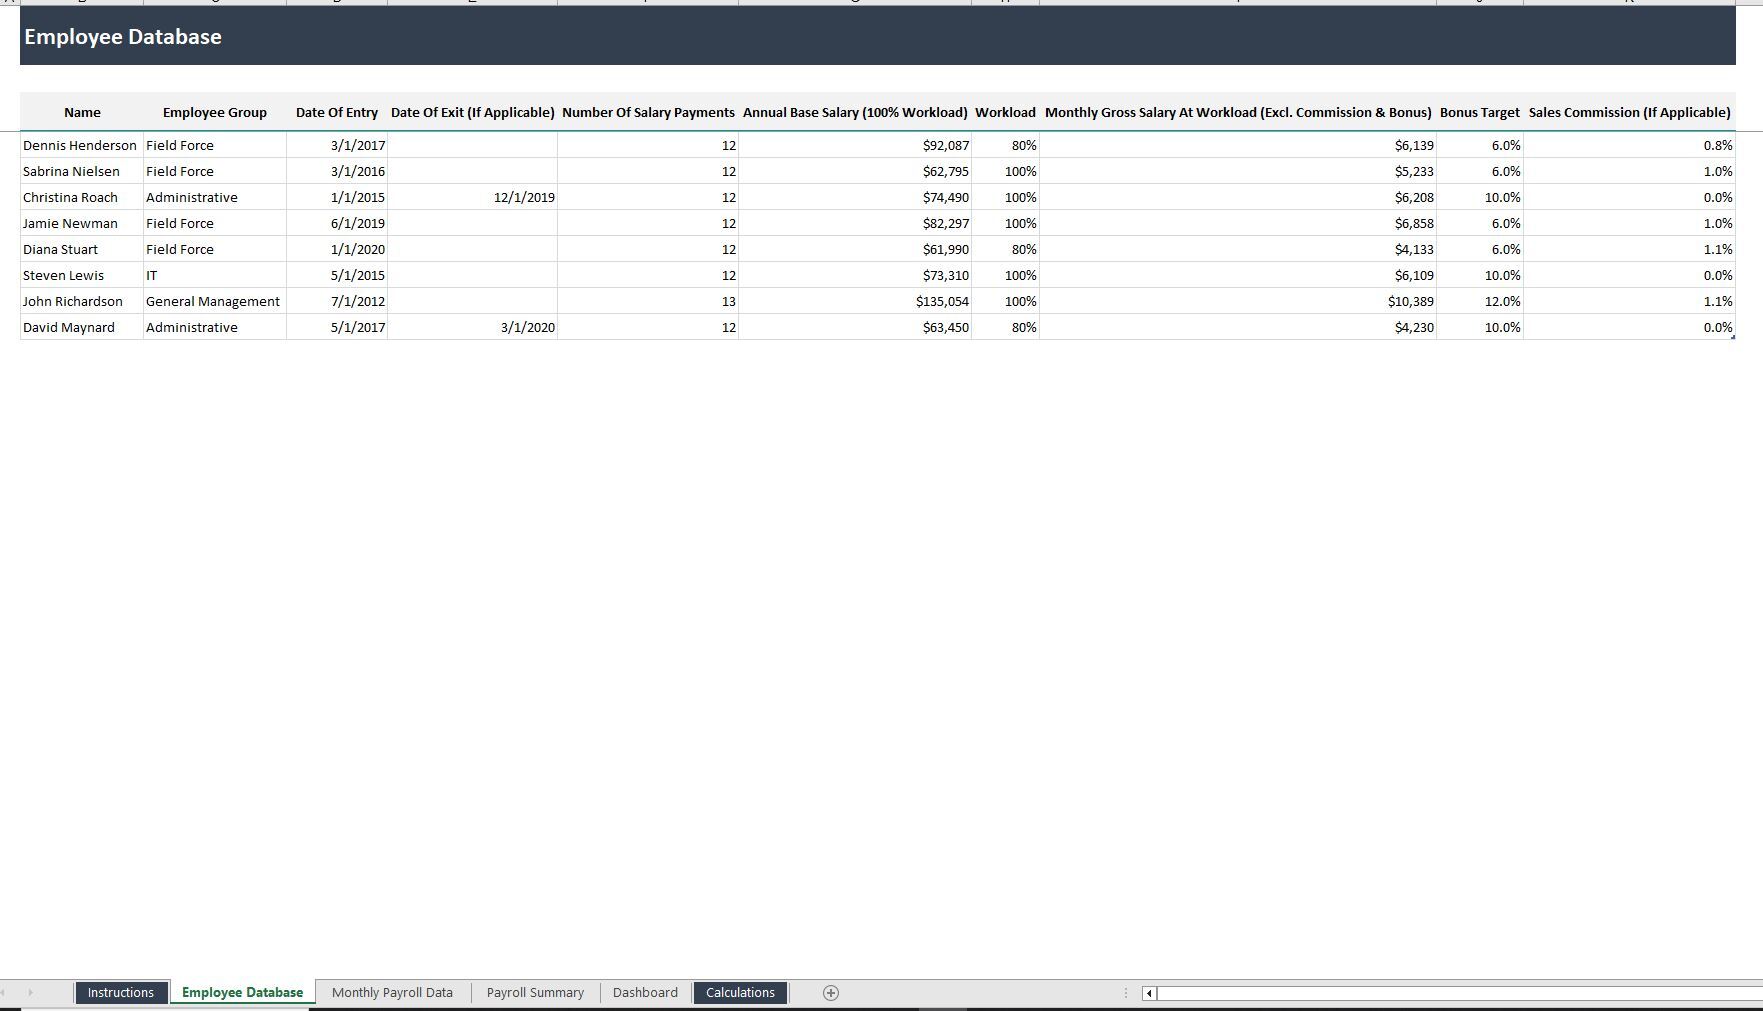
This template offers an in-depth overview of key performance indicators (KPIs) in Human Resource Management. It facilitates salary calculations, headcount track
Our online platform provides a wide range of engaging and useful templates that cater to various needs.Follow 85
