
Originally published: 31/10/2024 23:17
Publication number: ELQ-26634-1
View all versions & Certificate
Publication number: ELQ-26634-1
View all versions & Certificate

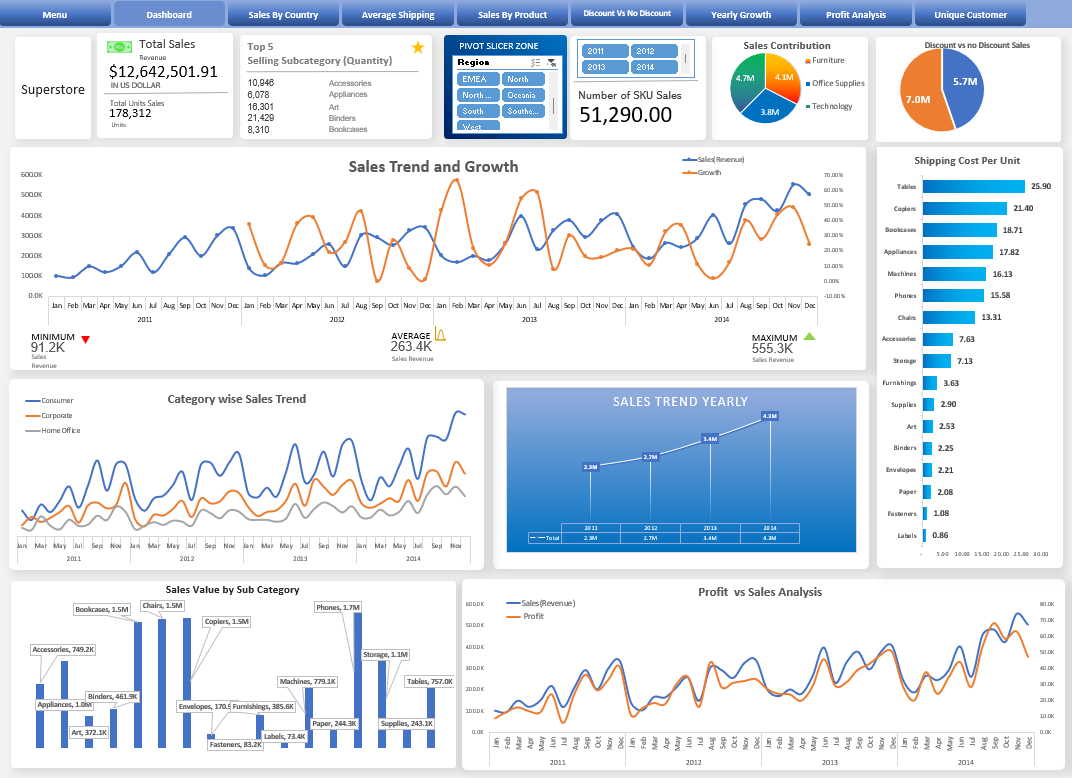
Super Store Sales Dashboard in Excel Best For Practice purpose
Comprehensive sales insights, trends, and performance metrics for Super Store.
Further information
**Maximize Your Sales Project Efficiency with Our Comprehensive Dashboard**
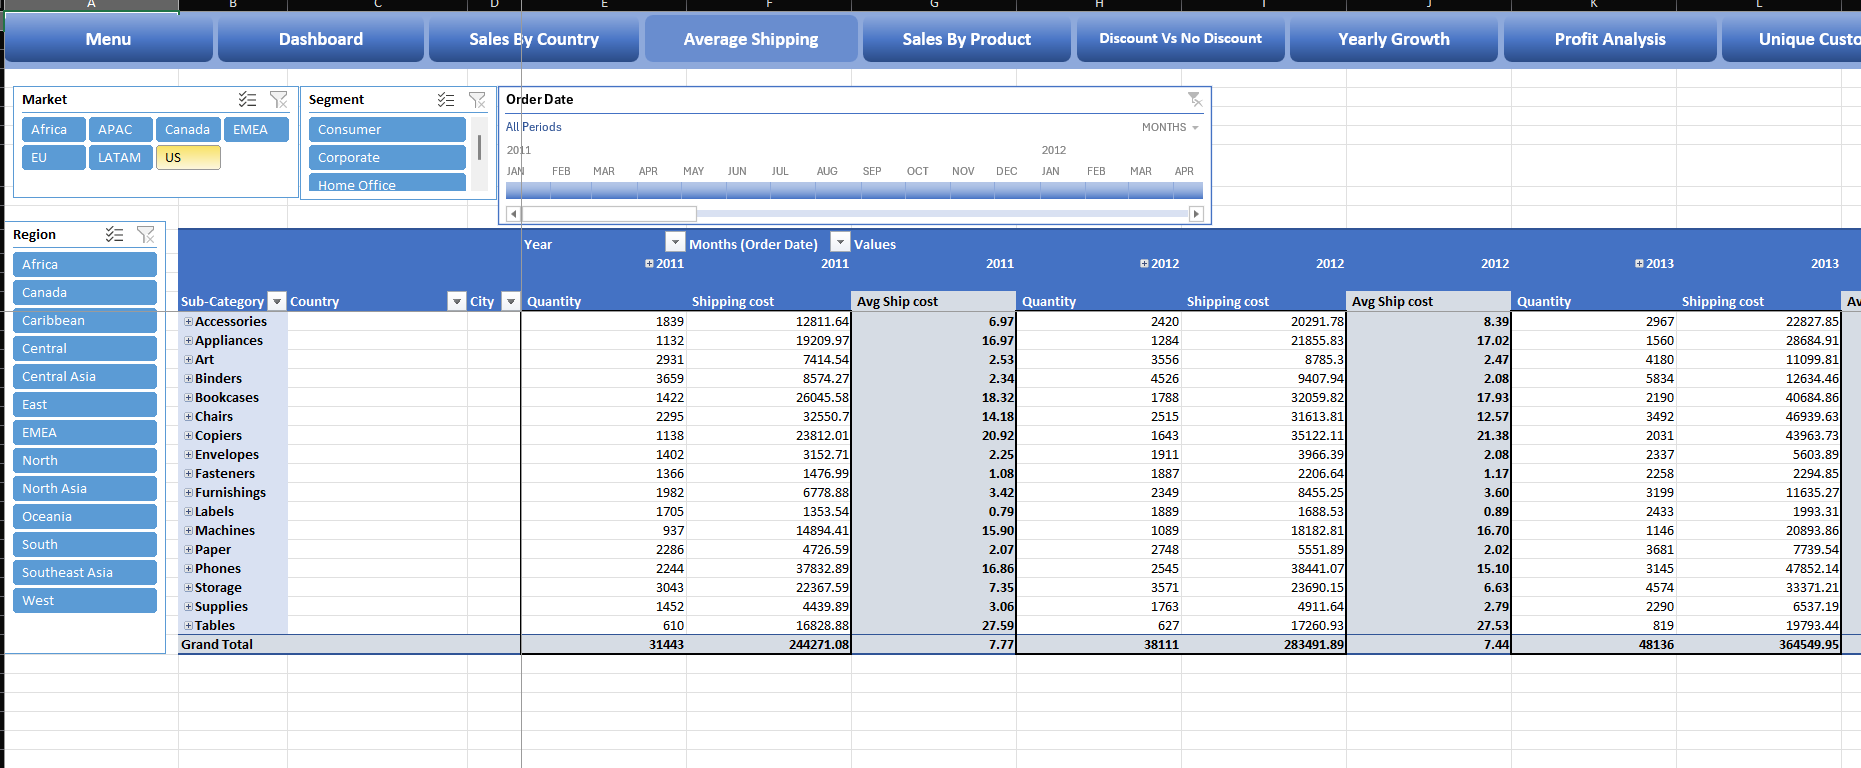
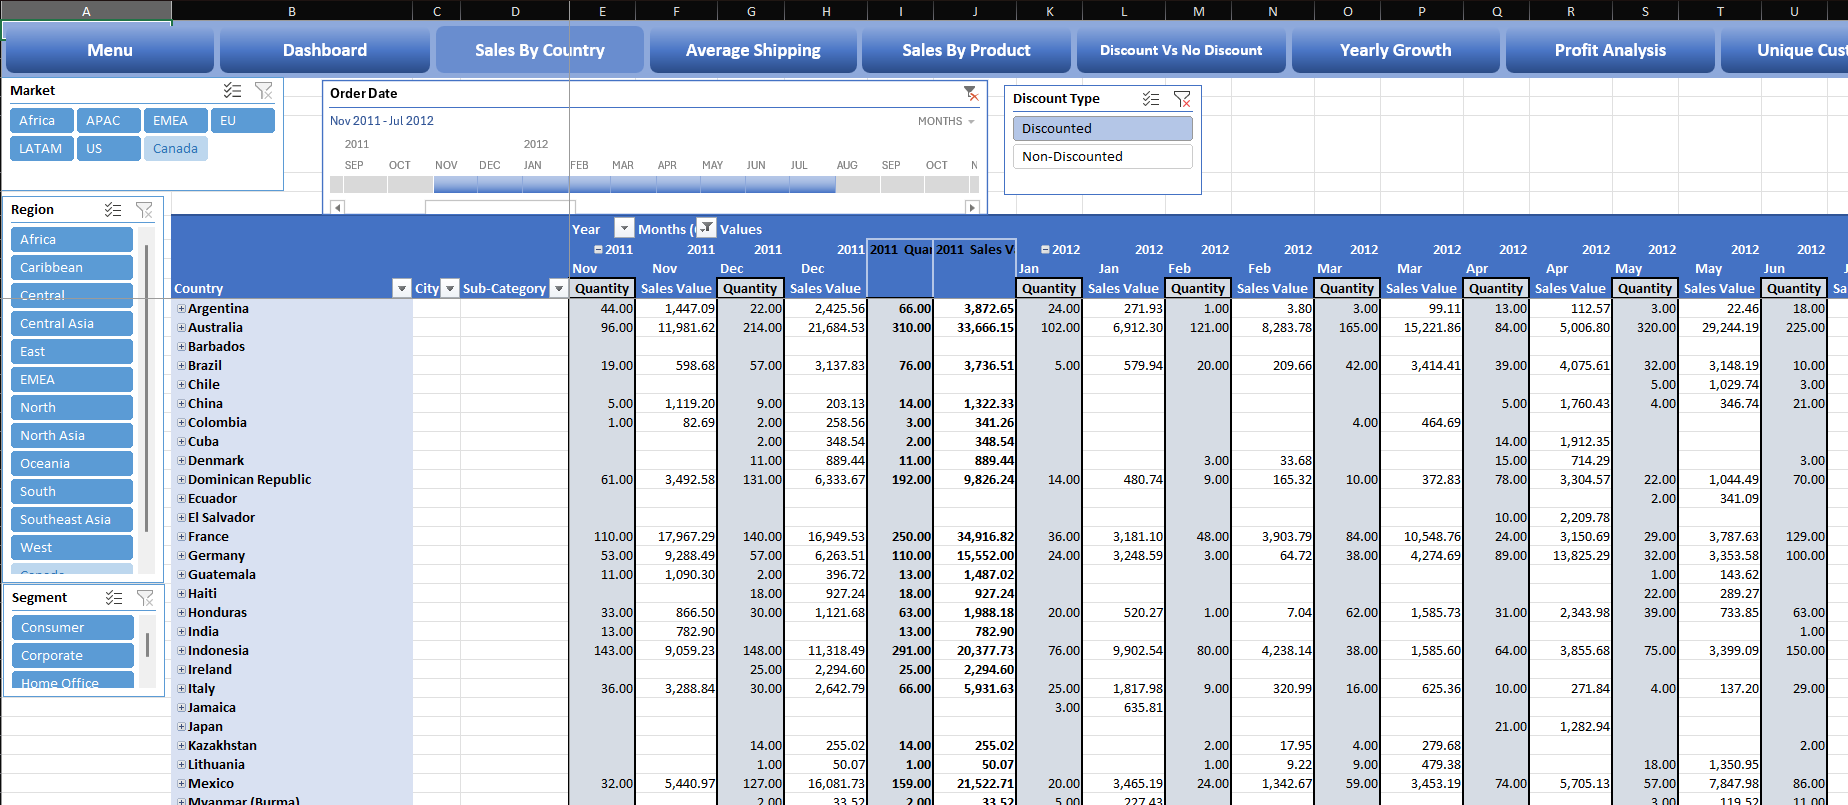
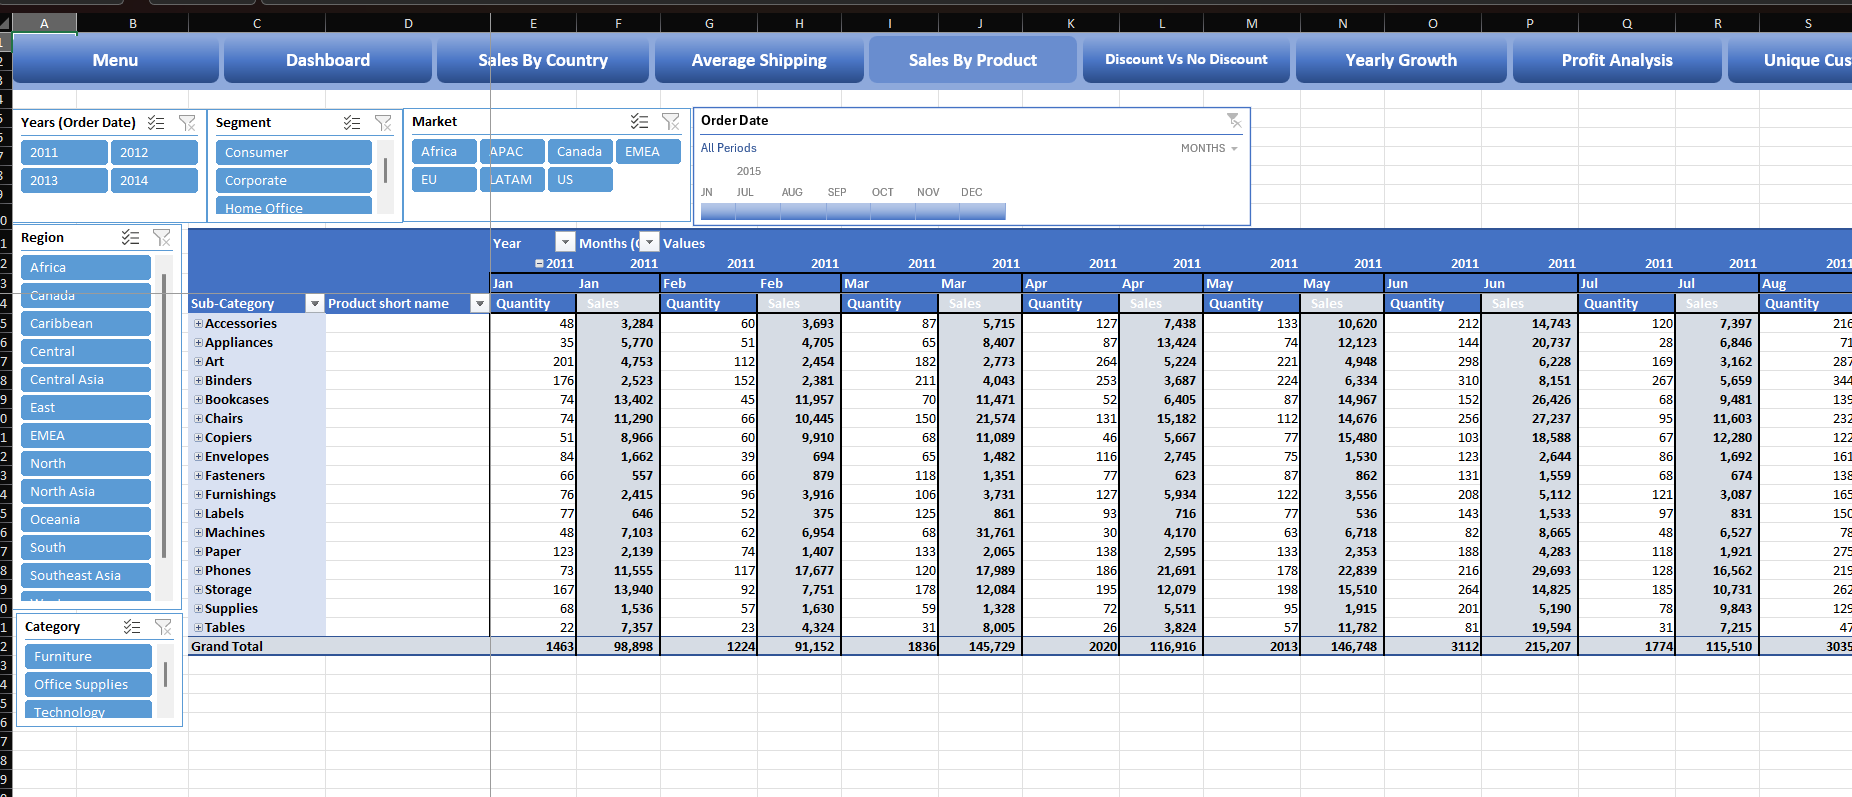
Utilize this file to enhance your sales project by leveraging detailed insights into sales performance, customer behavior, and profitability. This dashboard provides the best practices for analyzing sales data, optimizing discount strategies, tracking yearly growth, and improving shipping efficiency. Empower your decision-making process with actionable data and drive your sales project to success.
