


Publication number: ELQ-26181-1
View all versions & Certificate

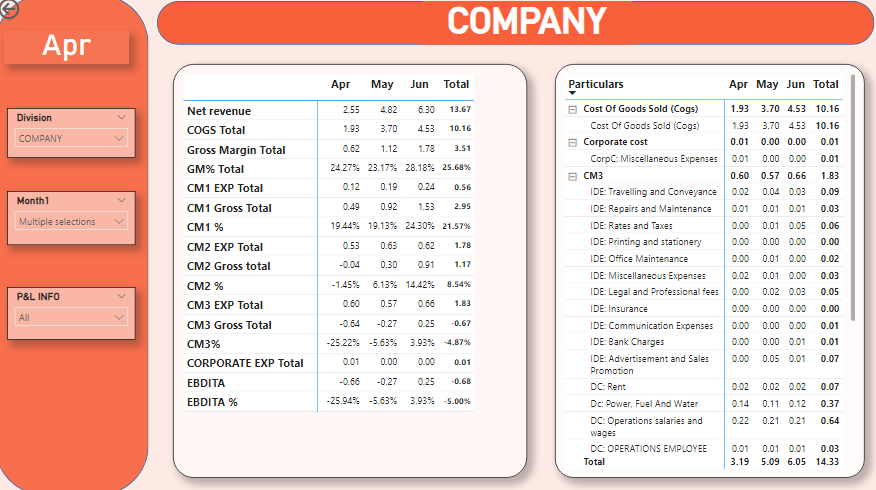
SAP to P&L Statement: PowerBi Visual Magic
Transform raw SAP trial balances into captivating P&L visuals with PowerBI. Dive into intuitive, AI-enhanced templates that appeal to the human love for visuals
Orchestrate Financial Performance ||Budget Business Planner || Leadership||Financial Controller ||Follow
Further information
Our goal is to revolutionize financial data interaction, making it not just accessible but also intuitive, insightful, and actionable.
Simplicity & Clarity: Present complex financial data in an organized manner
Customization: Allow users to filter and focus on specific profit centers such as Company, Engineering, Dehydrated Products, and Retail, adapting to their unique analytical needs.
Temporal Analysis: Enable easy month-by-month comparisons, granting users the ability to track financial trends and make timely decisions.
Expense Oversight: Provide real-time insights into expenses, empowering users to adjust and control as necessary.
Informed Decision Making: Through a combination of raw data and visual representations, equip users with the tools they need to navigate their financial landscape with confidence and clarity.
Users must have PowerBI Desktop installed to access and interact with the dashboard.
SAP software is required to source the raw data for analysis and visualization.
You have to change the path of the file in accordance with your excel sheet path-
Open Your PowerBI Report:
Launch PowerBI Desktop.
Open the .pbix file that's connected to the Excel file.
Access Data Source Settings:
In the PowerBI Desktop ribbon, click on the 'Home' tab.
Click on 'Transform data' or 'Edit Queries' (the exact wording might vary based on your PowerBI version).
Navigate to Source Settings:
Once the Query Editor window opens, go to the 'Home' tab.
Click on 'Data Source Settings'.
Change Source Path:
In the 'Data Source Settings' window, you'll see a list of data sources used in your report. Find the Excel file you want to change.
With the Excel file selected, click on the 'Change Source' button.
Update the File Path:
In the 'Change Source' window, you'll see the current file path. Click on the 'Browse' button to navigate to the new location of your Excel file.
Select the Excel file in its new location and click 'Open'.
Apply Changes:
Click 'OK' to close the 'Change Source' window.
Click 'Close' to exit the 'Data Source Settings' window.
Back in the Query Editor, click 'Close & Apply' to apply the changes to your report.
Refresh Data:
Once back in the main PowerBI Desktop window, click on the 'Refresh' button to reload the data from the Excel file's new location.
