

Originally published: 25/05/2023 09:15
Last version published: 21/06/2023 08:21
Publication number: ELQ-72961-2
View all versions & Certificate
Last version published: 21/06/2023 08:21
Publication number: ELQ-72961-2
View all versions & Certificate

Private School Financial Model - 10+ Year DCF & Valuation
A financial model for a private school business serves as a comprehensive tool to forecast and analyze the financial performance of the institution.
Description
A financial model for a private school business serves as a comprehensive tool to forecast and analyze the financial performance of the institution. It incorporates various assumptions, variables, and metrics to generate projected financial statements and evaluate the school's income, expenses, profitability, and cash flow.
The financial model is a dynamic and robust tool designed to provide a clear understanding of financial performance. It incorporates key assumptions, variables, and metrics to generate detailed projections of revenue, expenses, profitability, and cash flow.
Key Components of the Financial Model:
Student Enrollment and Tuition: The financial model accounts for projected student enrollment. It also incorporates tuition rates and payment terms to estimate the school's revenue from tuition fees.
Other Revenue Sources: In addition to tuition fees, the financial model considers other sources of revenue, such as fundraising events. These revenue streams are included in the model to provide a comprehensive picture of the school's income.
Operational Expenses: The model captures various expenses, including staff salaries and benefits, facility maintenance and utilities, teaching materials and supplies, administrative costs, marketing expenses, and others. It allows us to analyze cost drivers and optimize expenditures.
Financial Aid and Scholarships: The financial model incorporates scholarships, accounting for the estimated amount of assistance provided to eligible students. This helps us evaluate the impact of these programs on revenue and expenses.
Capital Expenditures: As a private school, we may have capital expenditures related to facility expansion, equipment purchases, technology upgrades, or infrastructure improvements. The financial model factors in these investments and their associated costs to assess their impact on the financial position.
Financial Statements: The financial model generates projected financial statements, including the income statement, balance sheet, and cash flow statement. These statements provide a comprehensive overview of financial performance, position, and liquidity.
Benefits of the Financial Model:
Financial Planning and Budgeting: The financial model serves as a basis for financial planning and budgeting. It helps us set realistic targets, allocate resources efficiently, and monitor progress towards financial objectives.
Resource Allocation: The financial model assists in making strategic decisions regarding resource allocation. It helps us prioritize investments, and optimize operations for sustainable growth.
Fundraising and Investor Communication: The financial model enhances the ability to communicate financial projections and performance to potential donors, investors, or lenders. It demonstrates financial understanding and supports fundraising efforts.
Risk Management: By incorporating different scenarios and stress-testing assumptions, the financial model allows us to identify and mitigate potential risks. It helps us plan contingencies and make informed decisions to ensure financial resilience.
In conclusion, the financial model is a valuable tool that enables us to forecast and analyze the financial performance of a private school business. It provides us with insights, supports decision making, and helps us achieve financial objectives while ensuring the long-term sustainability of the school.
----------------------------------------------------------------------------------------------
MODEL GUIDELINES
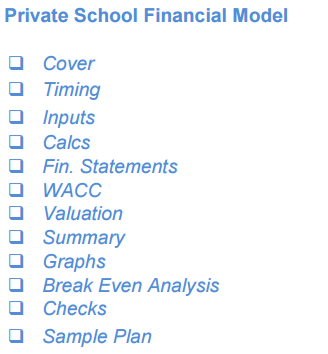
So, a quick overview of the model, in the contents tab you can see the structure of the model and by clicking on any of the headlines to be redirected to the relevant worksheet.
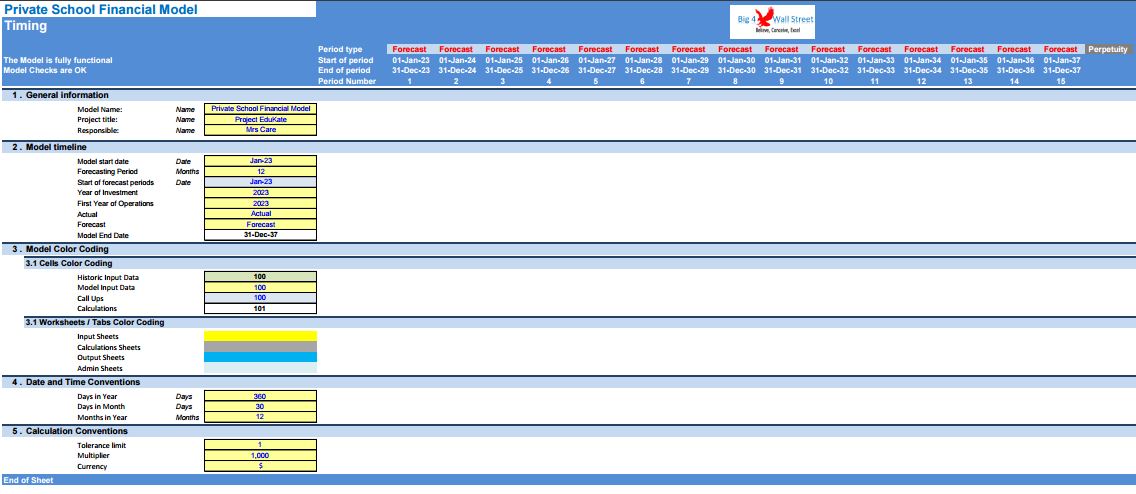
On the manual tab you can feed the general information for the model such as: project name & title, responsible, timeline of the model and date and currency conventions.
Additionally, there is a description of the color coding of the model in the same tab. Inputs are always depicted with a yellow fill and blue letters, call up (that is direct links from other cells) are filled in light blue with blue letters while calculations are depicted with white fill and black characters.
There is also color coding for the various tabs of the model. Yellow tabs are mostly assumptions tabs, grey tabs are calculations tabs, blue tabs are outputs tabs (that is effectively results or graphs) and finally light blue tabs are admin tabs (for example: the cover page, contents, and checks).
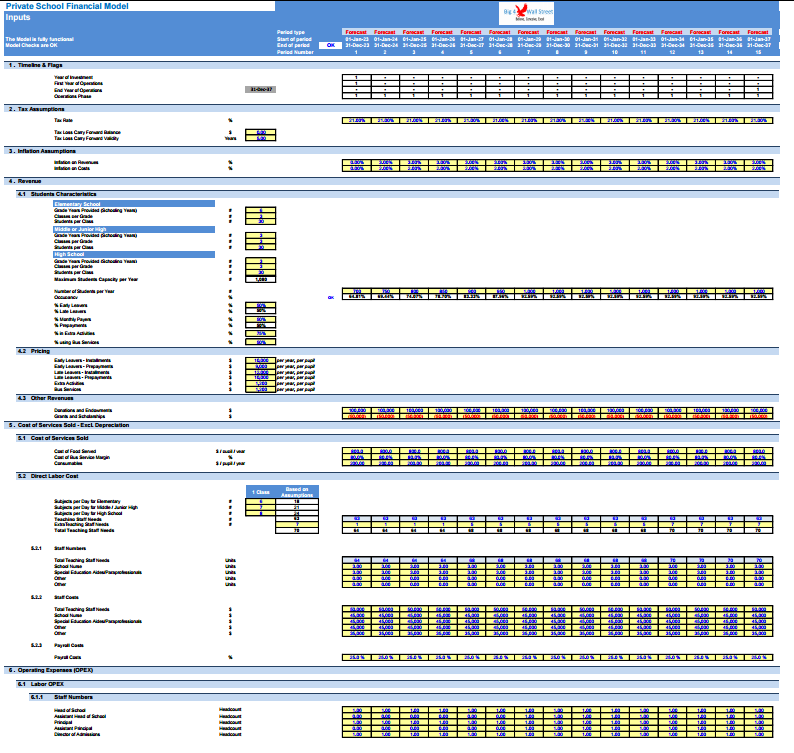
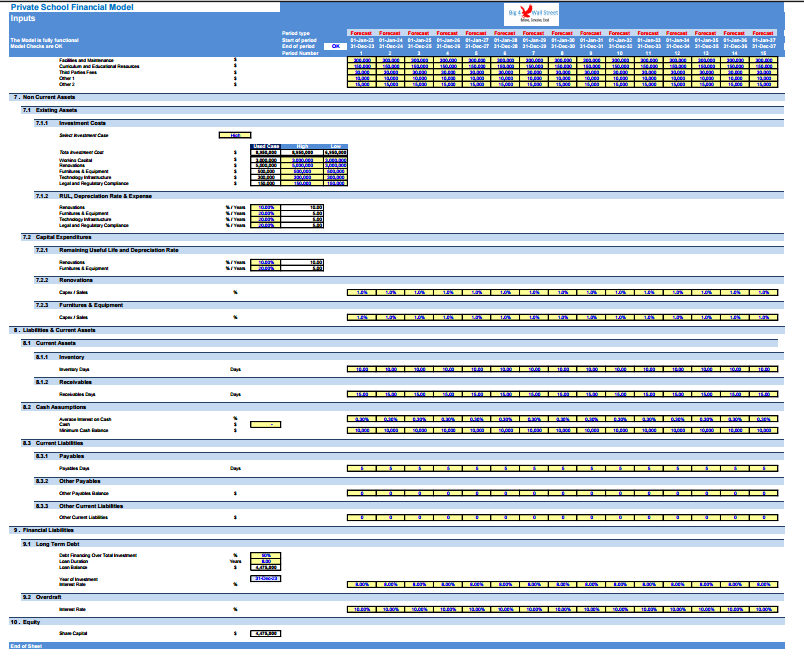
Moving on to the Inputs, in this tab, the user needs to adjust the business drivers in the yellow cells. The revenue drivers consist of the number of students and their characteristics, including pricing and payment patterns. The costs to support the revenue drivers of the business are split into cost of services sold and oeprating expenses. Other drivers include receivables days, payable days, inventory days and income tax. Additional assumptions include depreciation period in years (for both the initial investment and subsequent capital expenditures), debt gearing, interest on loans (term loan, overdraft), and share capital.
Calculations: this is where all calculations are performed. The revenues are calculated based on the previous inputs and the growth rates, and by deducting the operating costs, the operating profit is resulting. Based on the assets financed and the gearing of the financing the interest and depreciation are occurring. By using the working capital assumptions, the impact of the business cycle is presented. Finally, depending on the existing debt financing and forecast assumptions the loan balances are calculated (Term loan, overdraft).
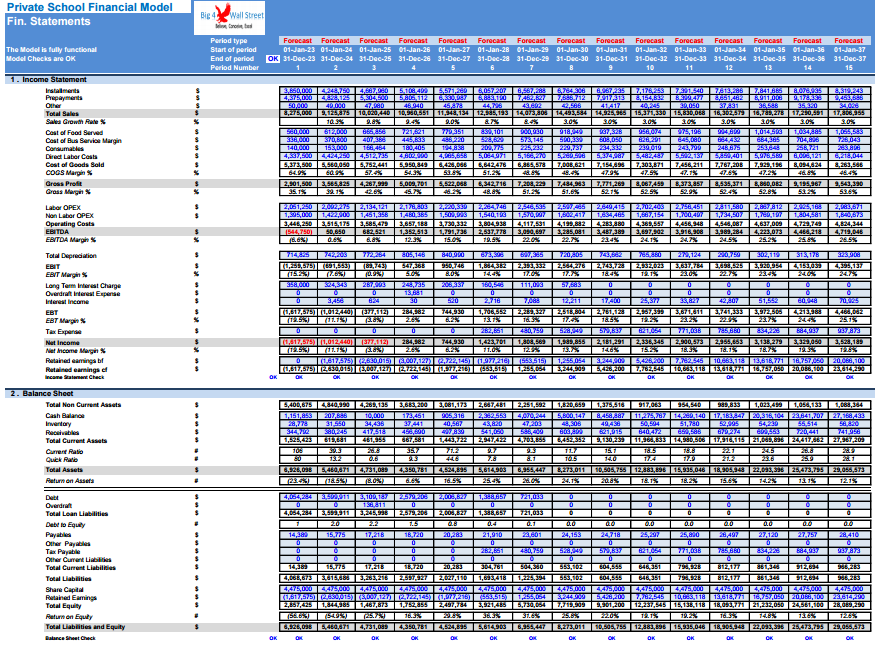
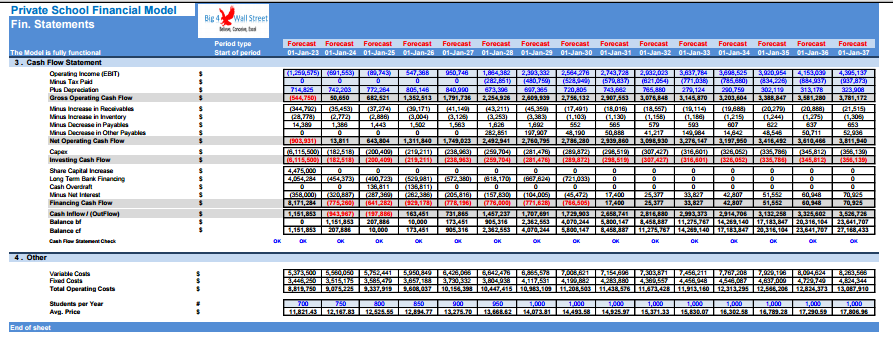
In the Financial Statements tab: everything is aggregated here into the relevant statements: profit and loss, balance sheet and cash flow on a yearly basis.
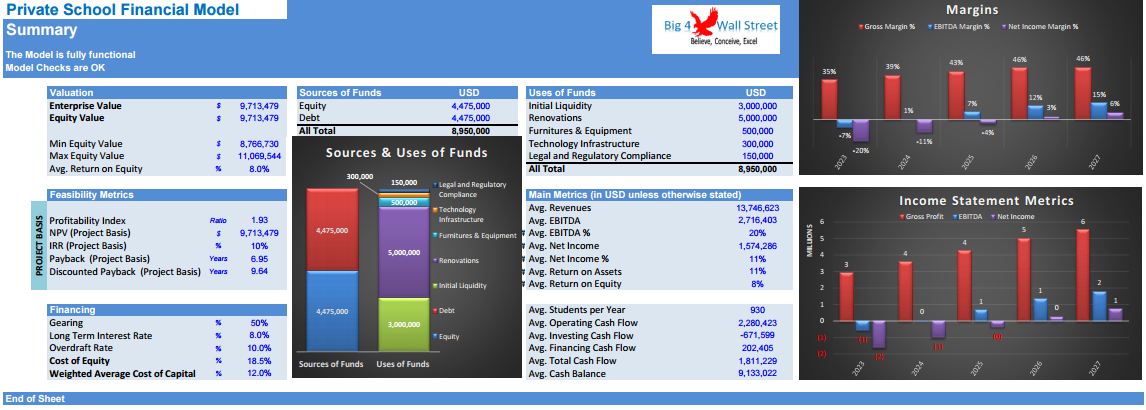
In the summary tab you are able to see a high-level report with the main financial ratios. It can be readily printed on one page for your convenience.
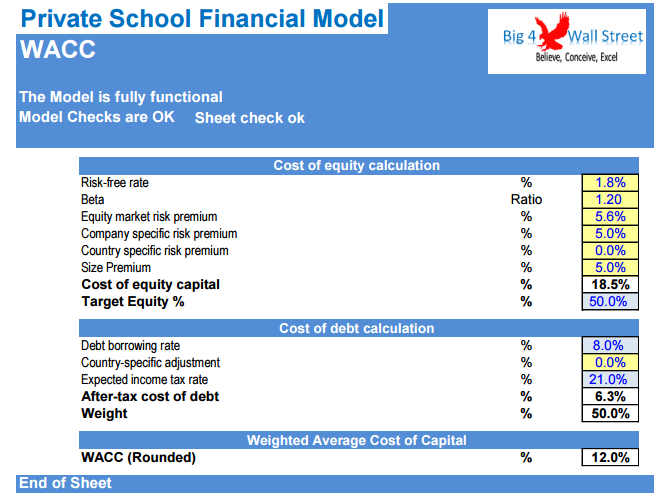
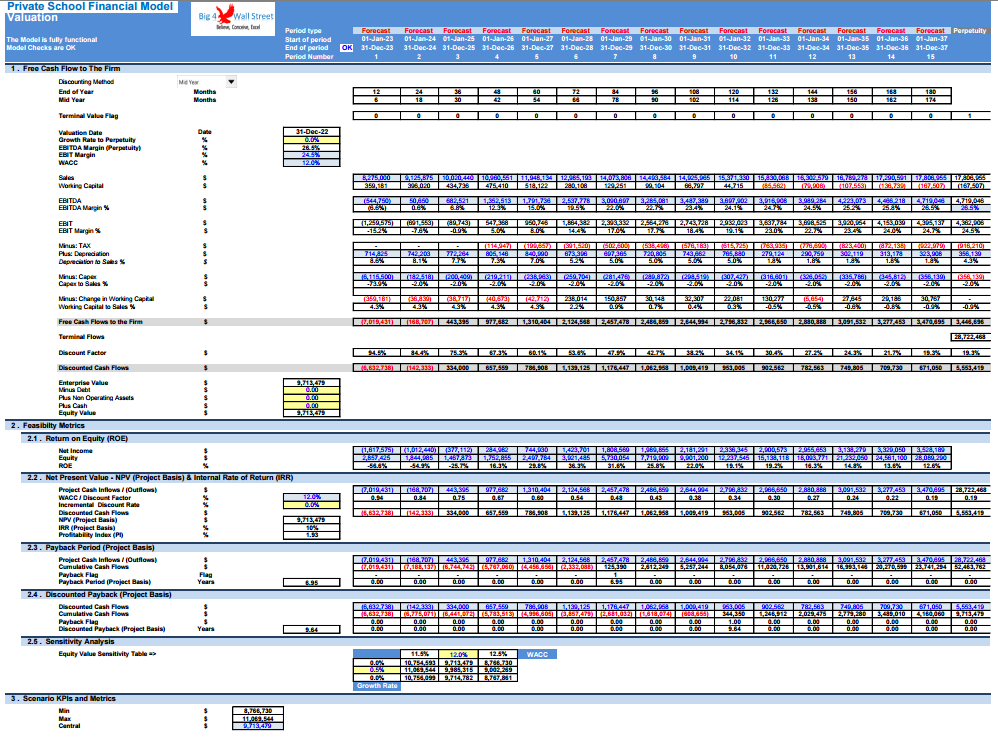
Moving to the Valuation tab, a free cash flow to the firm valuation is performed leading to an enterprise value. There is also a calculation of the Net Present Value, as well as an Internal Rate of Return, Profitability Index, Payback and Discounted Payback Period. Additionally, a sensitivity analysis is performed on the equity value of the business by using the discount rate and the growth rate to perpetuity as sensitivity parameters.
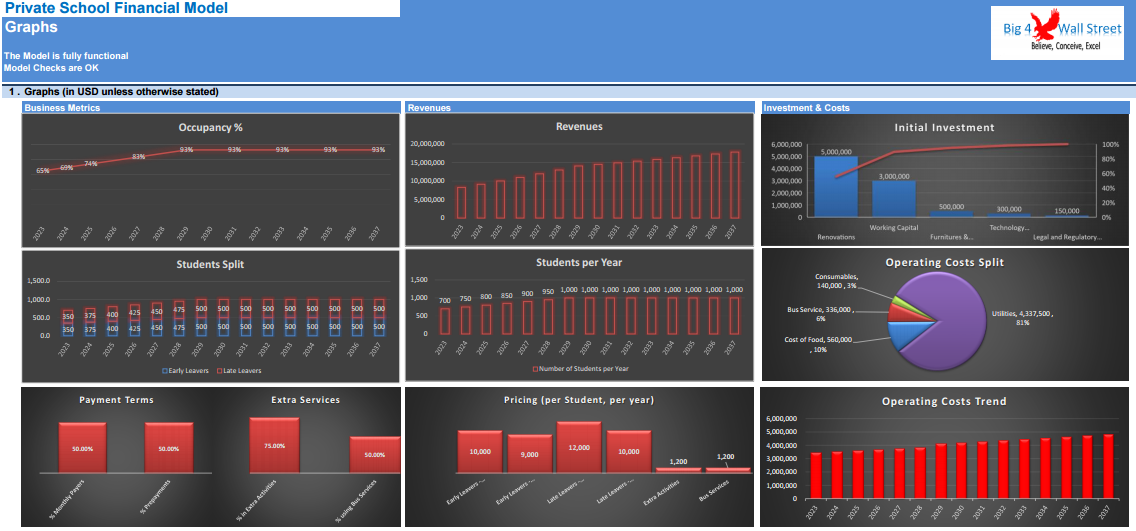
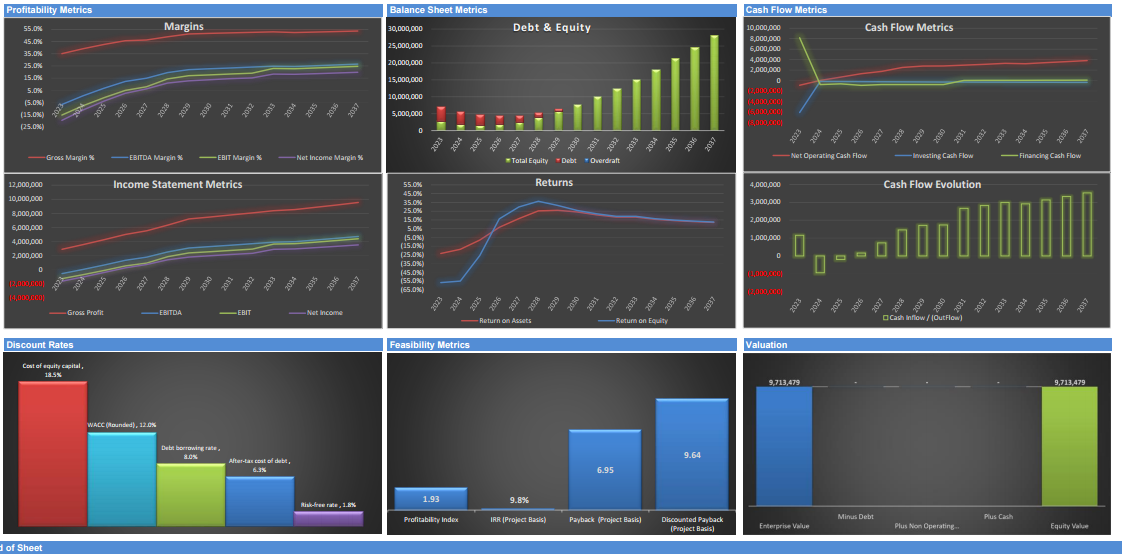
In the Graphs tab: Various graphs present the business metrics, revenues, investment & operating expenses, profitability metrics, additionally balance sheet and cash flow metrics, and we finish with discount rates, feasibility metrics and valuation graphs.
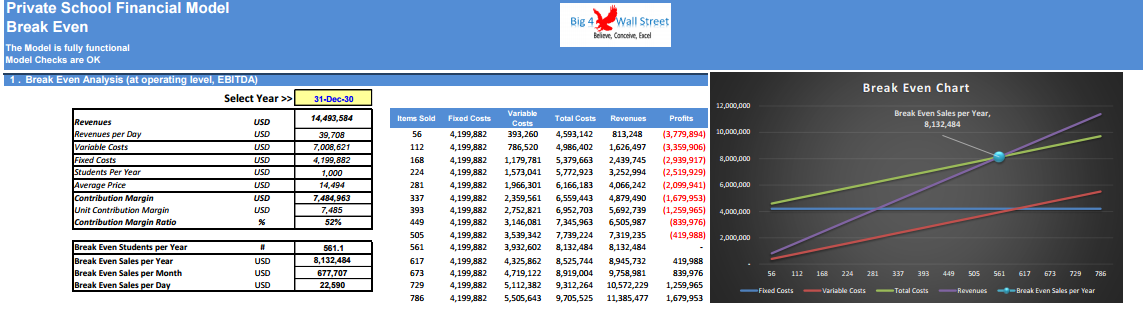
In the Break-Even tab, you can find a break-even analysis and see how many students and sales you need to break even at an operational level.
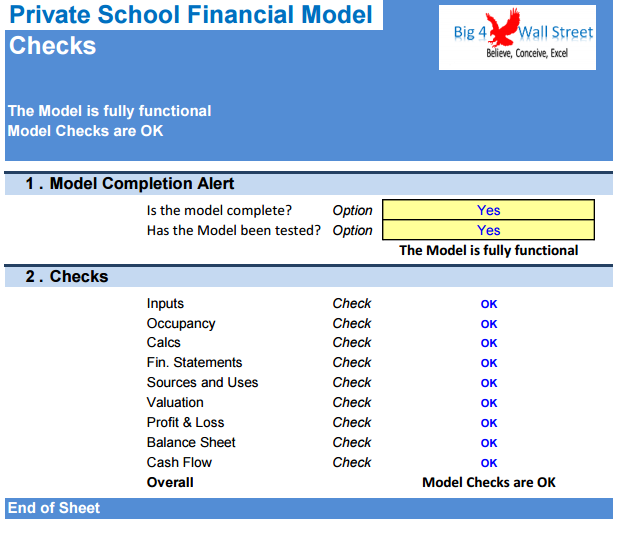
Checks: A dedicated worksheet that makes sure that everything is working as it should!
Important Notice: Yellow indicates inputs and assumptions that the user can change, blue cells are used for called up cells, and white cells with black characters indicates calculation cells.
A financial model for a private school business serves as a comprehensive tool to forecast and analyze the financial performance of the institution. It incorporates various assumptions, variables, and metrics to generate projected financial statements and evaluate the school's income, expenses, profitability, and cash flow.
The financial model is a dynamic and robust tool designed to provide a clear understanding of financial performance. It incorporates key assumptions, variables, and metrics to generate detailed projections of revenue, expenses, profitability, and cash flow.
Key Components of the Financial Model:
Student Enrollment and Tuition: The financial model accounts for projected student enrollment. It also incorporates tuition rates and payment terms to estimate the school's revenue from tuition fees.
Other Revenue Sources: In addition to tuition fees, the financial model considers other sources of revenue, such as fundraising events. These revenue streams are included in the model to provide a comprehensive picture of the school's income.
Operational Expenses: The model captures various expenses, including staff salaries and benefits, facility maintenance and utilities, teaching materials and supplies, administrative costs, marketing expenses, and others. It allows us to analyze cost drivers and optimize expenditures.
Financial Aid and Scholarships: The financial model incorporates scholarships, accounting for the estimated amount of assistance provided to eligible students. This helps us evaluate the impact of these programs on revenue and expenses.
Capital Expenditures: As a private school, we may have capital expenditures related to facility expansion, equipment purchases, technology upgrades, or infrastructure improvements. The financial model factors in these investments and their associated costs to assess their impact on the financial position.
Financial Statements: The financial model generates projected financial statements, including the income statement, balance sheet, and cash flow statement. These statements provide a comprehensive overview of financial performance, position, and liquidity.
Benefits of the Financial Model:
Financial Planning and Budgeting: The financial model serves as a basis for financial planning and budgeting. It helps us set realistic targets, allocate resources efficiently, and monitor progress towards financial objectives.
Resource Allocation: The financial model assists in making strategic decisions regarding resource allocation. It helps us prioritize investments, and optimize operations for sustainable growth.
Fundraising and Investor Communication: The financial model enhances the ability to communicate financial projections and performance to potential donors, investors, or lenders. It demonstrates financial understanding and supports fundraising efforts.
Risk Management: By incorporating different scenarios and stress-testing assumptions, the financial model allows us to identify and mitigate potential risks. It helps us plan contingencies and make informed decisions to ensure financial resilience.
In conclusion, the financial model is a valuable tool that enables us to forecast and analyze the financial performance of a private school business. It provides us with insights, supports decision making, and helps us achieve financial objectives while ensuring the long-term sustainability of the school.
----------------------------------------------------------------------------------------------
MODEL GUIDELINES
So, a quick overview of the model, in the contents tab you can see the structure of the model and by clicking on any of the headlines to be redirected to the relevant worksheet.
On the manual tab you can feed the general information for the model such as: project name & title, responsible, timeline of the model and date and currency conventions.
Additionally, there is a description of the color coding of the model in the same tab. Inputs are always depicted with a yellow fill and blue letters, call up (that is direct links from other cells) are filled in light blue with blue letters while calculations are depicted with white fill and black characters.
There is also color coding for the various tabs of the model. Yellow tabs are mostly assumptions tabs, grey tabs are calculations tabs, blue tabs are outputs tabs (that is effectively results or graphs) and finally light blue tabs are admin tabs (for example: the cover page, contents, and checks).
Moving on to the Inputs, in this tab, the user needs to adjust the business drivers in the yellow cells. The revenue drivers consist of the number of students and their characteristics, including pricing and payment patterns. The costs to support the revenue drivers of the business are split into cost of services sold and oeprating expenses. Other drivers include receivables days, payable days, inventory days and income tax. Additional assumptions include depreciation period in years (for both the initial investment and subsequent capital expenditures), debt gearing, interest on loans (term loan, overdraft), and share capital.
Calculations: this is where all calculations are performed. The revenues are calculated based on the previous inputs and the growth rates, and by deducting the operating costs, the operating profit is resulting. Based on the assets financed and the gearing of the financing the interest and depreciation are occurring. By using the working capital assumptions, the impact of the business cycle is presented. Finally, depending on the existing debt financing and forecast assumptions the loan balances are calculated (Term loan, overdraft).
In the Financial Statements tab: everything is aggregated here into the relevant statements: profit and loss, balance sheet and cash flow on a yearly basis.
In the summary tab you are able to see a high-level report with the main financial ratios. It can be readily printed on one page for your convenience.
Moving to the Valuation tab, a free cash flow to the firm valuation is performed leading to an enterprise value. There is also a calculation of the Net Present Value, as well as an Internal Rate of Return, Profitability Index, Payback and Discounted Payback Period. Additionally, a sensitivity analysis is performed on the equity value of the business by using the discount rate and the growth rate to perpetuity as sensitivity parameters.
In the Graphs tab: Various graphs present the business metrics, revenues, investment & operating expenses, profitability metrics, additionally balance sheet and cash flow metrics, and we finish with discount rates, feasibility metrics and valuation graphs.
In the Break-Even tab, you can find a break-even analysis and see how many students and sales you need to break even at an operational level.
Checks: A dedicated worksheet that makes sure that everything is working as it should!
Important Notice: Yellow indicates inputs and assumptions that the user can change, blue cells are used for called up cells, and white cells with black characters indicates calculation cells.
This Best Practice includes
1 Excel
