Originally published: 12/01/2023 09:15
Last version published: 13/03/2024 14:50
Publication number: ELQ-95766-2
View all versions & Certificate
Last version published: 13/03/2024 14:50
Publication number: ELQ-95766-2
View all versions & Certificate

0.0 / 5 (0 votes)
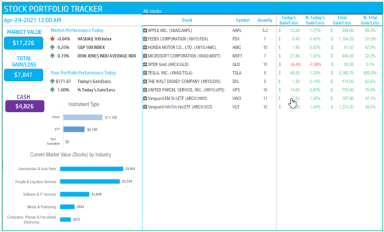
Stock Portfolio Tracker Excel Template
by Indzara
Version 1 (Original Version): 12/01/2023 09:15 GMT
Version 2 (Current Version): 13/03/2024 14:50 GMT
Publication Number: ELQ-95766-2
