

Originally published: 10/10/2022 08:28
Publication number: ELQ-36133-1
View all versions & Certificate
Publication number: ELQ-36133-1
View all versions & Certificate

Solar Energy Excel Financial Model
This Solar Energy Excel Financial Model template is a handy yet dynamic financial plan for solar energy business that provides you a financial management tool.
Our mission is to be the industrial leader and pioneer in our business domainFollow 17
solar energysolar energy financial modelexcel modelstatement financial modeltemplateexcel templatefinancial model
Description
Our Solar Energy Excel Financial Model is designed to help you make informed principal business and financial decisions based on accurate reporting. This Solar Energy Excel Financial Model excel template contains all relevant inputs and tables.
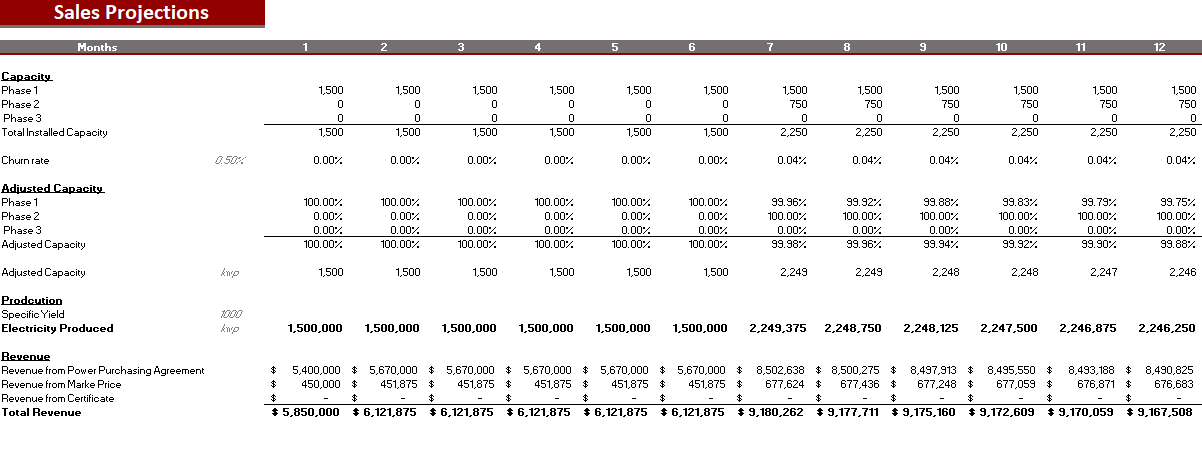
The Solar Energy Financial Model template forecasts the 60 - month financial statements for your Solar Energy Farm project and calculates revenue and energy production capacity. The objective of this model is to provide you an optimal financial plan to support fundraising plans, improve your startup plan, and enable you and your potential investors to acknowledge a deep knowledge of how the economics of your online business works.
This Solar Energy Financial Model Template made by an Oak Business Consultant has a 5-year financial model, with detailed cash-ins and out analysis, and an IRR analysis and DCF valuation for your company. This excel template enables you to gauge how much investment you require to start a solar farm business and, by taking into account several input assumptions, whether the operation itself is likely to bring in sufficient revenue. Moreover, this financial model is handy and easy to use; you wouldn’t require any specific sound financial knowledge to understand this model; by having a minimal understanding of business financials, you can efficiently use it.
Similar Business Model
Topaz Solar Farm, Solar Star, and First Solar Inc, etc.
Key Features of Solar Excel Financial Model
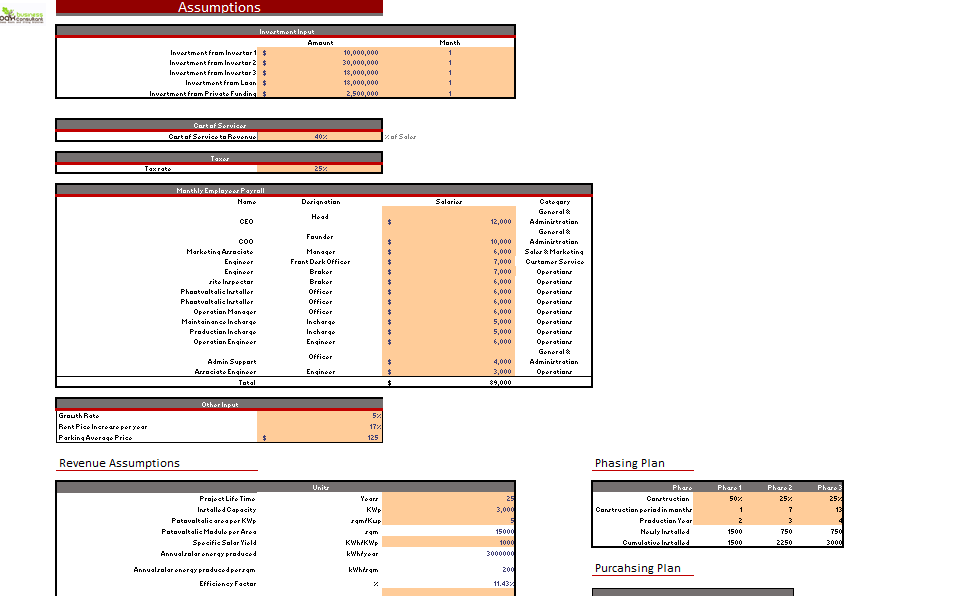
Input Sheet
The model contains inputs that, when changed, impact the calculations and, therefore, the changes are applied to all relevant sheets. Since our financial model always has built-in flexibility, it displays different outcomes or final calculations based on changing a few key inputs.
Startup Summary
This sheet provides you and your investors an analysis of all the investment requirements of a new start-up and helps the business to present a snapshot of the company to prospective investors and help to raise capital.
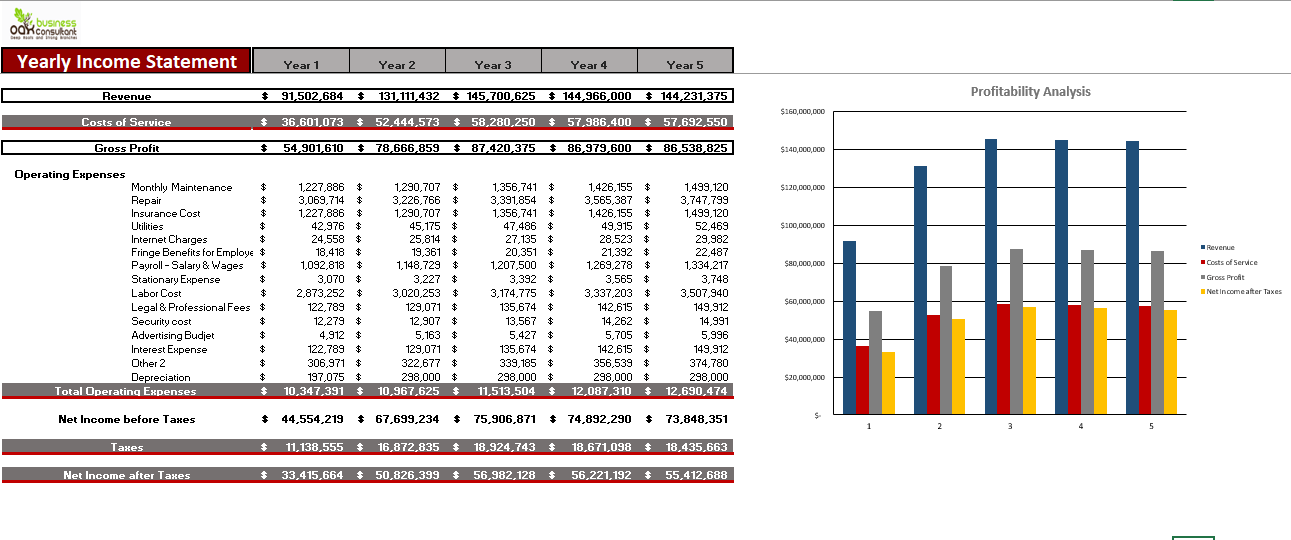
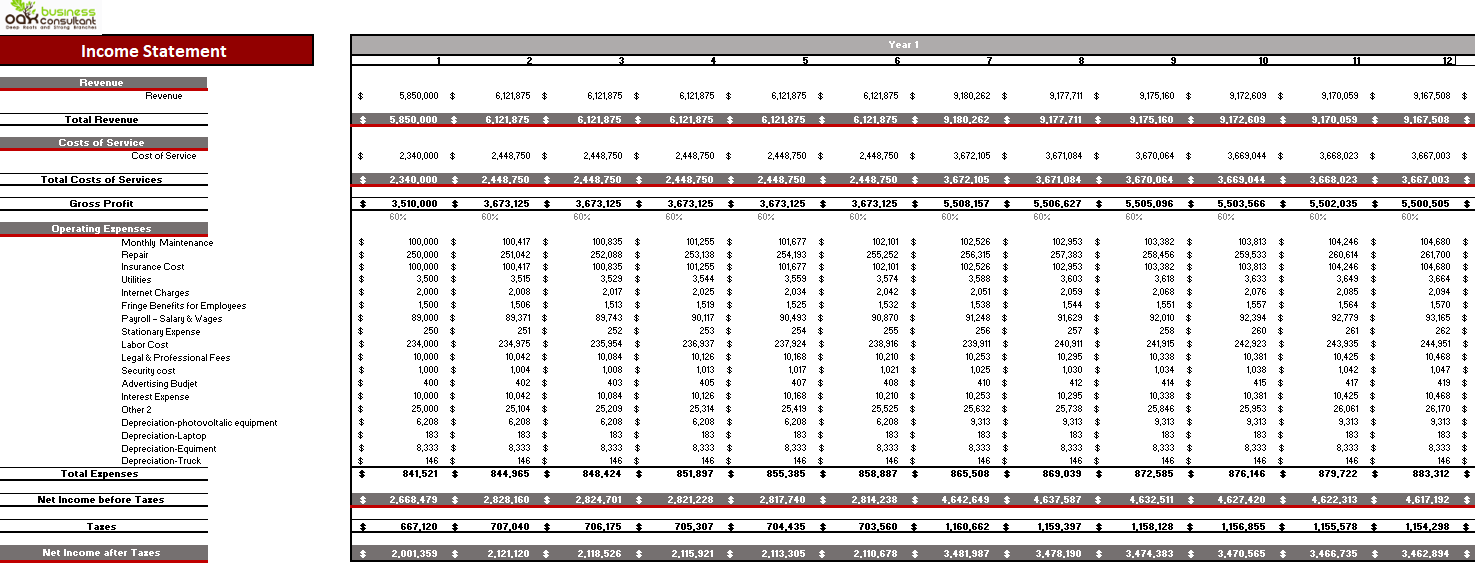
Monthly & Yearly Income Statement
The monthly Income Statement sheet of the Solar Power Project Excel Financial Model is perfect for those who require regular reporting and details. Additionally, Income Statement contains all revenue streamlines with gross earnings, net earnings linked with revenue analysis to ensure accurate reporting. We understand the goal of every business, is to make a profit for that there must be a mechanism that helps the business owners to determine whether they are making profits or otherwise.
Furthermore, the Yearly Income Statement gives you complete insights into revenue and general & administrative expenses. The Yearly Income Statement also contains several graphs, assumptions, ratios, margins, net profit, earnings, cost of services, and profit after tax.
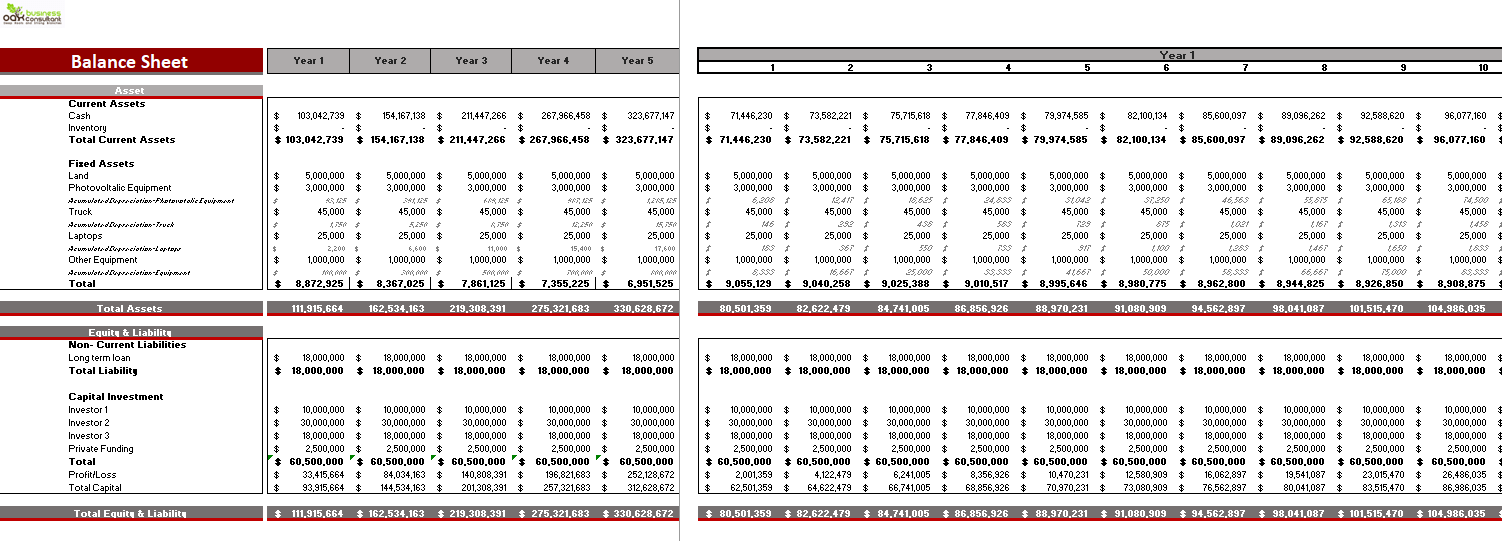
Balance Sheet
This balance sheet enables you to analyze your position of current assets, fixed assets, liabilities, and equity. This also allows you to monitor your accounts receivable, accounts payable, accrued expenses, etc. Therefore this model gives you the perfect space to analyze your key financial balance accounts.
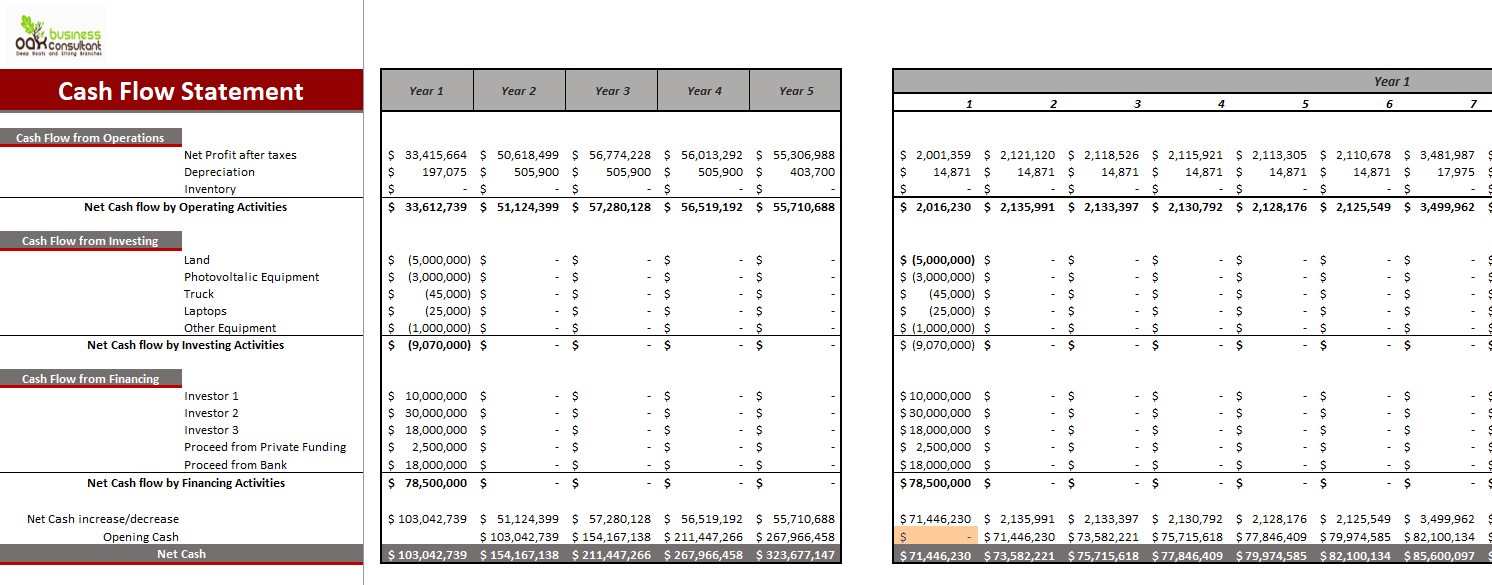
Cash Flow Statement
This sheet also contains a dedicated sheet to monitor and analyze your company cash-ins and out. This cash flow statement is based on several key inputs, such as Payable and Receivable Days, yearly income, working capital, long-term debt, net cash, etc. This calculation is then used to compute your net cash flow, beginning, and end cash balances. This is a perfect template for modeling your cash flow analysis.
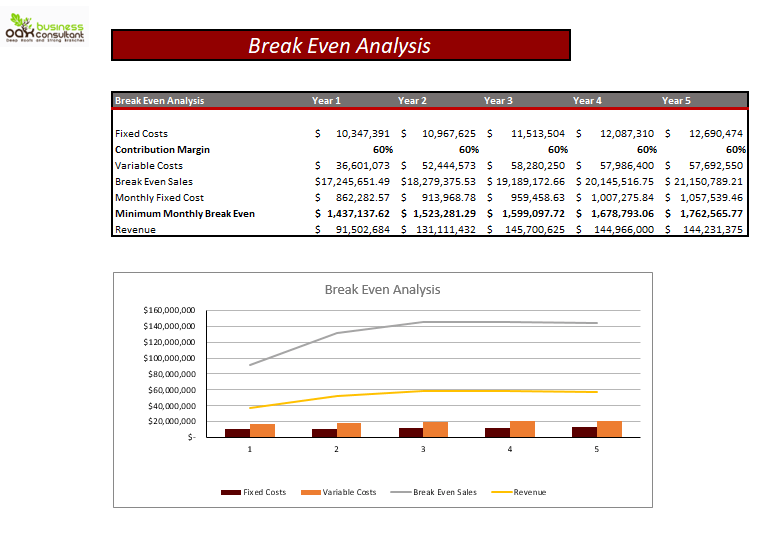
Break-Even Analysis
The break-even analysis will help you to know at a glance the profits generated at the various levels of sales. The safety margin refers to the extent to which the business can afford a decline before it starts incurring losses. The Break-Even Analysis refers to the point where your total sales contribution refers to fixed cost at zero profit and loss situation. This Technique primarily based on marginal costing which behaves differently at a variety of levels of output activity.
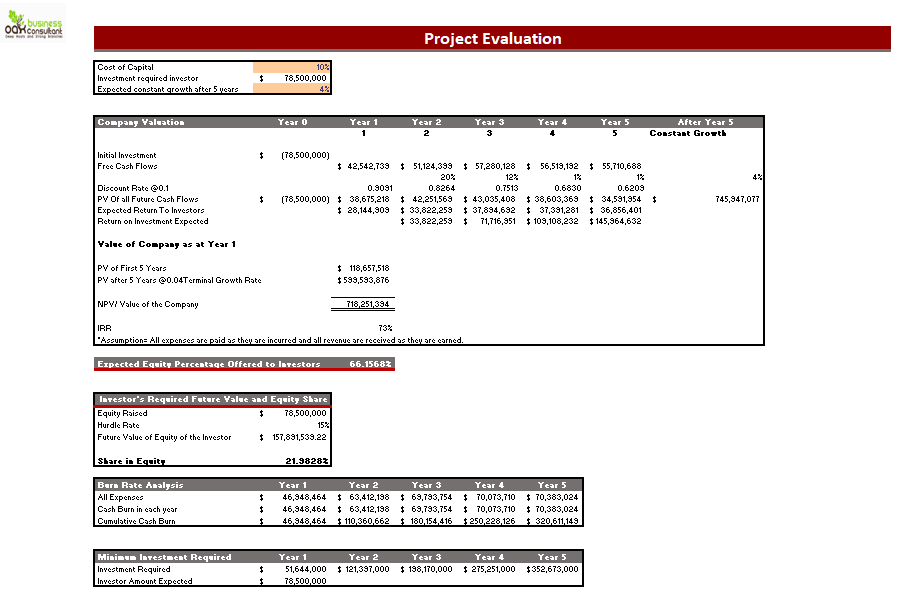
Project Evaluation
Since the table calculates Return on Investment, Investor’s Future Equity Share and Cash Burn Rate Analysis. Therefore, analyzing the performance of the company becomes easy to capture potential investors.
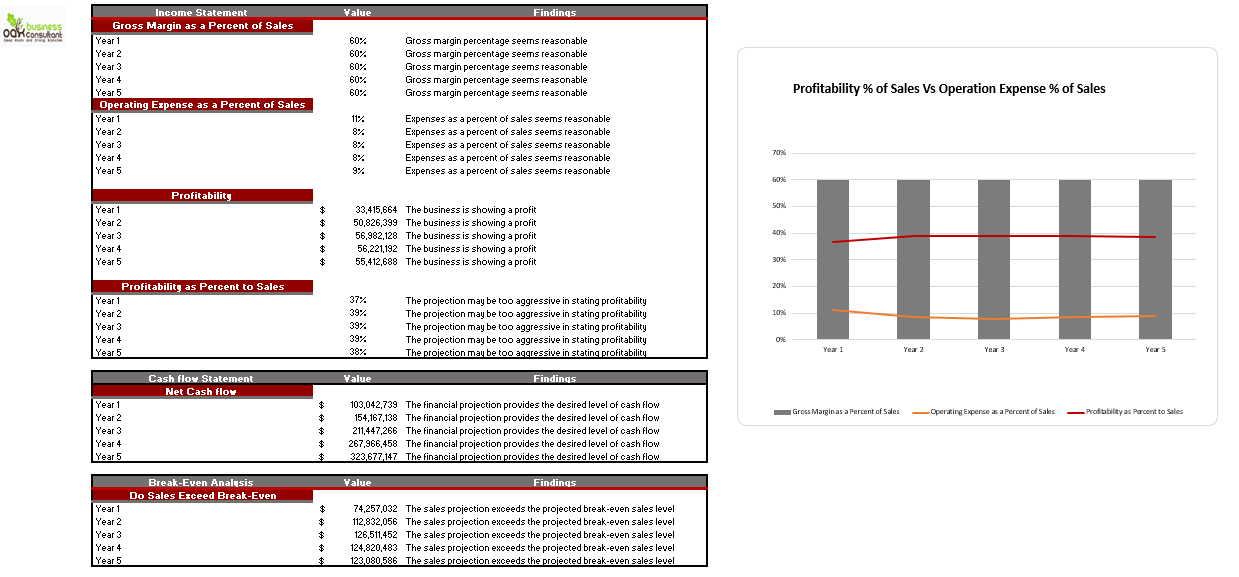
Diagnostic Sheet
This Diagnostic sheet automatically calculates the data such as the Profitability ratio, Net operating expense ratio to expense, etc., that will provide financial commentary about the company’s financials.
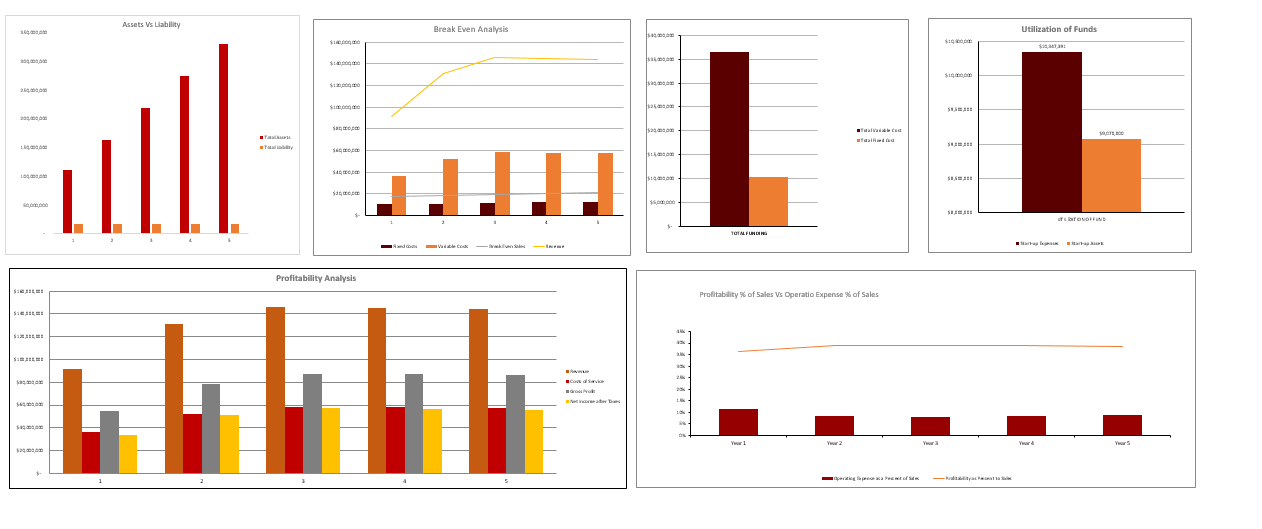
Dashboard
Users and readers respond and process visual graphs better than data. Furthermore, This dashboard provides you a graphical management tool that enables you to track all your relevant financial KPIs. It will also improve cash management, and allow you to track expenses, sales, and net revenue in detail. Allowing you to meet and outperform the financial objectives of your online business.
The Benefits of the Solar Energy Excel Financial Model
Save Money & Time
This Financial Model excel template enables you to begin your startup planning with the least fuss and maximum help. No composing equations and formulas, no designing, no programming, no outlining, and no costly outside specialists required. You can focus on developing your business strategies while the model makes forecasting simpler and faster.
Easy To Use
Easy-to-use yet very advanced financial planning tool. Whatever size and phase of development your business is, with a very little amount of planning experience and a very basic command of Excel, you can get complete and reliable outcomes.
Understand the Viability of Each Single Item
You are presumably speaking to a few item classes or a few choices for your primary item. Our Solar Energy Excel Financial Model will assist you in sorting out various item choices and gatherings. It will give you an option to dissect and comprehend which one brings enormous benefits compared to others. You will have the alternative of sharing the business gauge for multiple items and assessing the cost of goods sold, including the price of items themselves, their stockpiling, work, and other overhead expenses.
Graphical Visualization
In this financial model excel template, all necessary Calculations and estimation are visually represented on a dashboard. You don’t need to move sheets to compare data.
Our Solar Energy Excel Financial Model is designed to help you make informed principal business and financial decisions based on accurate reporting. This Solar Energy Excel Financial Model excel template contains all relevant inputs and tables.
The Solar Energy Financial Model template forecasts the 60 - month financial statements for your Solar Energy Farm project and calculates revenue and energy production capacity. The objective of this model is to provide you an optimal financial plan to support fundraising plans, improve your startup plan, and enable you and your potential investors to acknowledge a deep knowledge of how the economics of your online business works.
This Solar Energy Financial Model Template made by an Oak Business Consultant has a 5-year financial model, with detailed cash-ins and out analysis, and an IRR analysis and DCF valuation for your company. This excel template enables you to gauge how much investment you require to start a solar farm business and, by taking into account several input assumptions, whether the operation itself is likely to bring in sufficient revenue. Moreover, this financial model is handy and easy to use; you wouldn’t require any specific sound financial knowledge to understand this model; by having a minimal understanding of business financials, you can efficiently use it.
Similar Business Model
Topaz Solar Farm, Solar Star, and First Solar Inc, etc.
Key Features of Solar Excel Financial Model
Input Sheet
The model contains inputs that, when changed, impact the calculations and, therefore, the changes are applied to all relevant sheets. Since our financial model always has built-in flexibility, it displays different outcomes or final calculations based on changing a few key inputs.
Startup Summary
This sheet provides you and your investors an analysis of all the investment requirements of a new start-up and helps the business to present a snapshot of the company to prospective investors and help to raise capital.
Monthly & Yearly Income Statement
The monthly Income Statement sheet of the Solar Power Project Excel Financial Model is perfect for those who require regular reporting and details. Additionally, Income Statement contains all revenue streamlines with gross earnings, net earnings linked with revenue analysis to ensure accurate reporting. We understand the goal of every business, is to make a profit for that there must be a mechanism that helps the business owners to determine whether they are making profits or otherwise.
Furthermore, the Yearly Income Statement gives you complete insights into revenue and general & administrative expenses. The Yearly Income Statement also contains several graphs, assumptions, ratios, margins, net profit, earnings, cost of services, and profit after tax.
Balance Sheet
This balance sheet enables you to analyze your position of current assets, fixed assets, liabilities, and equity. This also allows you to monitor your accounts receivable, accounts payable, accrued expenses, etc. Therefore this model gives you the perfect space to analyze your key financial balance accounts.
Cash Flow Statement
This sheet also contains a dedicated sheet to monitor and analyze your company cash-ins and out. This cash flow statement is based on several key inputs, such as Payable and Receivable Days, yearly income, working capital, long-term debt, net cash, etc. This calculation is then used to compute your net cash flow, beginning, and end cash balances. This is a perfect template for modeling your cash flow analysis.
Break-Even Analysis
The break-even analysis will help you to know at a glance the profits generated at the various levels of sales. The safety margin refers to the extent to which the business can afford a decline before it starts incurring losses. The Break-Even Analysis refers to the point where your total sales contribution refers to fixed cost at zero profit and loss situation. This Technique primarily based on marginal costing which behaves differently at a variety of levels of output activity.
Project Evaluation
Since the table calculates Return on Investment, Investor’s Future Equity Share and Cash Burn Rate Analysis. Therefore, analyzing the performance of the company becomes easy to capture potential investors.
Diagnostic Sheet
This Diagnostic sheet automatically calculates the data such as the Profitability ratio, Net operating expense ratio to expense, etc., that will provide financial commentary about the company’s financials.
Dashboard
Users and readers respond and process visual graphs better than data. Furthermore, This dashboard provides you a graphical management tool that enables you to track all your relevant financial KPIs. It will also improve cash management, and allow you to track expenses, sales, and net revenue in detail. Allowing you to meet and outperform the financial objectives of your online business.
The Benefits of the Solar Energy Excel Financial Model
Save Money & Time
This Financial Model excel template enables you to begin your startup planning with the least fuss and maximum help. No composing equations and formulas, no designing, no programming, no outlining, and no costly outside specialists required. You can focus on developing your business strategies while the model makes forecasting simpler and faster.
Easy To Use
Easy-to-use yet very advanced financial planning tool. Whatever size and phase of development your business is, with a very little amount of planning experience and a very basic command of Excel, you can get complete and reliable outcomes.
Understand the Viability of Each Single Item
You are presumably speaking to a few item classes or a few choices for your primary item. Our Solar Energy Excel Financial Model will assist you in sorting out various item choices and gatherings. It will give you an option to dissect and comprehend which one brings enormous benefits compared to others. You will have the alternative of sharing the business gauge for multiple items and assessing the cost of goods sold, including the price of items themselves, their stockpiling, work, and other overhead expenses.
Graphical Visualization
In this financial model excel template, all necessary Calculations and estimation are visually represented on a dashboard. You don’t need to move sheets to compare data.
This Best Practice includes
1 Excel File(12 Tabs)
