

Originally published: 15/06/2022 15:52
Publication number: ELQ-91761-1
View all versions & Certificate
Publication number: ELQ-91761-1
View all versions & Certificate

Scheduling Model in Excel
Scheduling Model consists of a model which optimizes the work schedules of employees to meet the demand of the various plants oso as to minimize payroll costs.
Description
Scheduling Model consists of a model which optimizes the work schedules of employees to meet the demand of the various plants on busy days, so as to minimize the total weekly payroll costs.
!! You need to enable macros to use the financial model!!
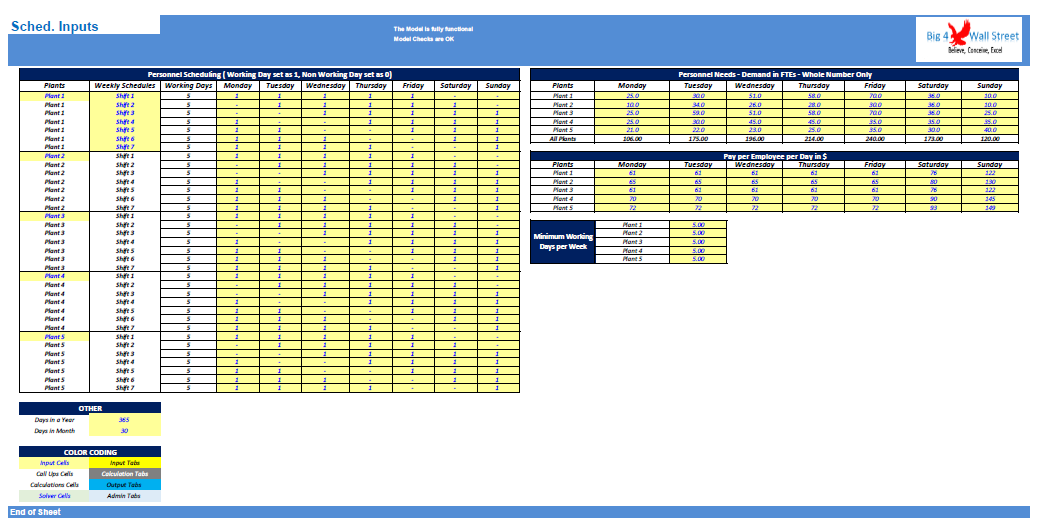
On the Inputs tab, there is a description of the color coding: Inputs are always depicted with a yellow fill and blue letters, call up (that is direct links from other cells) and calculations are depicted with white fill and black characters.
There is also a color coding for the various tabs of the model. Yellow tabs are mostly assumptions tabs, grey tabs are calculations tabs, blue tabs are outputs tabs (that is effectively results or graphs) and finally light blue tabs are admin tabs (for example: the cover page, contents, and checks).
The only tab where the user input is needed is in the Inputs tab. The user needs to fill the yellow cells in each of these tabs, all the remaining tabs are calculated automatically.
The user sets the personnel scheduling for each of the 5 plants and for each of the 7 available weekly shifts. The user can amend the shifts by selecting which days to include by inputting 1, and which days to exclude by inputting 0.
After that the user sets the daily pay per employee for each of the 7 days of the week. The pay per employee per day can be differentiated based on the location of the plant, as well as based on the day of employment. For example, Saturdays and Sundays can be increased in comparison with the other days of the week.
The user also sets the minimum personnel needs for each day of the week and for each plant, so that the model can calculate the optimal number of employees needed on a weekly basis.
Finally, the user has to set the minimum working days per week, which should be consistent with the working days per shift.
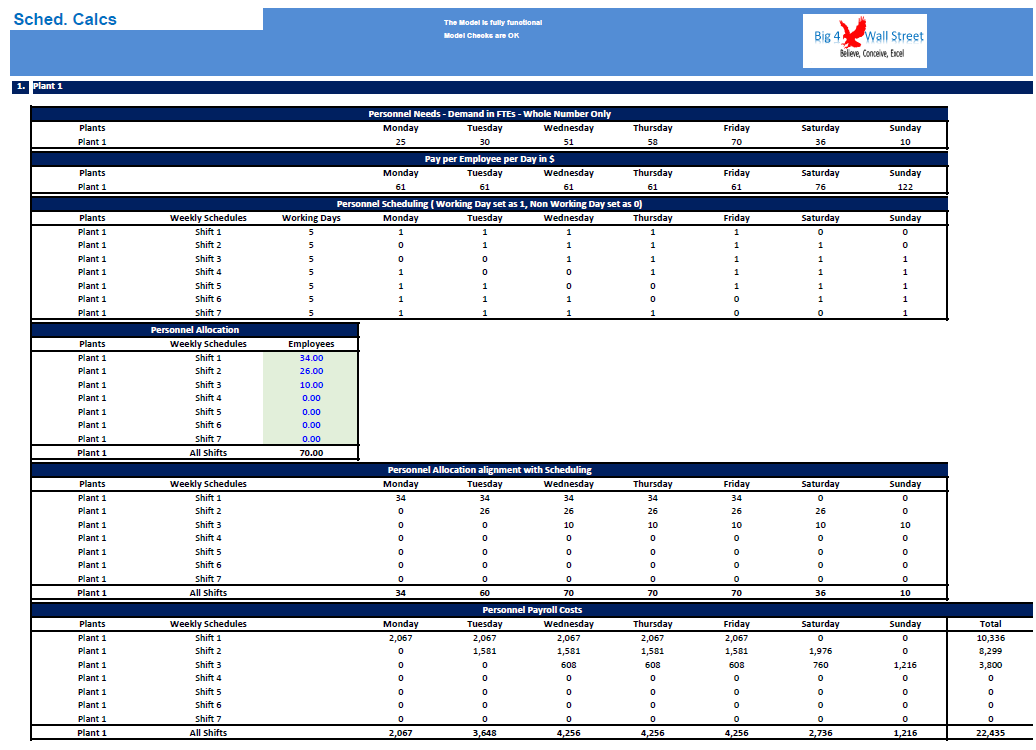
Moving to the Calcs tab the user just needs to press the Optimize Personnel Scheduling. After a while the results are calculated, and you just need to press OK.
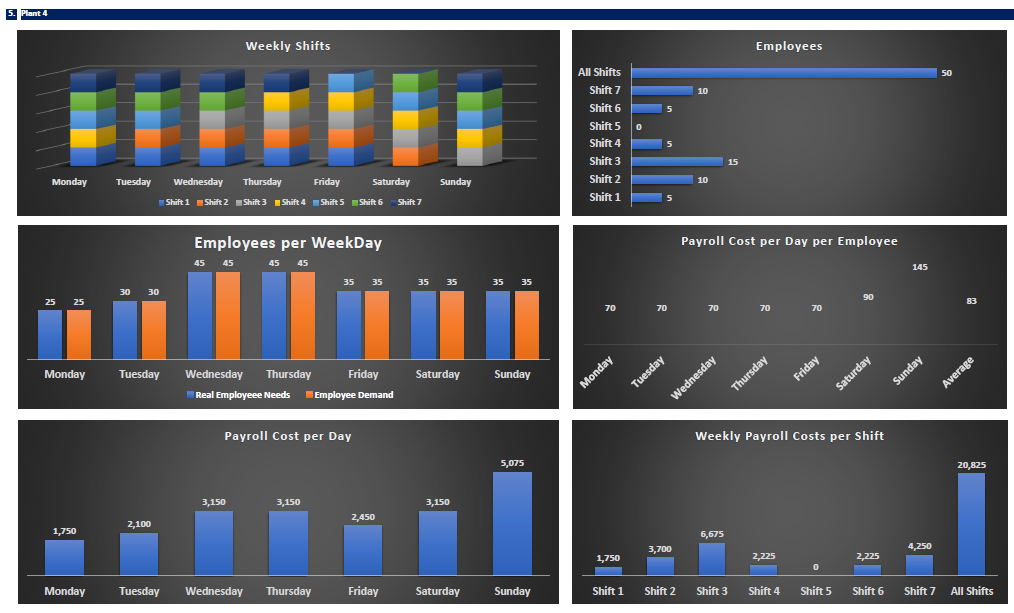
The results are presented in the Outputs tab, as the personnel per Weekday, the full-time employees per plant, the payroll cost per day per plant, and the payroll cost per day per employee.
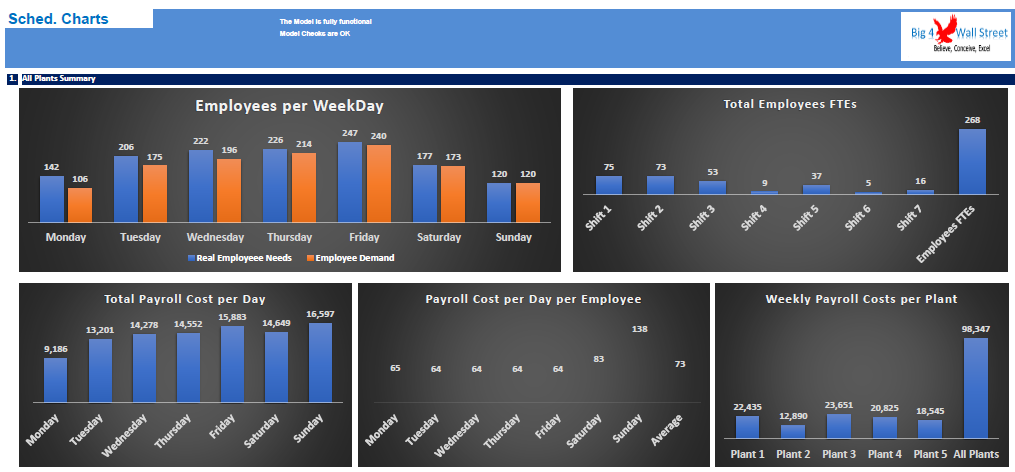
A set of graphs in the Charts tab, present graphically the shifts per weekday, the employees demand and needs per weekday, the total employees per shift, total payroll cost per day, and the weekly payroll per plant and per shift, as well as the payroll cost per day per employee.
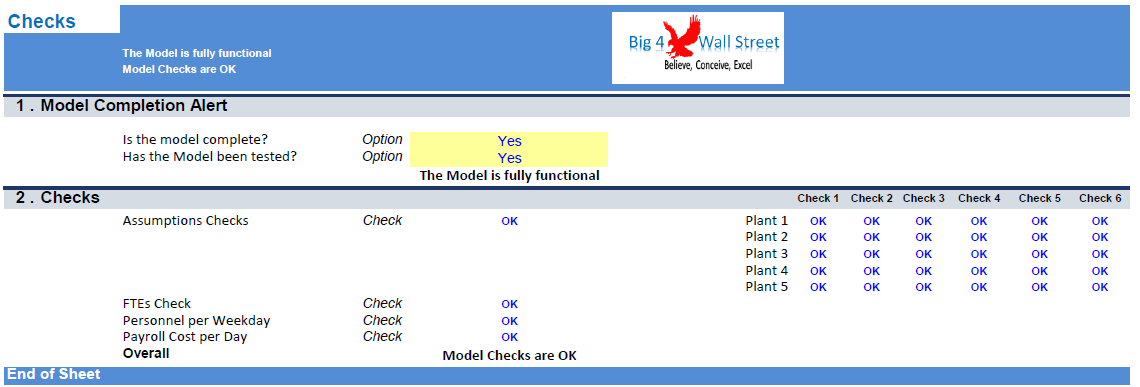
Finally, the checks tab where the most critical checks are aggregated. Whenever you see an error message in any page, you should consult this page to see where the error is coming from.
Scheduling Model consists of a model which optimizes the work schedules of employees to meet the demand of the various plants on busy days, so as to minimize the total weekly payroll costs.
!! You need to enable macros to use the financial model!!
On the Inputs tab, there is a description of the color coding: Inputs are always depicted with a yellow fill and blue letters, call up (that is direct links from other cells) and calculations are depicted with white fill and black characters.
There is also a color coding for the various tabs of the model. Yellow tabs are mostly assumptions tabs, grey tabs are calculations tabs, blue tabs are outputs tabs (that is effectively results or graphs) and finally light blue tabs are admin tabs (for example: the cover page, contents, and checks).
The only tab where the user input is needed is in the Inputs tab. The user needs to fill the yellow cells in each of these tabs, all the remaining tabs are calculated automatically.
The user sets the personnel scheduling for each of the 5 plants and for each of the 7 available weekly shifts. The user can amend the shifts by selecting which days to include by inputting 1, and which days to exclude by inputting 0.
After that the user sets the daily pay per employee for each of the 7 days of the week. The pay per employee per day can be differentiated based on the location of the plant, as well as based on the day of employment. For example, Saturdays and Sundays can be increased in comparison with the other days of the week.
The user also sets the minimum personnel needs for each day of the week and for each plant, so that the model can calculate the optimal number of employees needed on a weekly basis.
Finally, the user has to set the minimum working days per week, which should be consistent with the working days per shift.
Moving to the Calcs tab the user just needs to press the Optimize Personnel Scheduling. After a while the results are calculated, and you just need to press OK.
The results are presented in the Outputs tab, as the personnel per Weekday, the full-time employees per plant, the payroll cost per day per plant, and the payroll cost per day per employee.
A set of graphs in the Charts tab, present graphically the shifts per weekday, the employees demand and needs per weekday, the total employees per shift, total payroll cost per day, and the weekly payroll per plant and per shift, as well as the payroll cost per day per employee.
Finally, the checks tab where the most critical checks are aggregated. Whenever you see an error message in any page, you should consult this page to see where the error is coming from.
This Best Practice includes
1 Excel and 1 PDF
