
Originally published: 02/11/2022 12:09
Last version published: 03/11/2024 15:13
Publication number: ELQ-95962-4
View all versions & Certificate
Last version published: 03/11/2024 15:13
Publication number: ELQ-95962-4
View all versions & Certificate

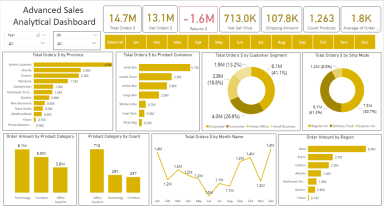
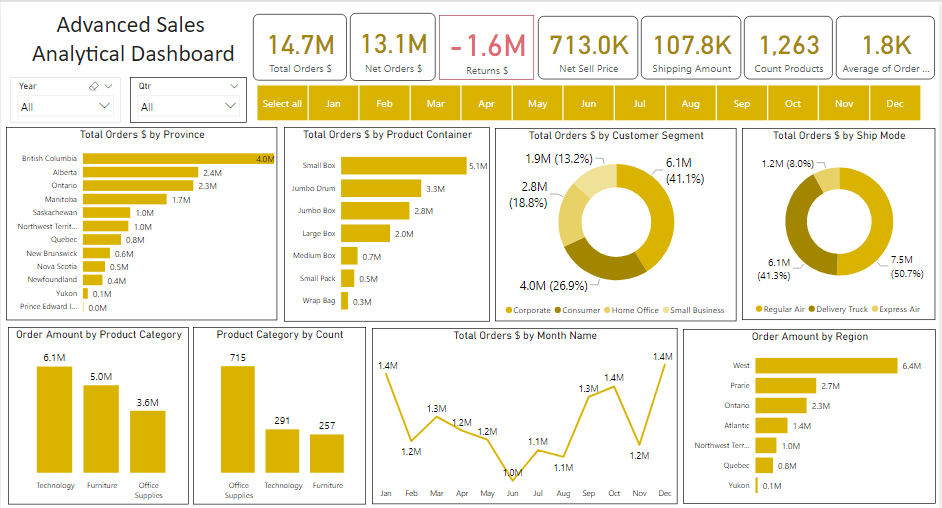
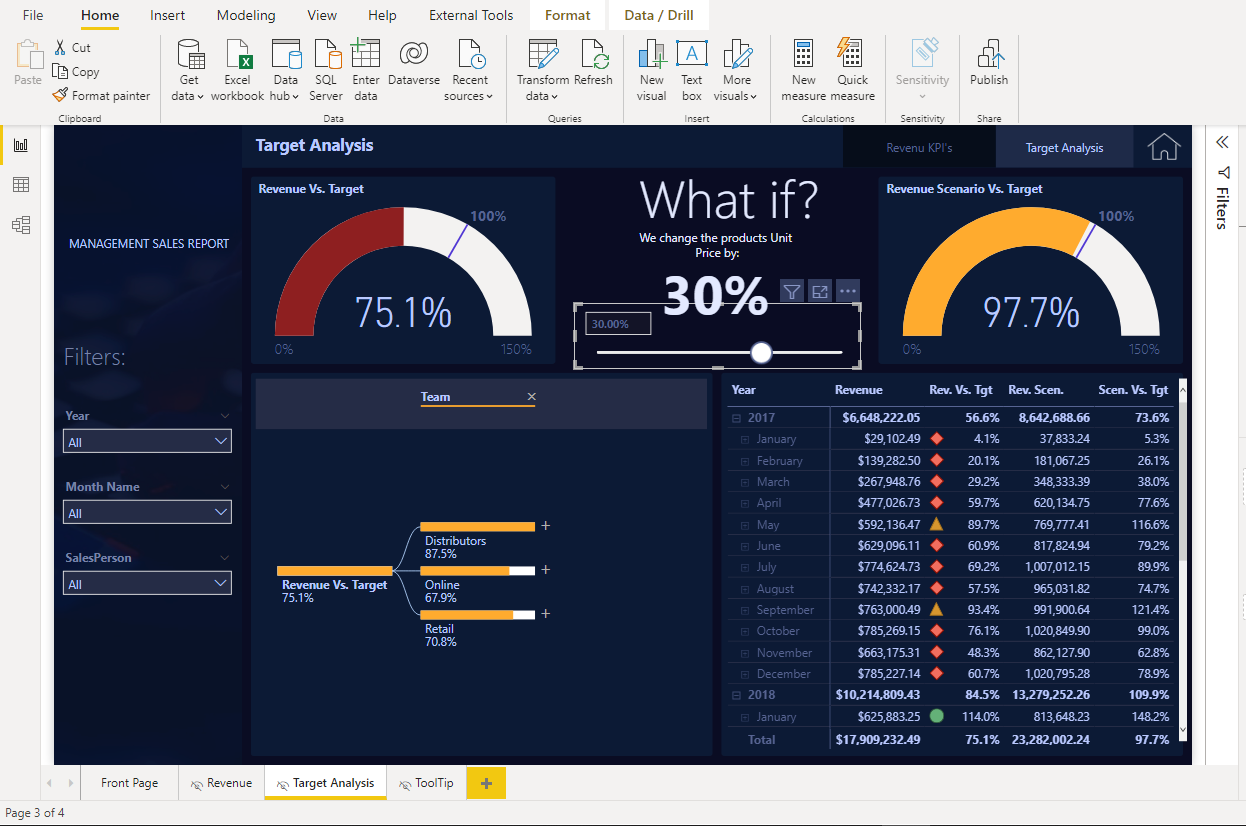
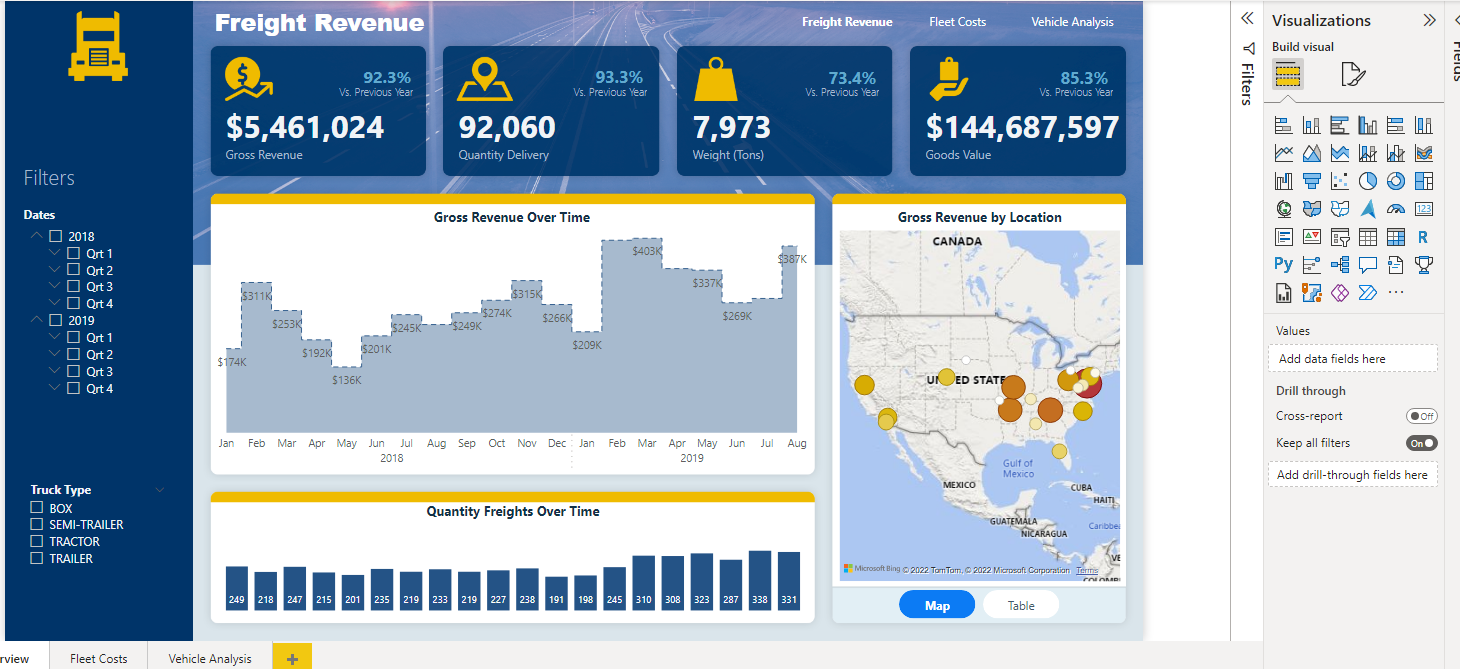
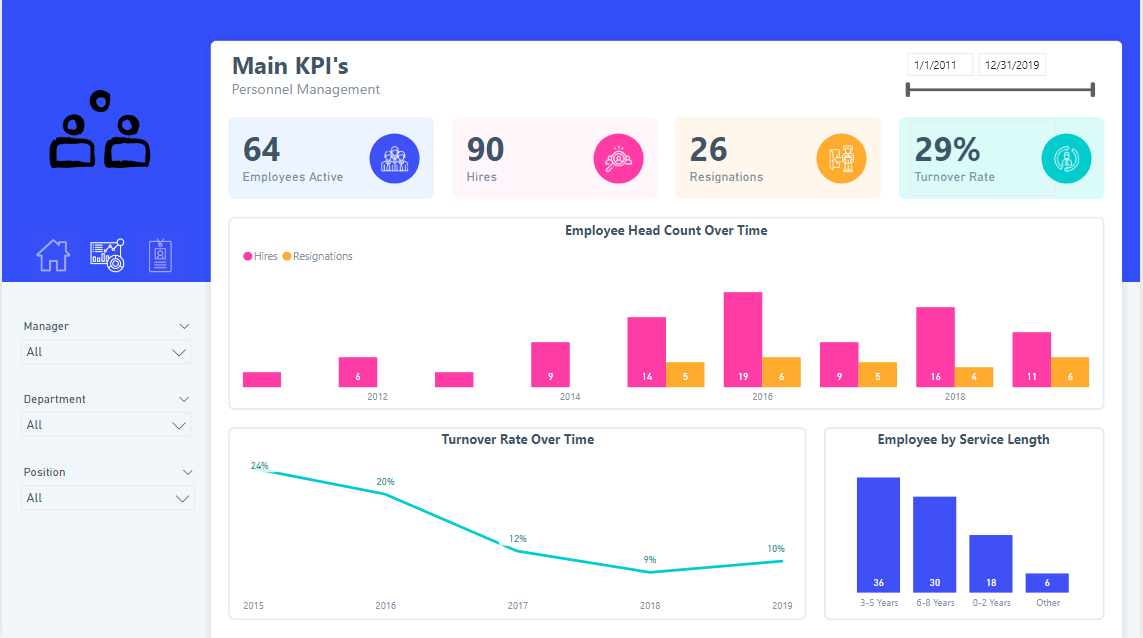
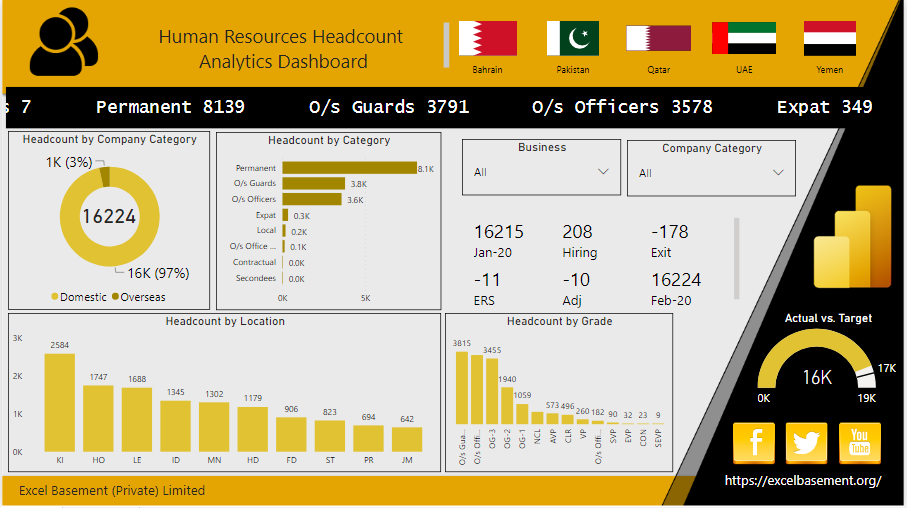
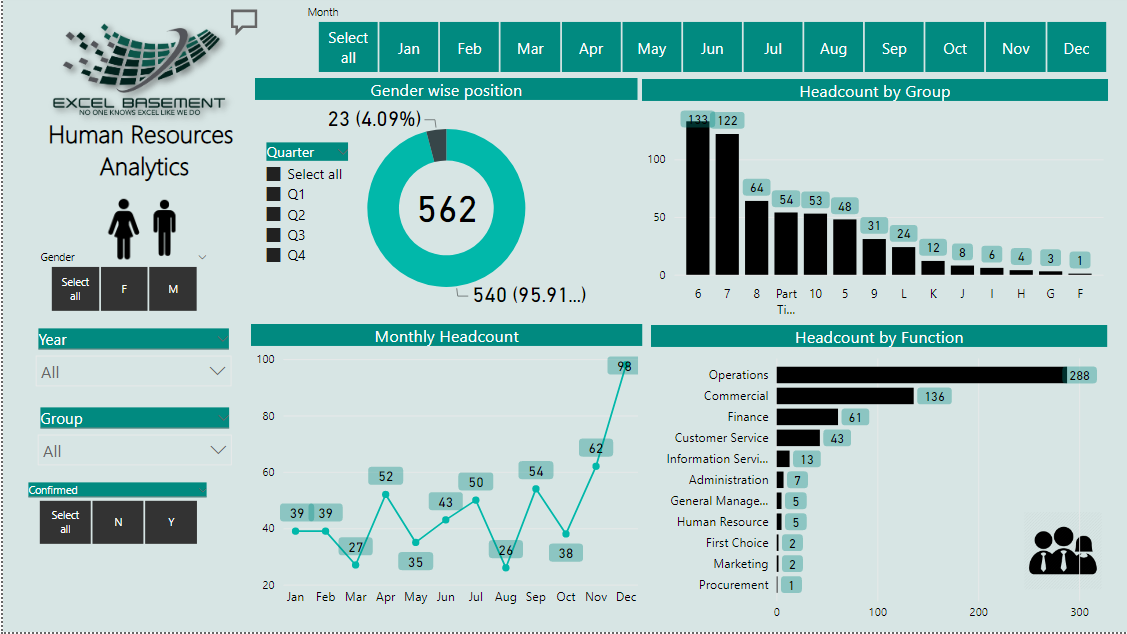
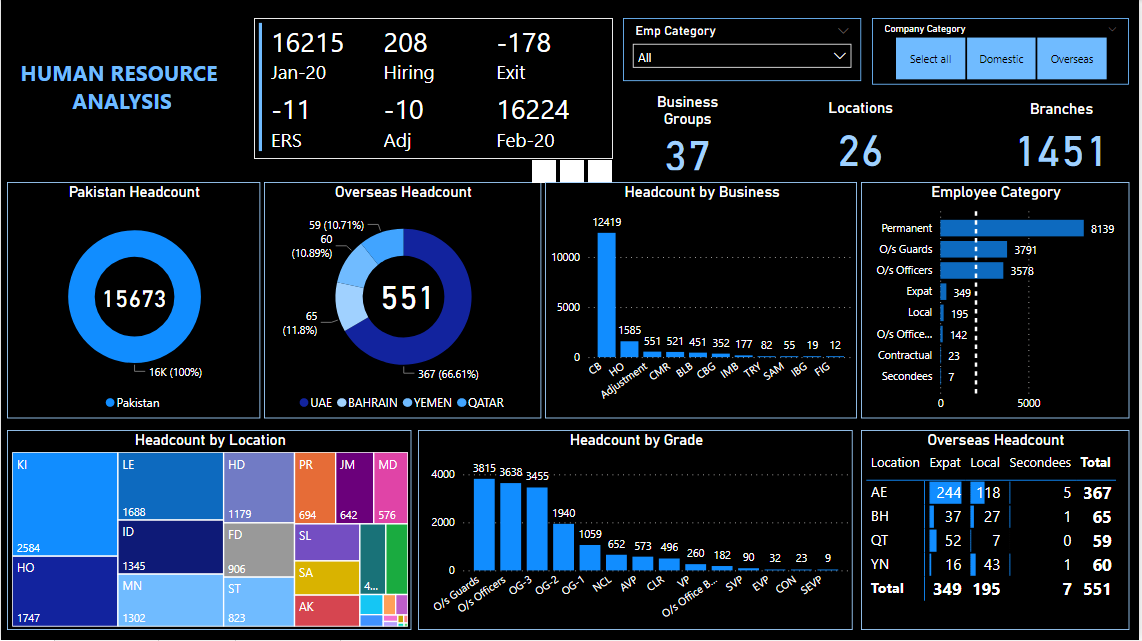
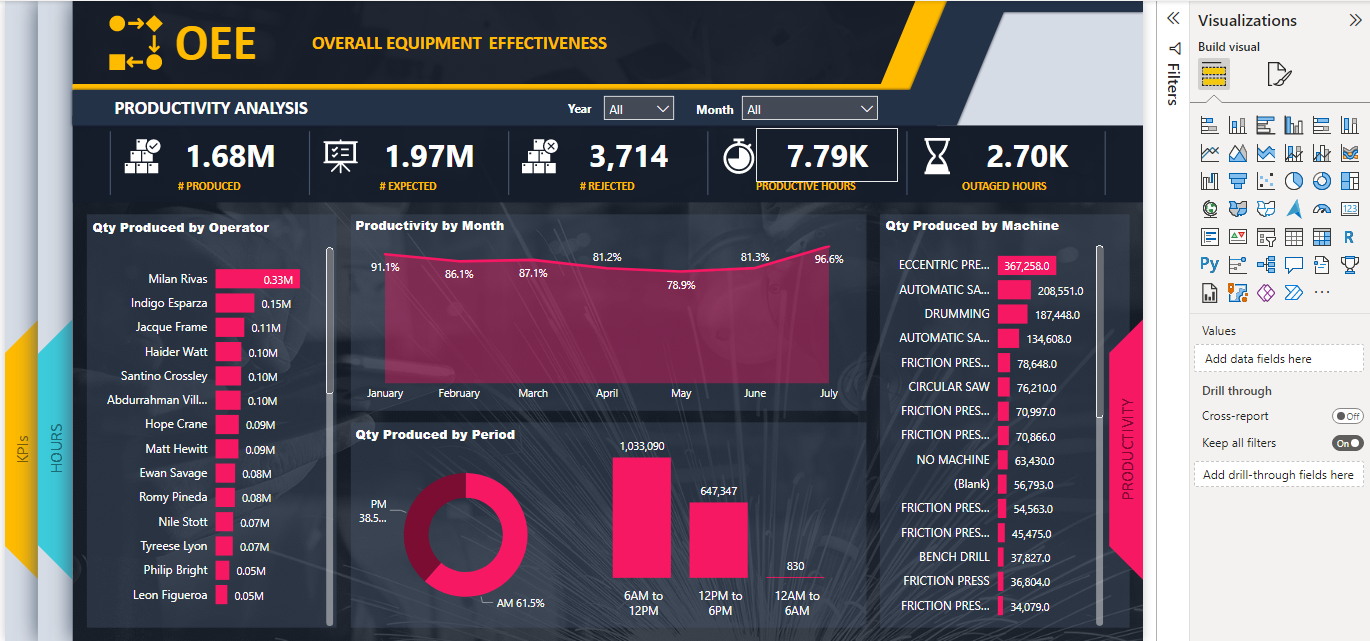
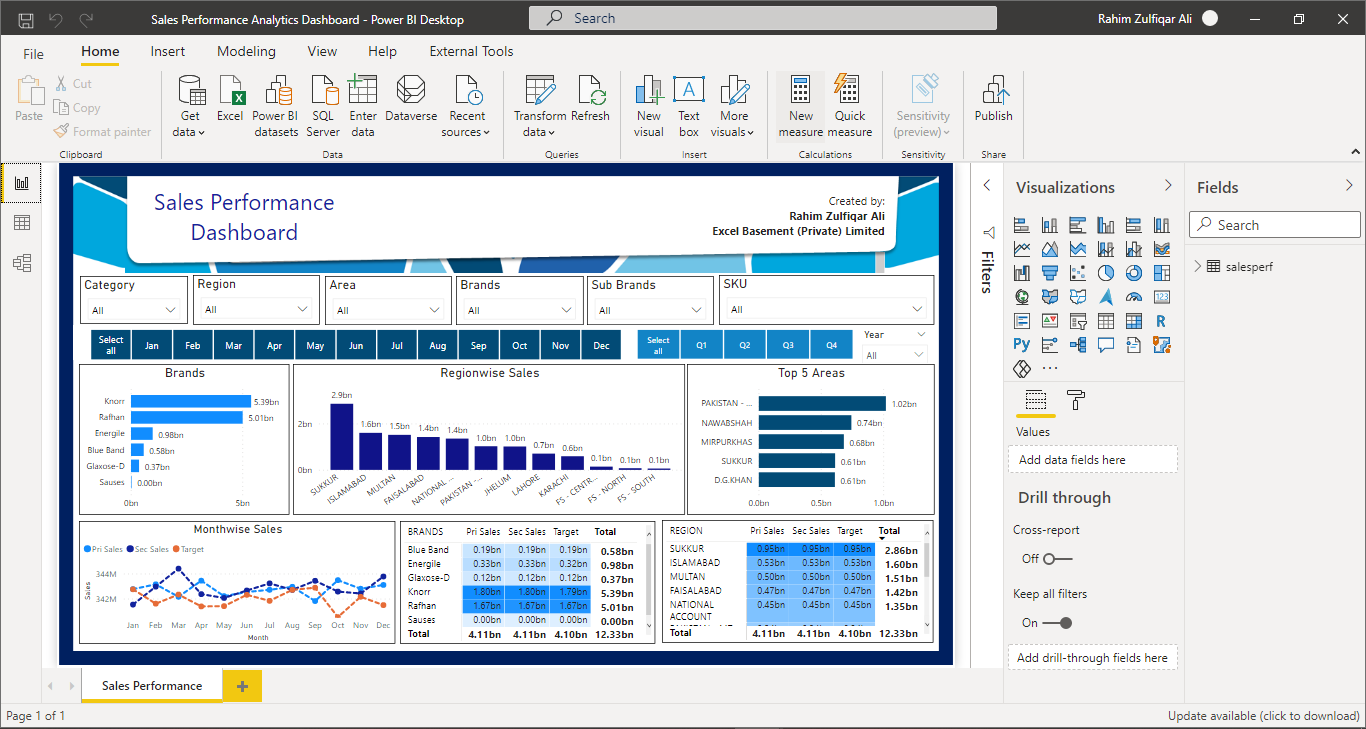
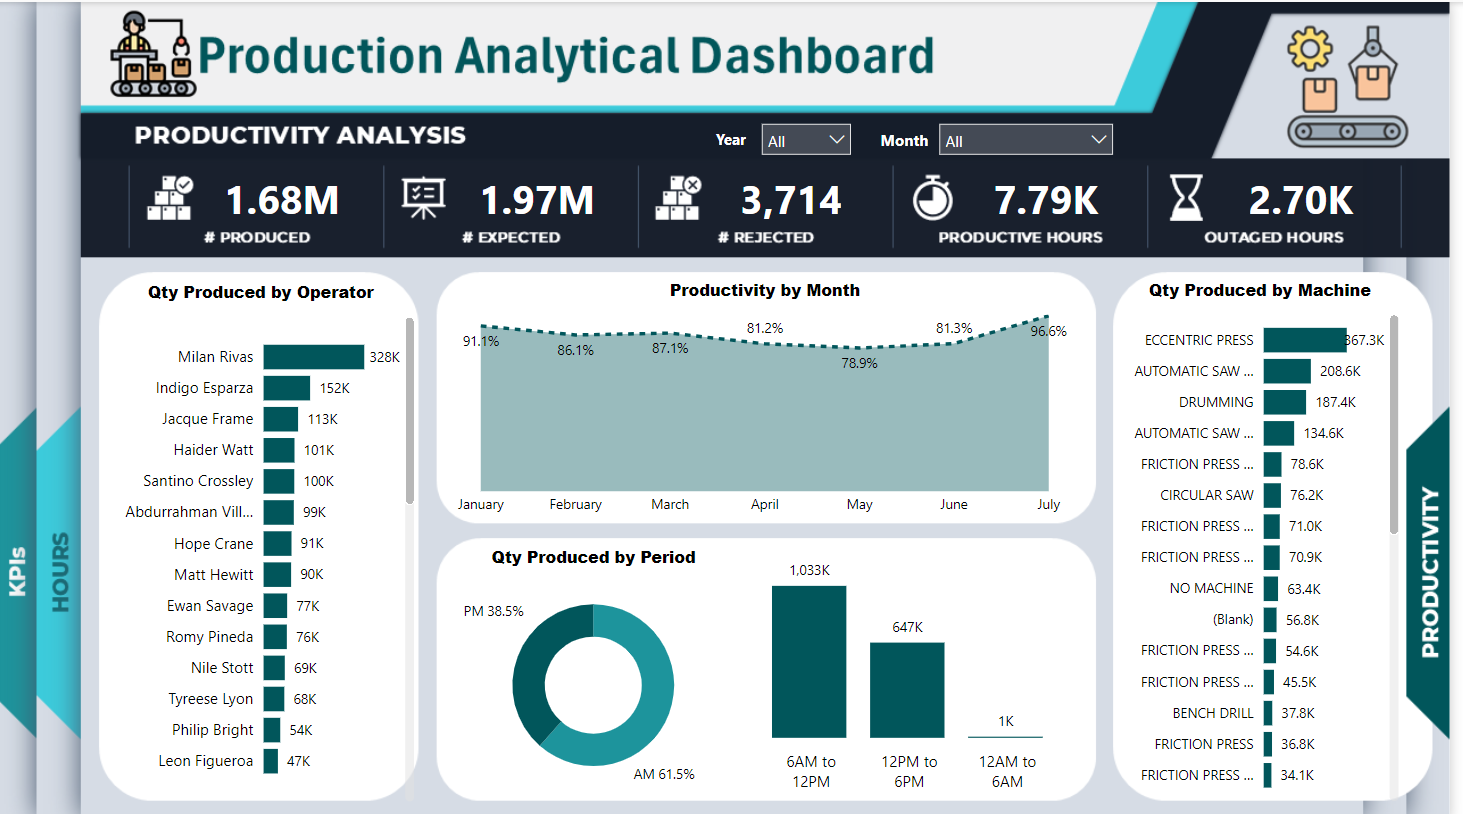
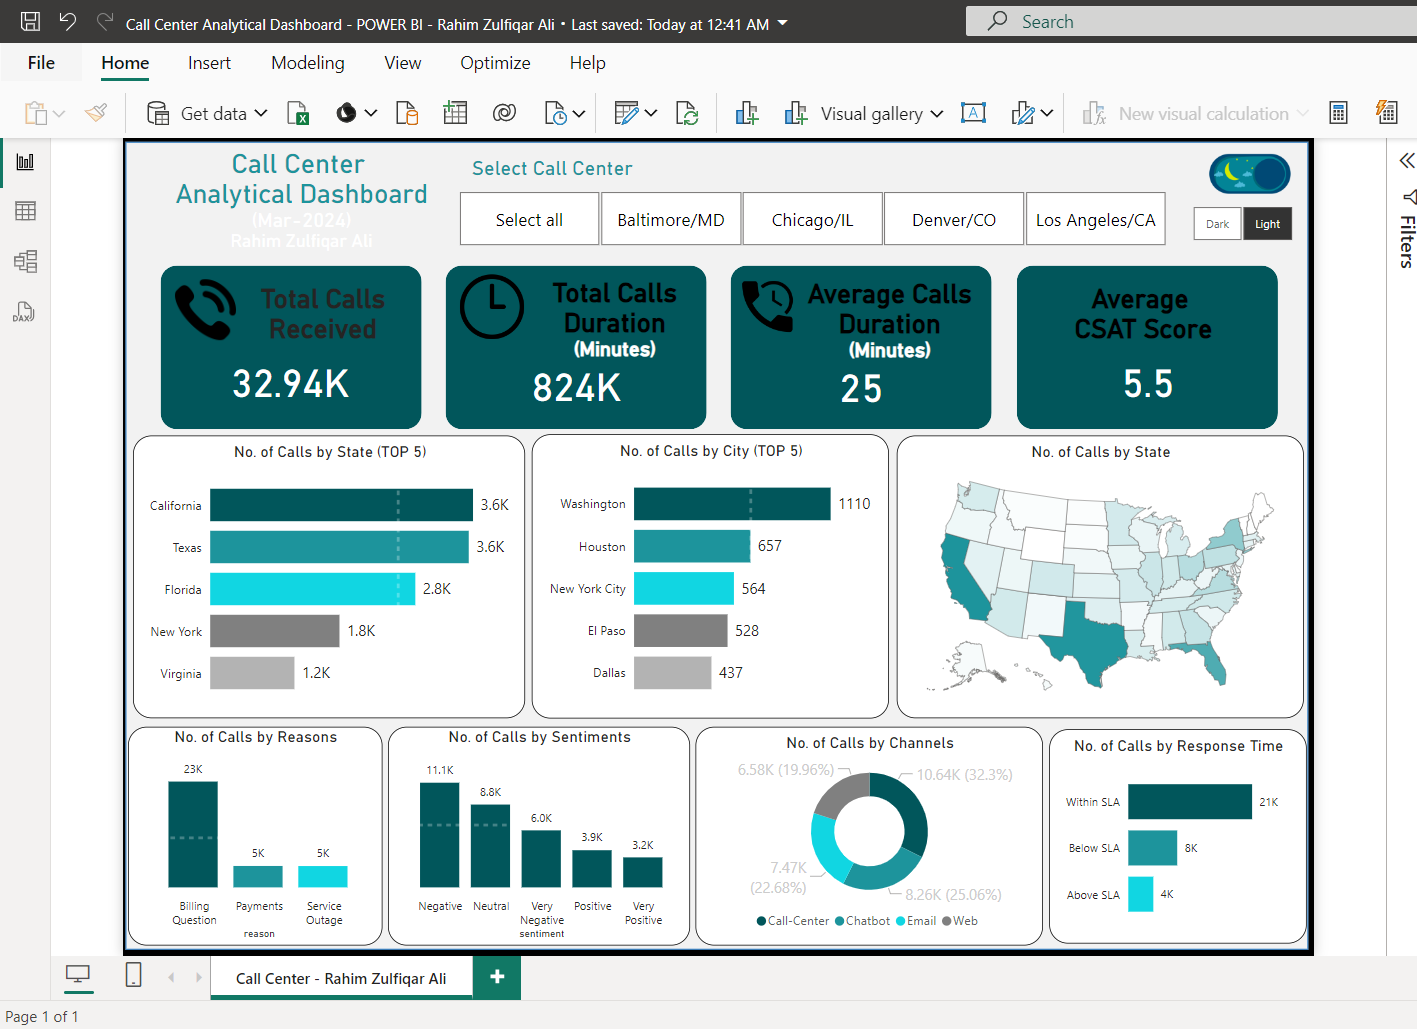
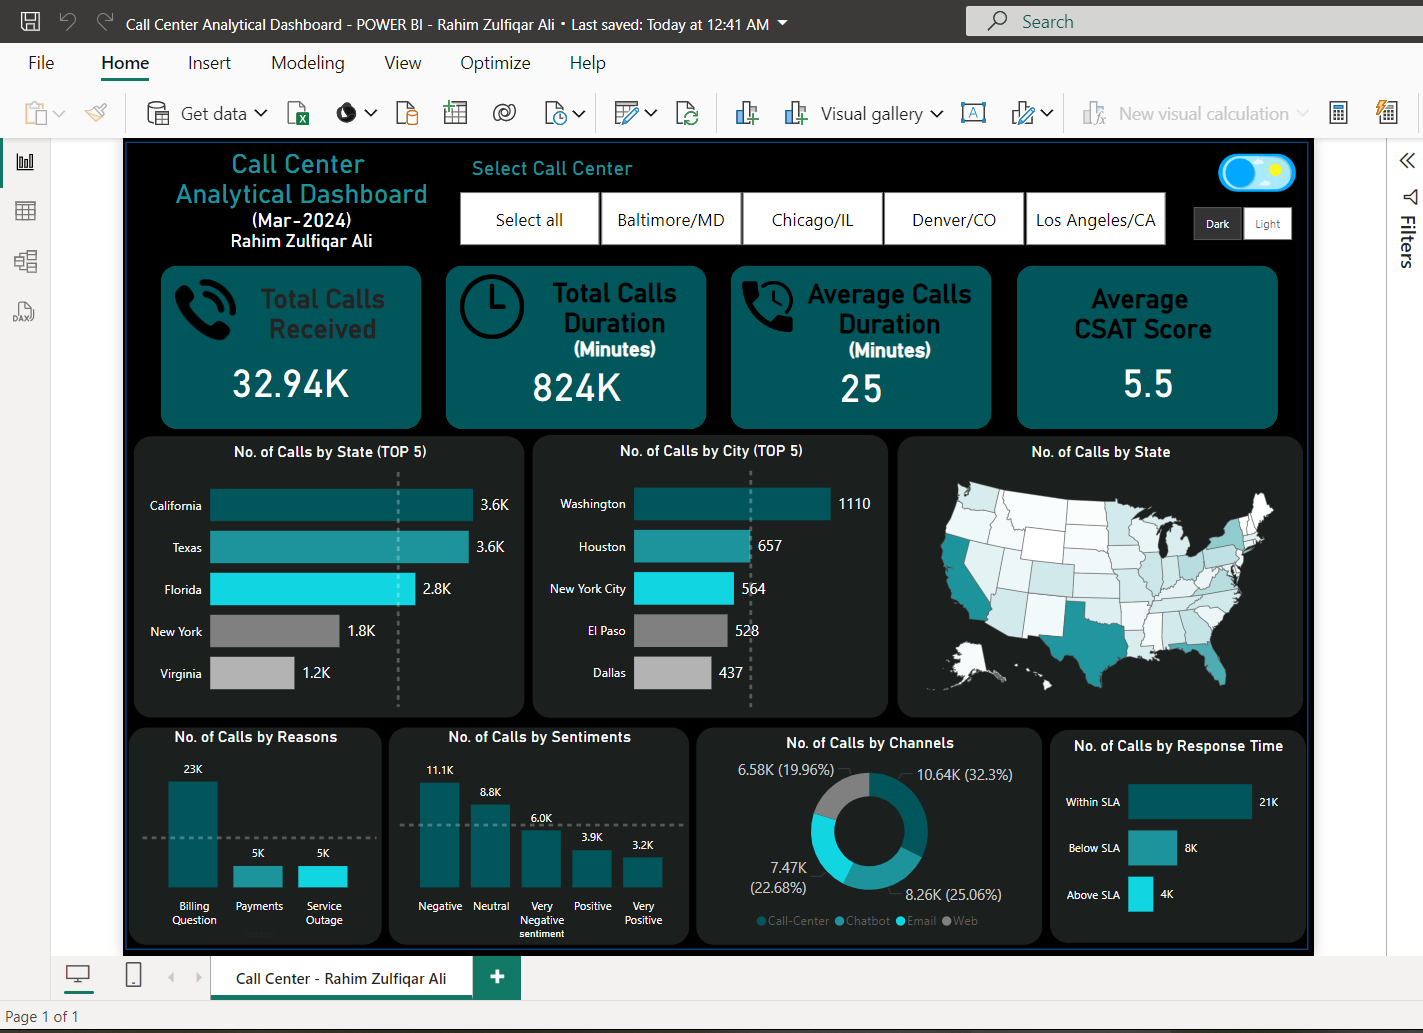
The Best 22 Microsoft POWER BI Templates (HR, Finance, Supply Chain, Sales) Desktop Version
Top 22 Microsoft Power BI Templates for Desktop (HR, Finance, Supply Chain, Sales, Call Center)

Founder & CEO - Excel Basement, Excel & POWER BI Trainer & Consultant, MBA (MIS), MCT, MSOM, Emerging Data ScientistFollow 405
Description
The list of the POWER BI Templates included :
2 - Financial Cash Flow Dashboard
3 - Income Statement Dashboard
4 - Sales Dashboard in POWER BI
5 - Sales vs Target Dashboard
6 - Logistics - Fleet Management
7 - Human Resources Dashboard
8 - Production Dashboard in POWER BI
9 - Call Center Solution
10 - Customer Retention
11 - Financial Planning - WHAT IF ANALYSIS
12 - Sales Performance Analytics Dashboard
13 - Microsoft Income Statement
14 - Advanced Headcount Analytics Dashboard
15 - HRM Analysis
16 - Financial Analytics
17 - Advanced Sales Analytical Dashboard for Business - BIKES
18 - Financial Dashboard POWER BI (Advanced - Professional)
19 - Personal Finance Dashboard - POWER BI
20 - Comprehensive Advanced HR Analytical Dashboard in POWER BI
21 - Call Center Dashboard
22 - Production Analytical Dashboard
Power BI is a business analytics service by Microsoft. It aims to provide interactive visualizations and business intelligence capabilities with an interface simple enough for end-users to create their own reports and dashboards.
Microsoft Power BI is a business intelligence platform that provides non-technical business users with tools for aggregating, analyzing, visualizing, and sharing data. Power BI's user interface is fairly intuitive for users familiar with Excel and its deep integration with other Microsoft products makes it a very versatile self-service tool that requires little upfront training.
The financial operations dashboard in Power BI allows you to: Implement better cost and cash management strategies. Track your business expenses and sales revenue. Provide a daily overview of the cash flow in your business and your liquidity status
Power BI dashboards implement data visualization that is a proven technique of understanding and analyzing finance-related KPIs and metrics. Through efficient visual representation, financial analysts can process even complex data and arrive at better decisions. This is a more reliable mode than going through multiple Excel spreadsheets.
Empowered by the latest data visualization techniques, Power BI dashboards are among the most effective resources for use by financial and accounting experts. As outlined in this write-up, a financial operations dashboard in Power BI can be developed with key finance-related metrics and KPIs.
This Best Practice includes
22 Microsoft POWER BI Desktop Version Files (PBIX) with Excel Datasets Files