
Publication number: ELQ-26227-1
View all versions & Certificate

SaaS Metrics Dashboard
A complete SaaS metrics dashboard in a single HTML file — 8 interactive charts, live KPI cards, goals tracker, benchmark comparison, and smart alerts.
📊 SaaS Metrics Dashboard — Interactive HTML File
By Data'sOk
━━━━━━━━━━━━━━━━━━━━━━━━
A board-ready SaaS metrics dashboard. No software. No subscription. Just open the file.
Most SaaS founders and operators track their numbers across multiple tools — a spreadsheet for MRR, a separate tab for churn, a chart someone built in Google Sheets two years ago. This dashboard pulls everything into one clean, interactive view that looks professional enough to show investors and simple enough to update in minutes.
One HTML file. Works in any browser. Fully offline. No data ever leaves your computer.
━━━━━━━━━━━━━━━━━━━━━━━━
WHAT YOU GET
📊 8 interactive charts
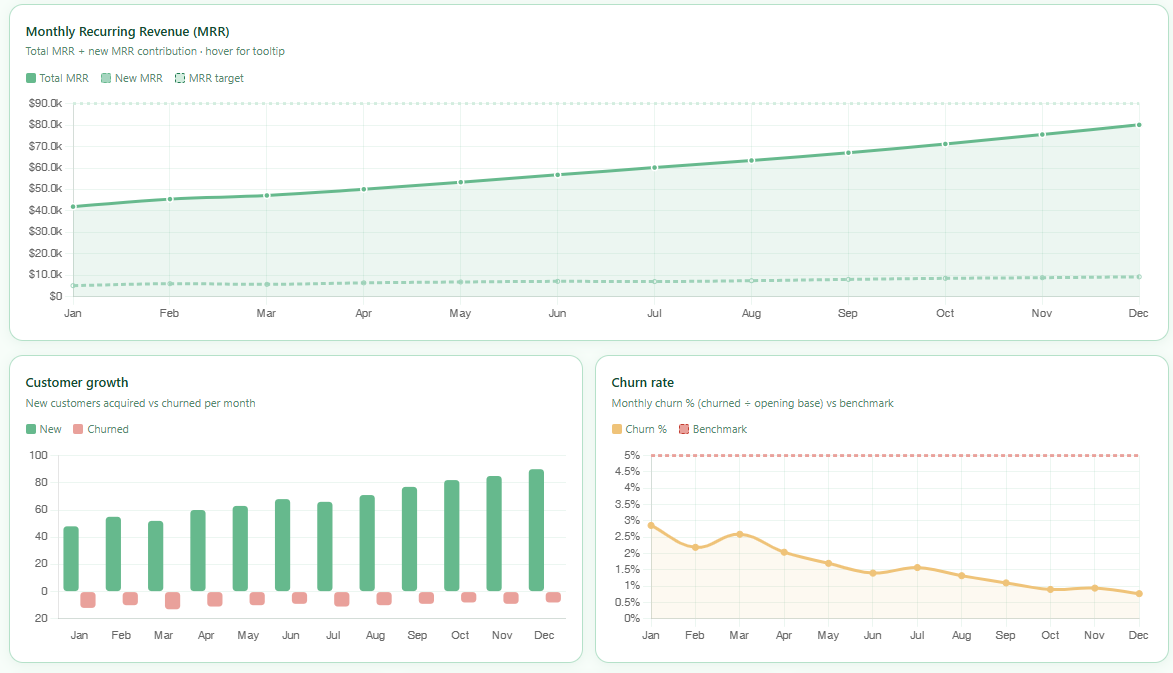
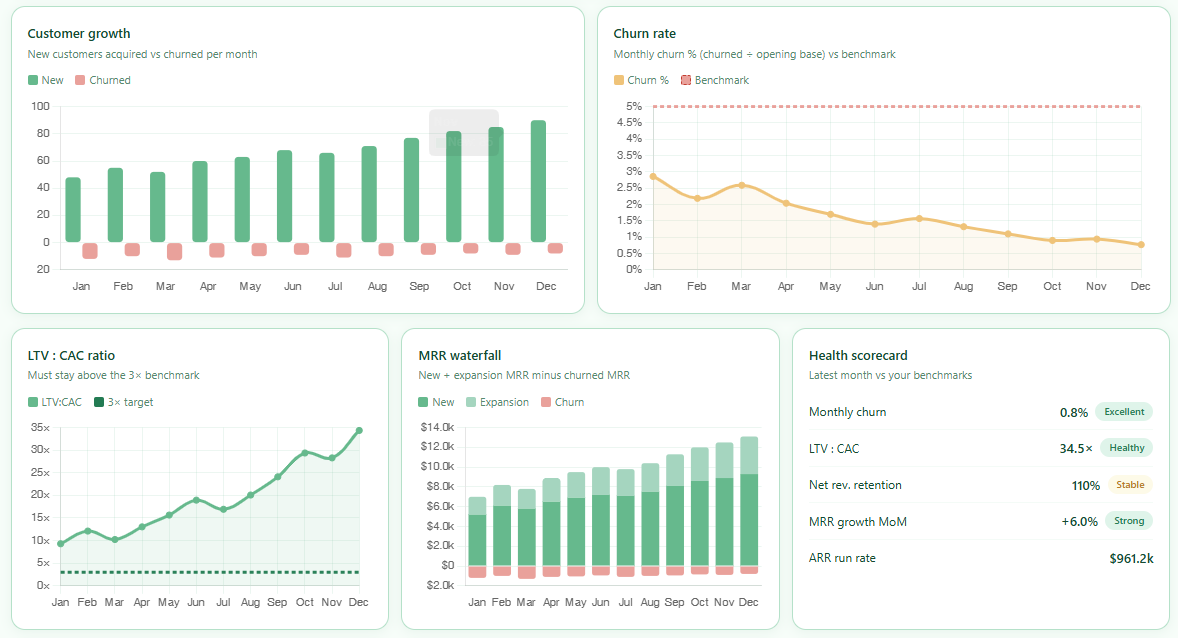
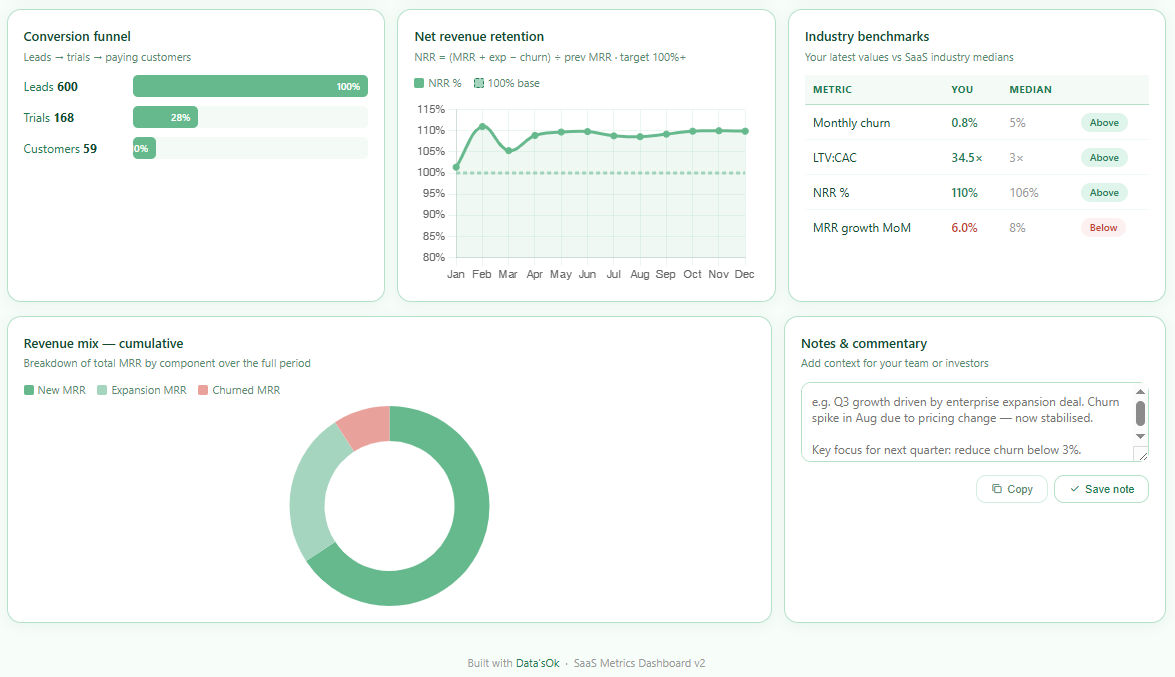
MRR trend (with target line), customer growth, churn rate vs benchmark, LTV:CAC ratio, MRR waterfall (new + expansion − churn), net revenue retention, revenue mix donut, and conversion funnel.
📈 6 live KPI cards
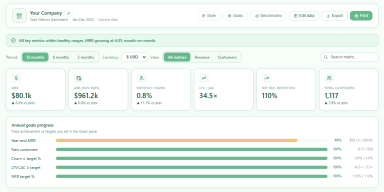
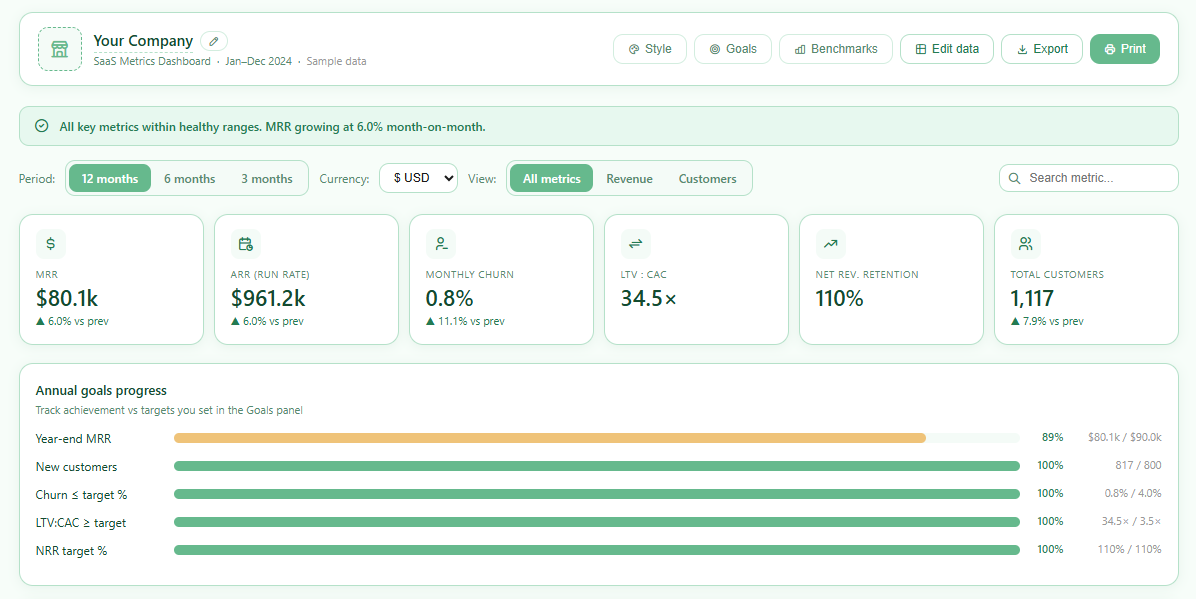
MRR, ARR, monthly churn %, LTV:CAC, net revenue retention, and total customers — each with month-on-month delta indicators.
🎯 Annual goals tracker
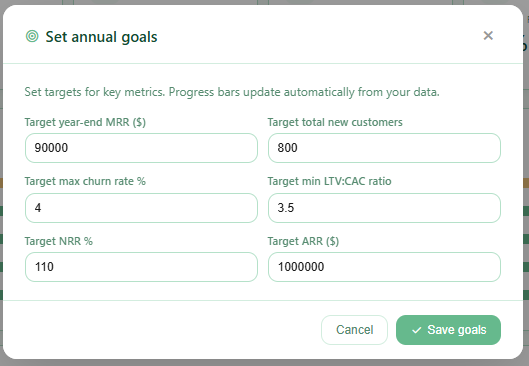
Set targets for MRR, new customers, churn, LTV:CAC, NRR, and ARR. Progress bars update automatically from your data.
📊 Industry benchmark comparison
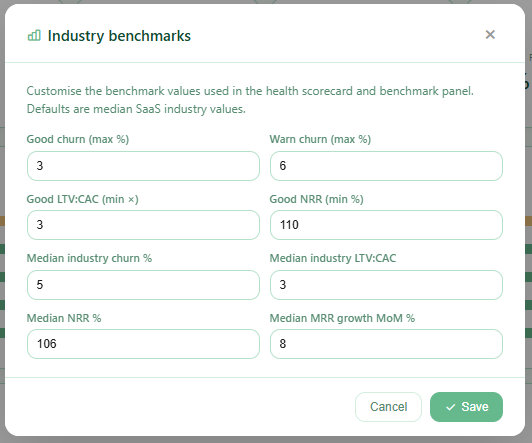
See how your metrics compare against SaaS industry medians — with Above / Below badges. All benchmark values are fully customisable.
⚠️ Smart alert banner
Automatic colour-coded alerts: green when everything is healthy, amber when churn creeps above target, red when critical thresholds are breached.
🎨 Full branding customisation
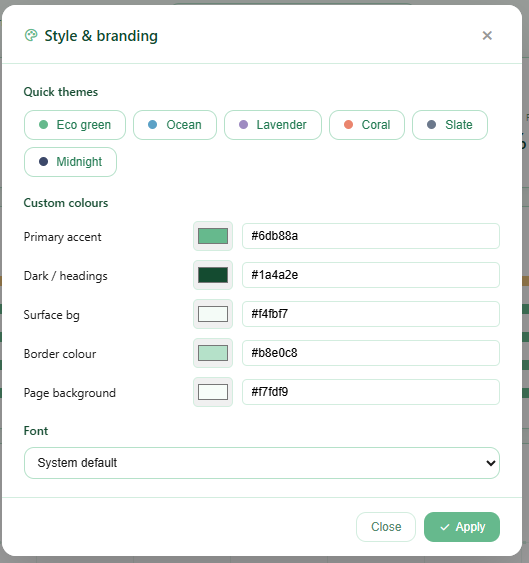
Upload your company logo. Edit your company name. Choose from 6 colour themes (Eco green, Ocean, Lavender, Coral, Slate, Midnight) or set your own hex colours. Change font. All charts update instantly.
📅 Flexible data entry
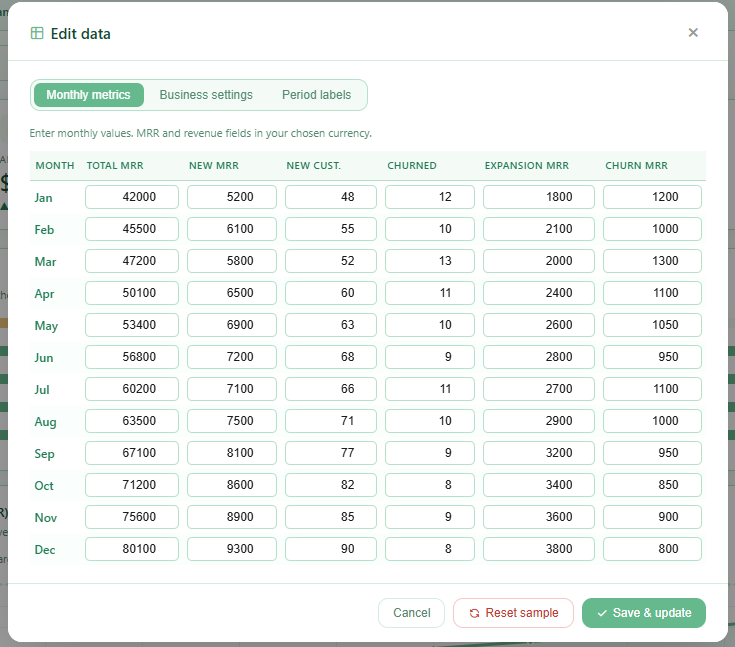
Fill in your 12 months of data through a clean 3-tab modal: monthly metrics, business settings (ARPU, CAC, conversion rates, targets), and period labels. Switch between full year / last 6 months / last 3 months instantly.
💾 Export & import
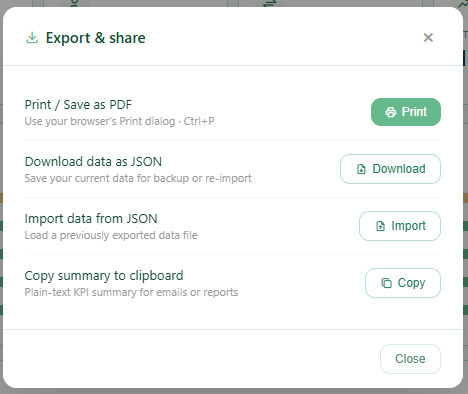
Download your data as JSON for backup. Re-import it anytime. Copy a plain-text KPI summary to clipboard for emails or board reports. Print to PDF in one click.
📝 Notes & commentary
A free-text panel for analyst notes, investor context, or team commentary — included in the print view.
━━━━━━━━━━━━━━━━━━━━━━━━
WHO IT'S FOR
→ SaaS founders who want a clean, investor-ready metrics view without building one from scratch
→ Operations and finance managers who produce monthly SaaS reviews
→ Consultants presenting SaaS analytics to clients
→ Anyone who has ever spent more time formatting a metrics slide than analysing the numbers
━━━━━━━━━━━━━━━━━━━━━━━━
WHY IT'S DIFFERENT
This is not a template that requires Power BI, Tableau, or a BI tool subscription. It is not a Google Sheets dashboard that breaks when someone edits the wrong cell. It is a single self-contained HTML file — open it, enter your data, and you have a professional SaaS dashboard in under 20 minutes.
No login. No subscription. No internet connection required after download. Your data never leaves your computer.
━━━━━━━━━━━━━━━━━━━━━━━━
REQUIREMENTS
Any modern browser: Chrome, Firefox, Safari, or Edge. No installation required.
Works on Windows, Mac, and Linux.
This Best Practice includes
1 rar. file with an HTML file.
