
Publication number: ELQ-41136-1
View all versions & Certificate

Website Performance Dashboard (Power Bi)
Web Perf BI
Further information
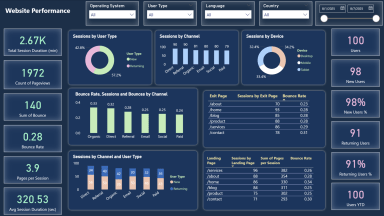
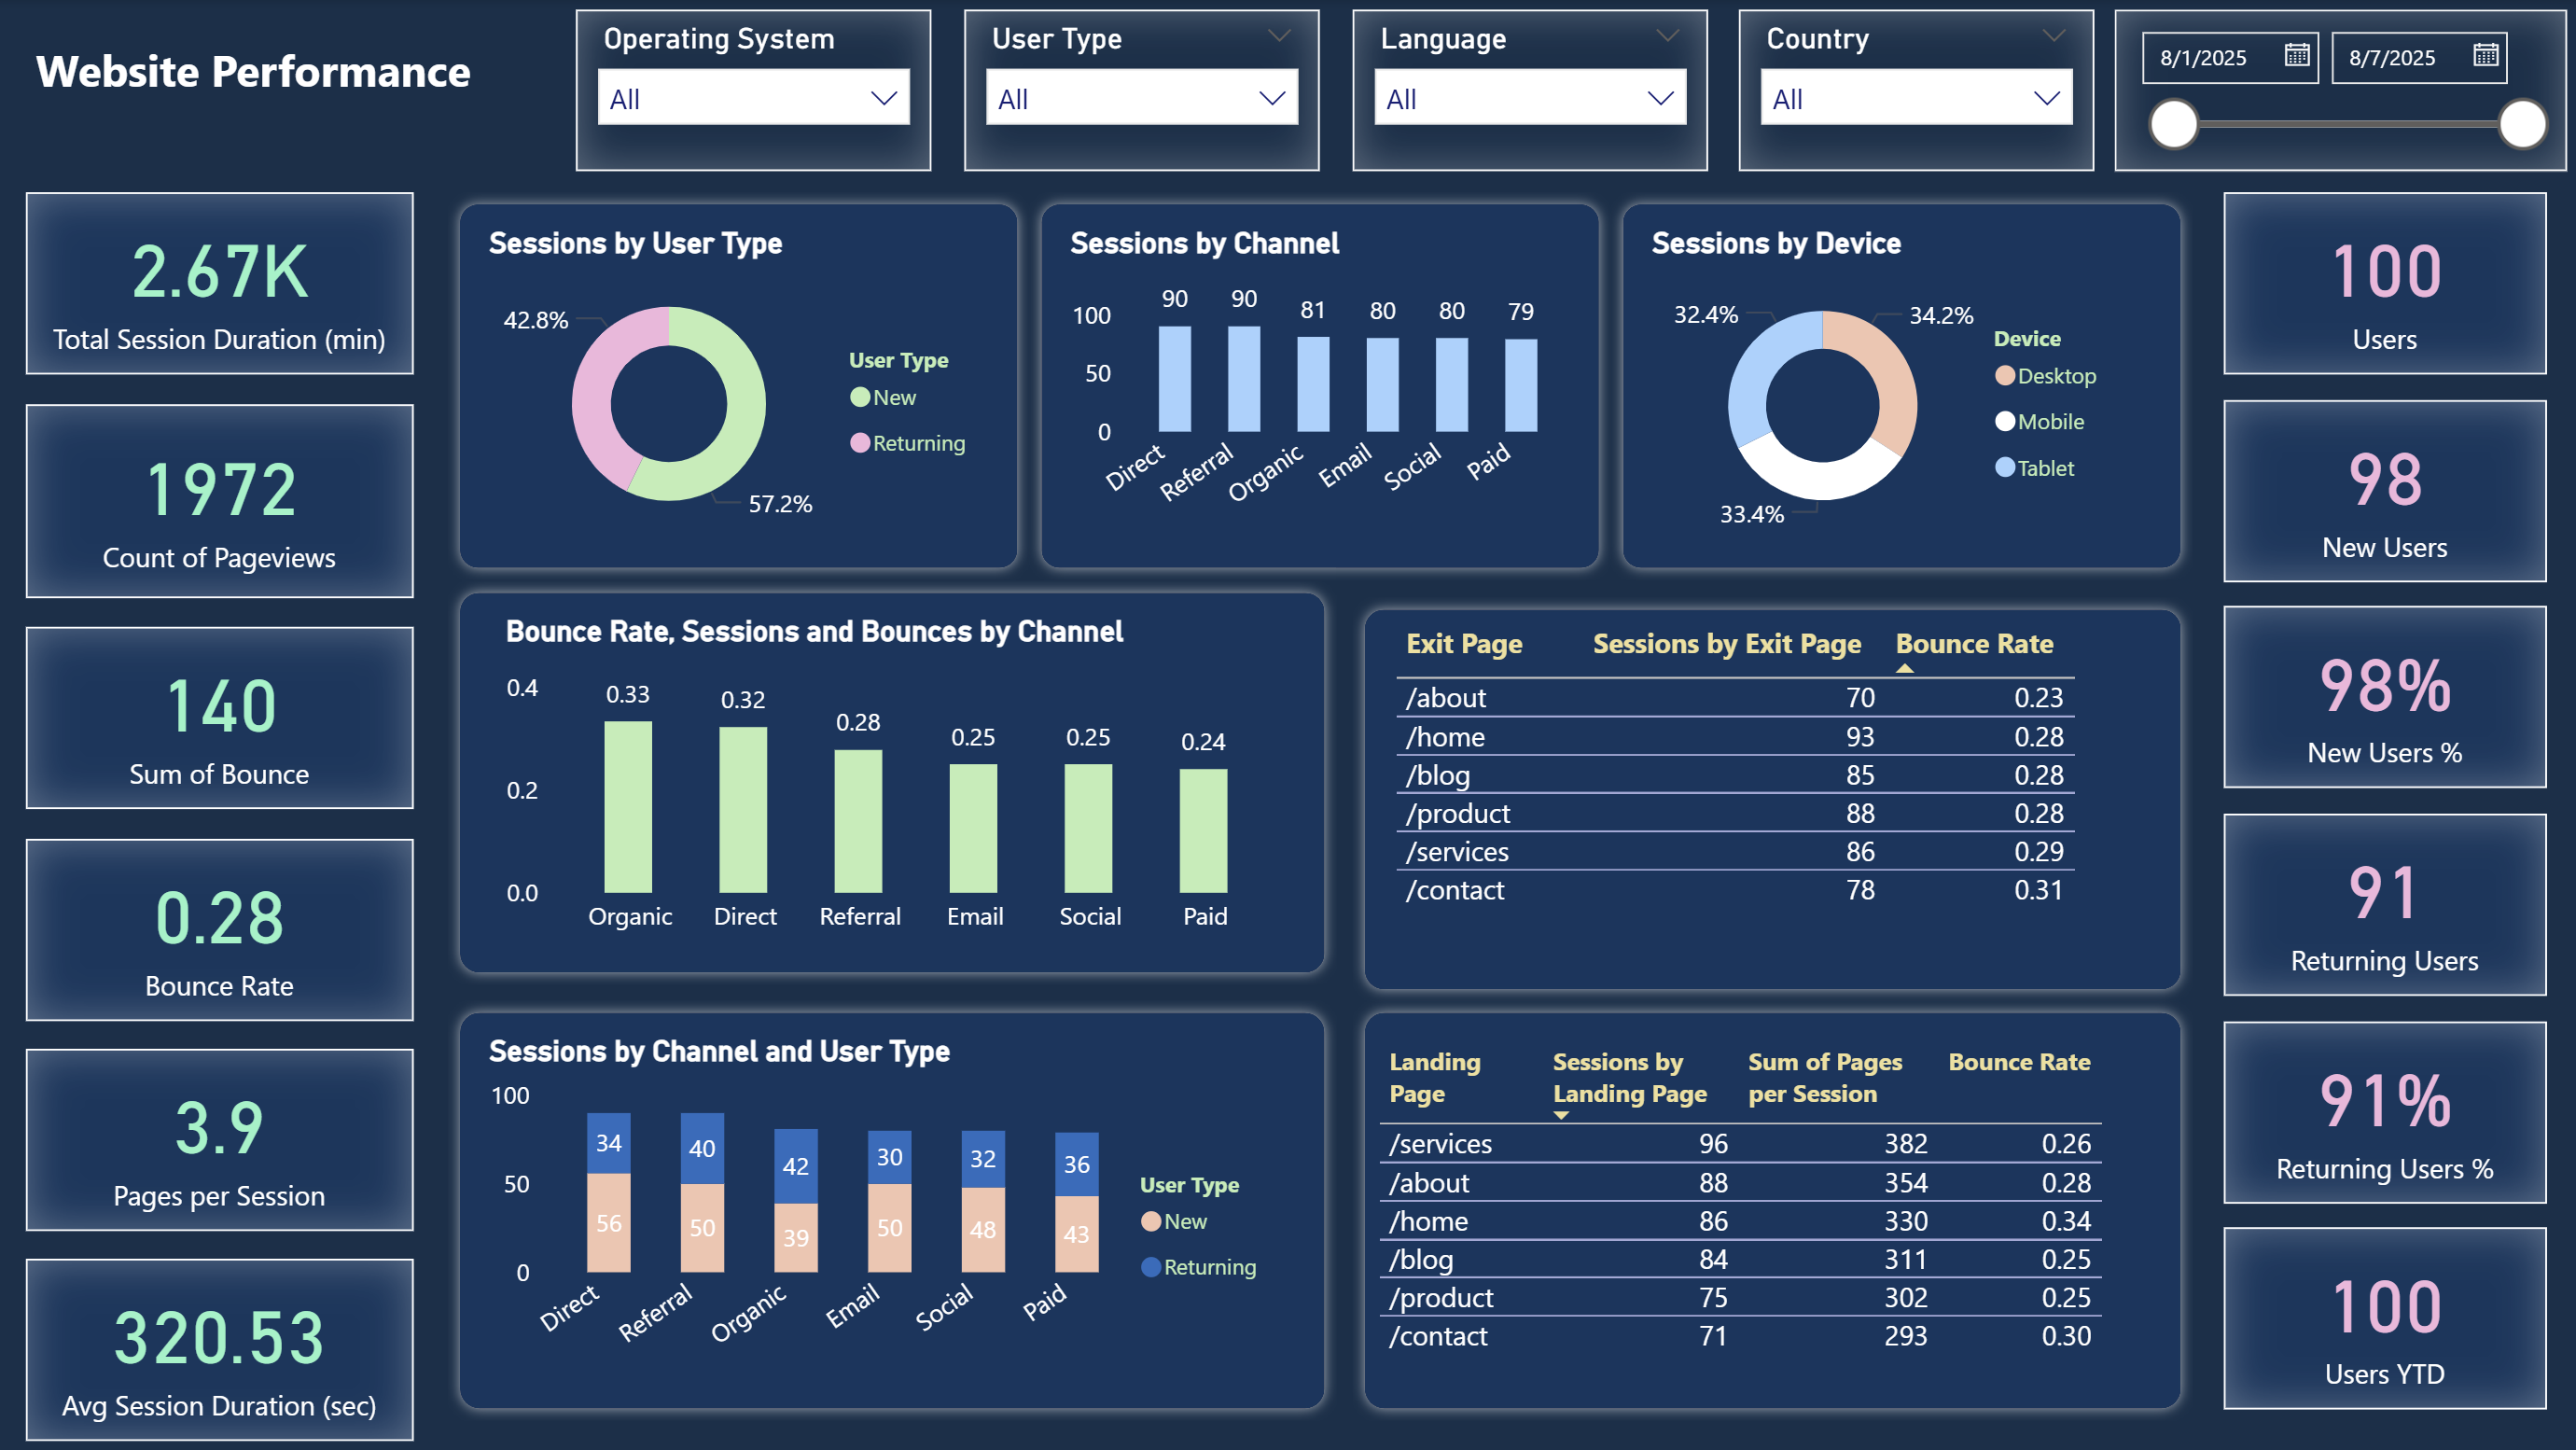
provide a comprehensive, real-time view of website performance by consolidating key user behavior, engagement, and traffic source metrics into a single interactive report. It enables marketers, analysts, and business decision-makers to monitor sessions, user acquisition trends, bounce rates, session duration, and content performance across devices, channels, and geographies. By visualizing this information in an intuitive and customizable format, the dashboard supports data-driven decisions aimed at improving user engagement, optimizing marketing spend, and enhancing overall website effectiveness.
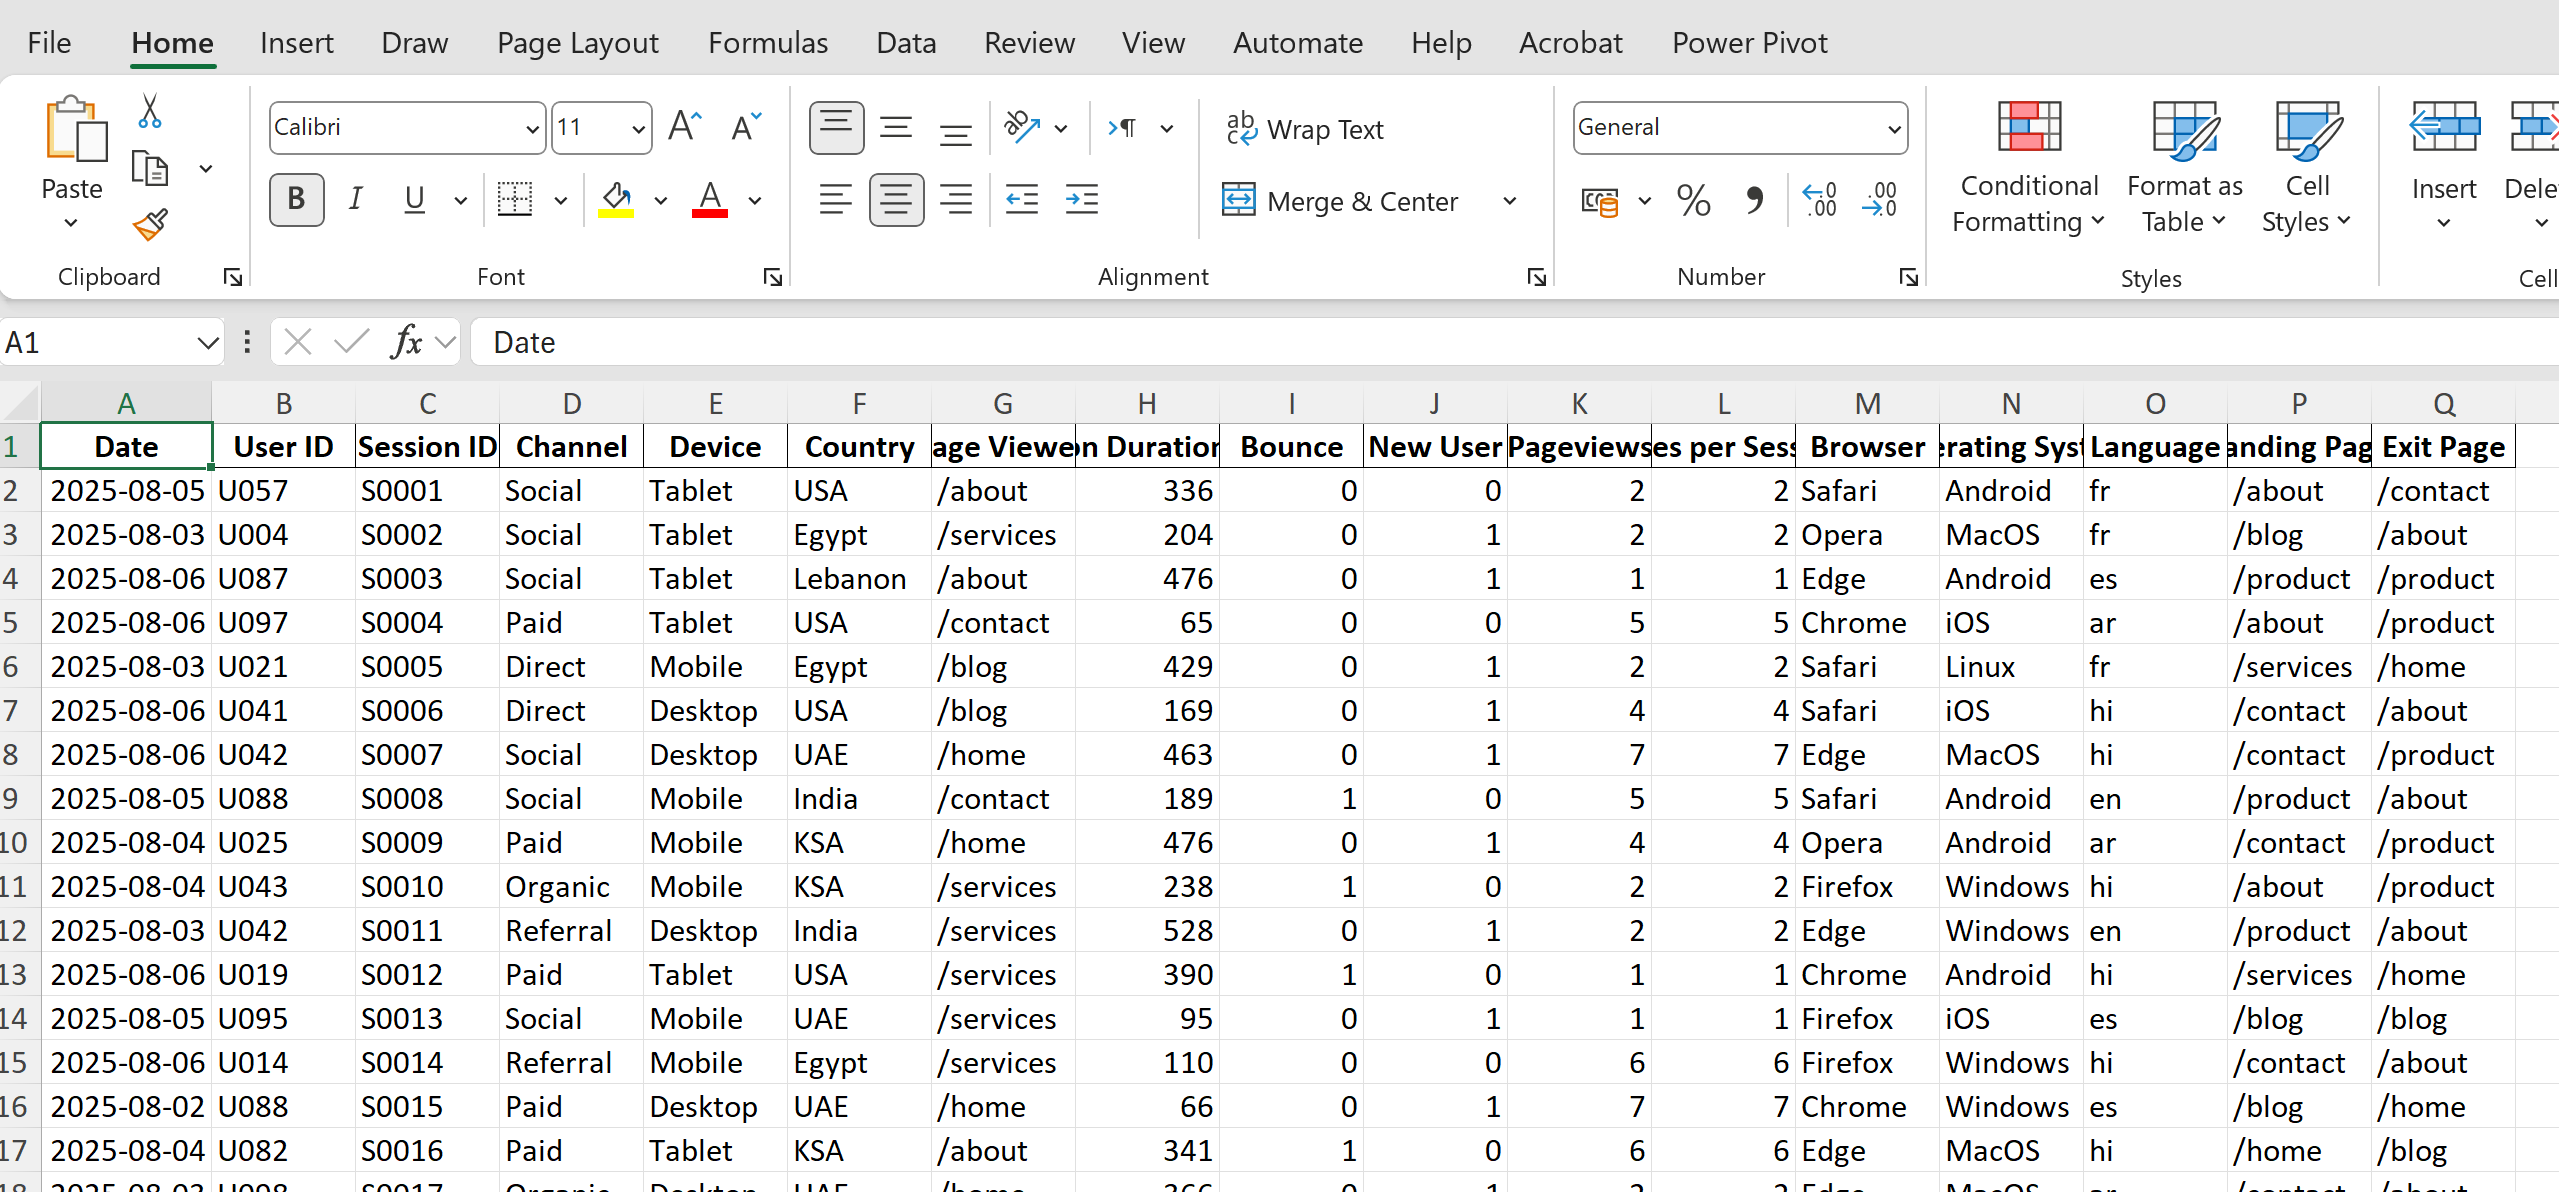
This dashboard is best suited for organizations or individuals who actively track and optimize website performance using analytics data from sources such as Google Analytics, server logs, or marketing platforms. It is most effective when accurate, regularly updated data is available for sessions, users, traffic channels, devices, and engagement metrics. The template is ideal for marketing teams, content managers, and digital strategists who require a centralized, visual overview to evaluate campaign effectiveness, user behavior, and content performance across multiple dimensions.
This dashboard may not deliver optimal results if the underlying website analytics data is incomplete, inaccurate, or infrequently updated. It is less effective for websites with extremely low traffic volumes, where meaningful patterns and trends are difficult to detect. Additionally, it is not intended for tracking non-web digital assets (such as mobile apps) unless equivalent engagement data is available and structured similarly to website analytics metrics.
