
Originally published: 06/06/2025 08:26
Publication number: ELQ-52046-1
View all versions & Certificate
Publication number: ELQ-52046-1
View all versions & Certificate

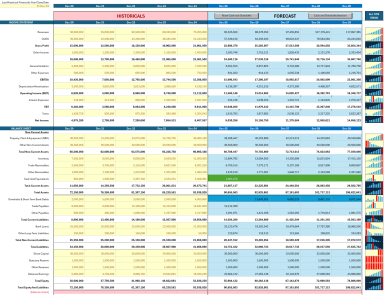
Quick 5-yr Financial Statements Forecaster
Financial Statements Forecaster
financial modelprojectionsfinancial ratiosfinancingprojected statementscashflow projectionsincome statement projectionincome statementbalance sheet
Description
*** Model Overview ****
• Part of the roles of a financial analyst is evaluating investment opportunities. Such opportunities may be numerous and vary in complexity. The valuation methods however will include projecting the financial performance of a target asset in the future.
• Having a dynamic template to enable an analyst to quickly plugin historical statements and instantly produce a set of forecasted financial statements will add a lot of value and productivity to their work.
• Similarly, sometimes conducting a forecast for a company’s financials is required by finance institutions, investors and other creditors. It is also a useful business planning tool for a corporation.
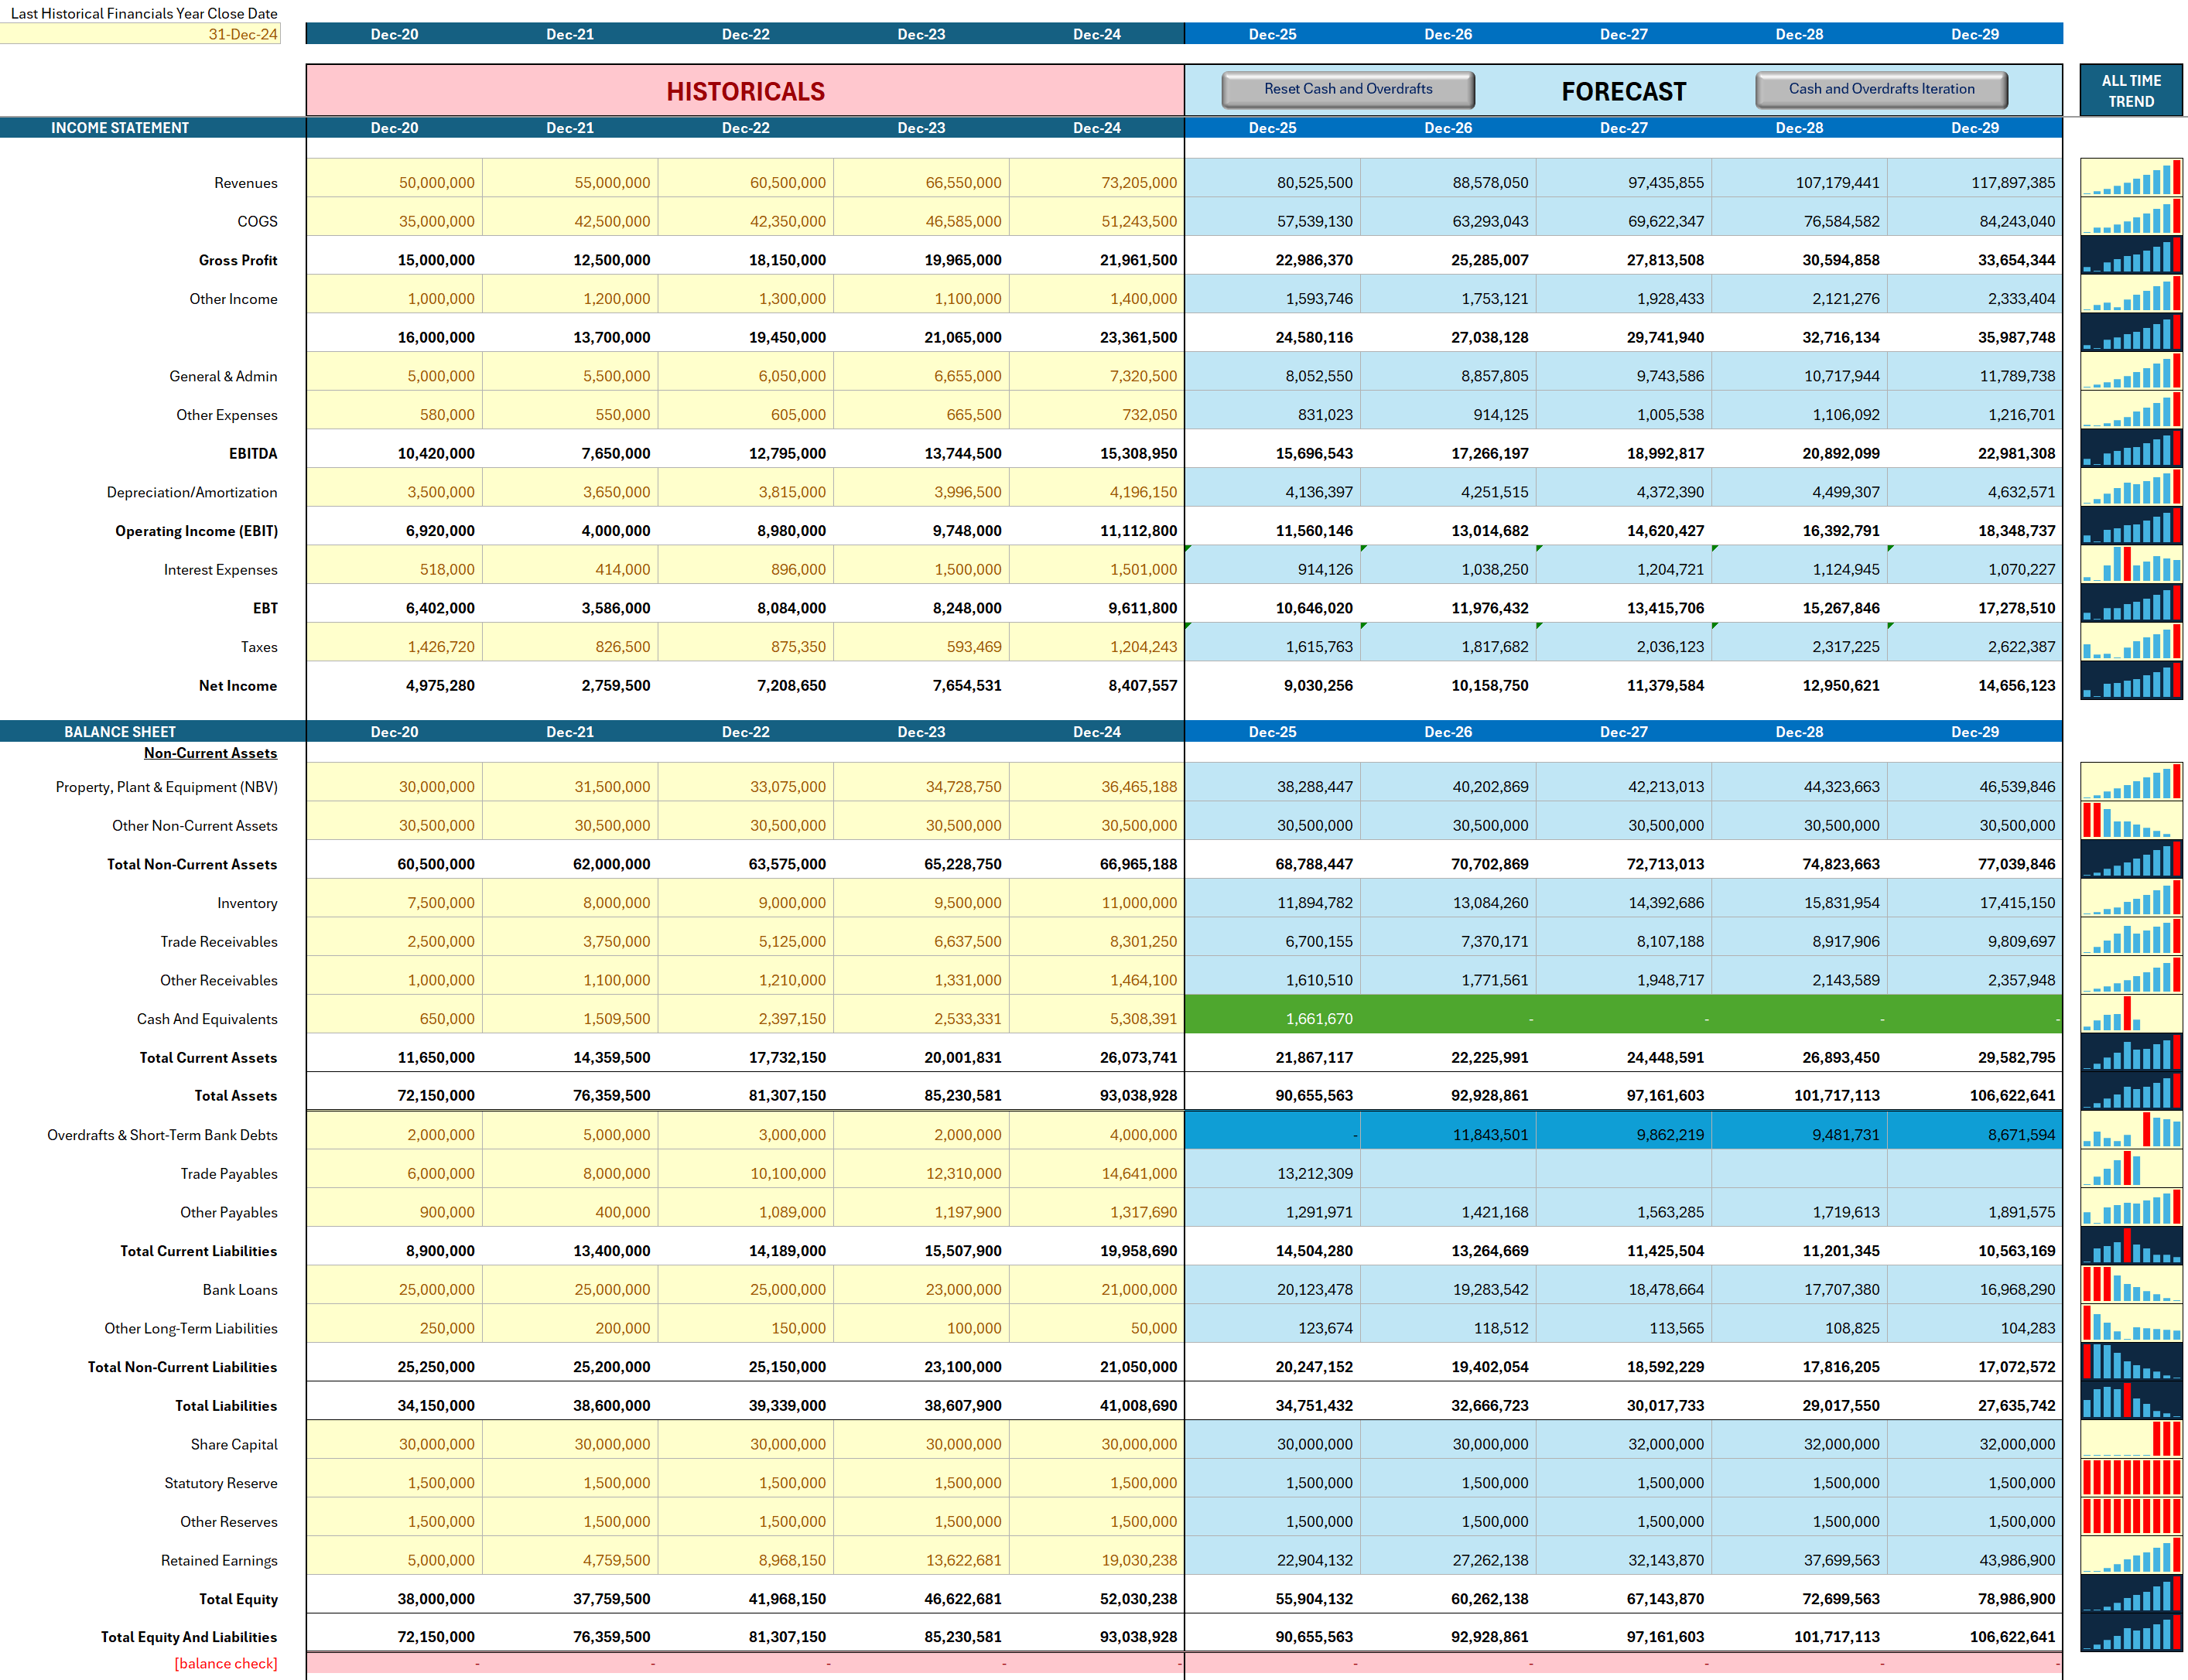
*** Income Statement Forecast ***
• The income statement starts with forecasting sales. This is done based on the average year on year growth rate of historical sales in the past 5 years.
• COGS is then forecasted based on the historical average of gross profit margin.
• Other income, G&A expenses and other expenses are forecasted using their average ratio to sales in the past 5 years.
• Depreciation/Amortization is forecasted using an average ratio of this expense to the balance of non-current assets.
• Interest expense is forecasted based on the average cost of debt over the past 5 years and the average debt balance.
• Taxes are forecasted based on the average tax rate ratio of to EBT in the past 5 years.
*** Balance Sheet Forecast ***
• Non-current assets are forecasted using growth in Net Book Value of PPE and Other Non-Current Assets. The growth rates are found in the growth ratios section and based on the historical average.
• Inventory is forecasted using the historical average Inventory Days of COGS.
• Trade Receivables and Other Receivables are forecasted based on the historical average Days of Sales separately.
• Trade Payables and Other Payables are forecasted based on the historical average Days of COGS separately.
• Cash & Cash Equivalents and Overdrafts & Short-Term Debts are used as balancing figures for the forecast depending on the cash surplus or deficit in the forecast years.
• Banks Loans balances over the forecast are linked to a repayment ratio taken from average change in loan balances over the past years. This is initially a simplistic quick assumption which can be replaced with precise repayment ratios or amounts to override this calculation. The repayment is linked to the cashflow statement as well and interest is calculated on the average balances.
• Other Long Term Liabilities are forecasted based on a historical average ratio of this balance to bank loans.
• Share Capital is forecasted based on a plugged in capital increase (yellow cells in the financing section of the cash flow statement).
• Reserves are linked to previous balances, assumed to be constant, unless new values are plugged in, the model will assign changes to the reserves from retained earnings.
• Retained Earnings are linked to the profit generated from the income statement and the dividends paid. Those dividends are calculated in the equity ratios section based on historical plugins.
• Balancing the Balance Sheet: After all assumptions of the historical and plugged in as well any capital additions in the forecast, we must now balance the balance sheet. This involves recording either a surplus cash or covering deficits in financing using an overdraft. The first step is to reset the cash and overdrafts by clicking the macro button on top. The second step is to click the “cash and overdrafts iteration” button several times if needed until the balance sheet check shows zero balances on all years.
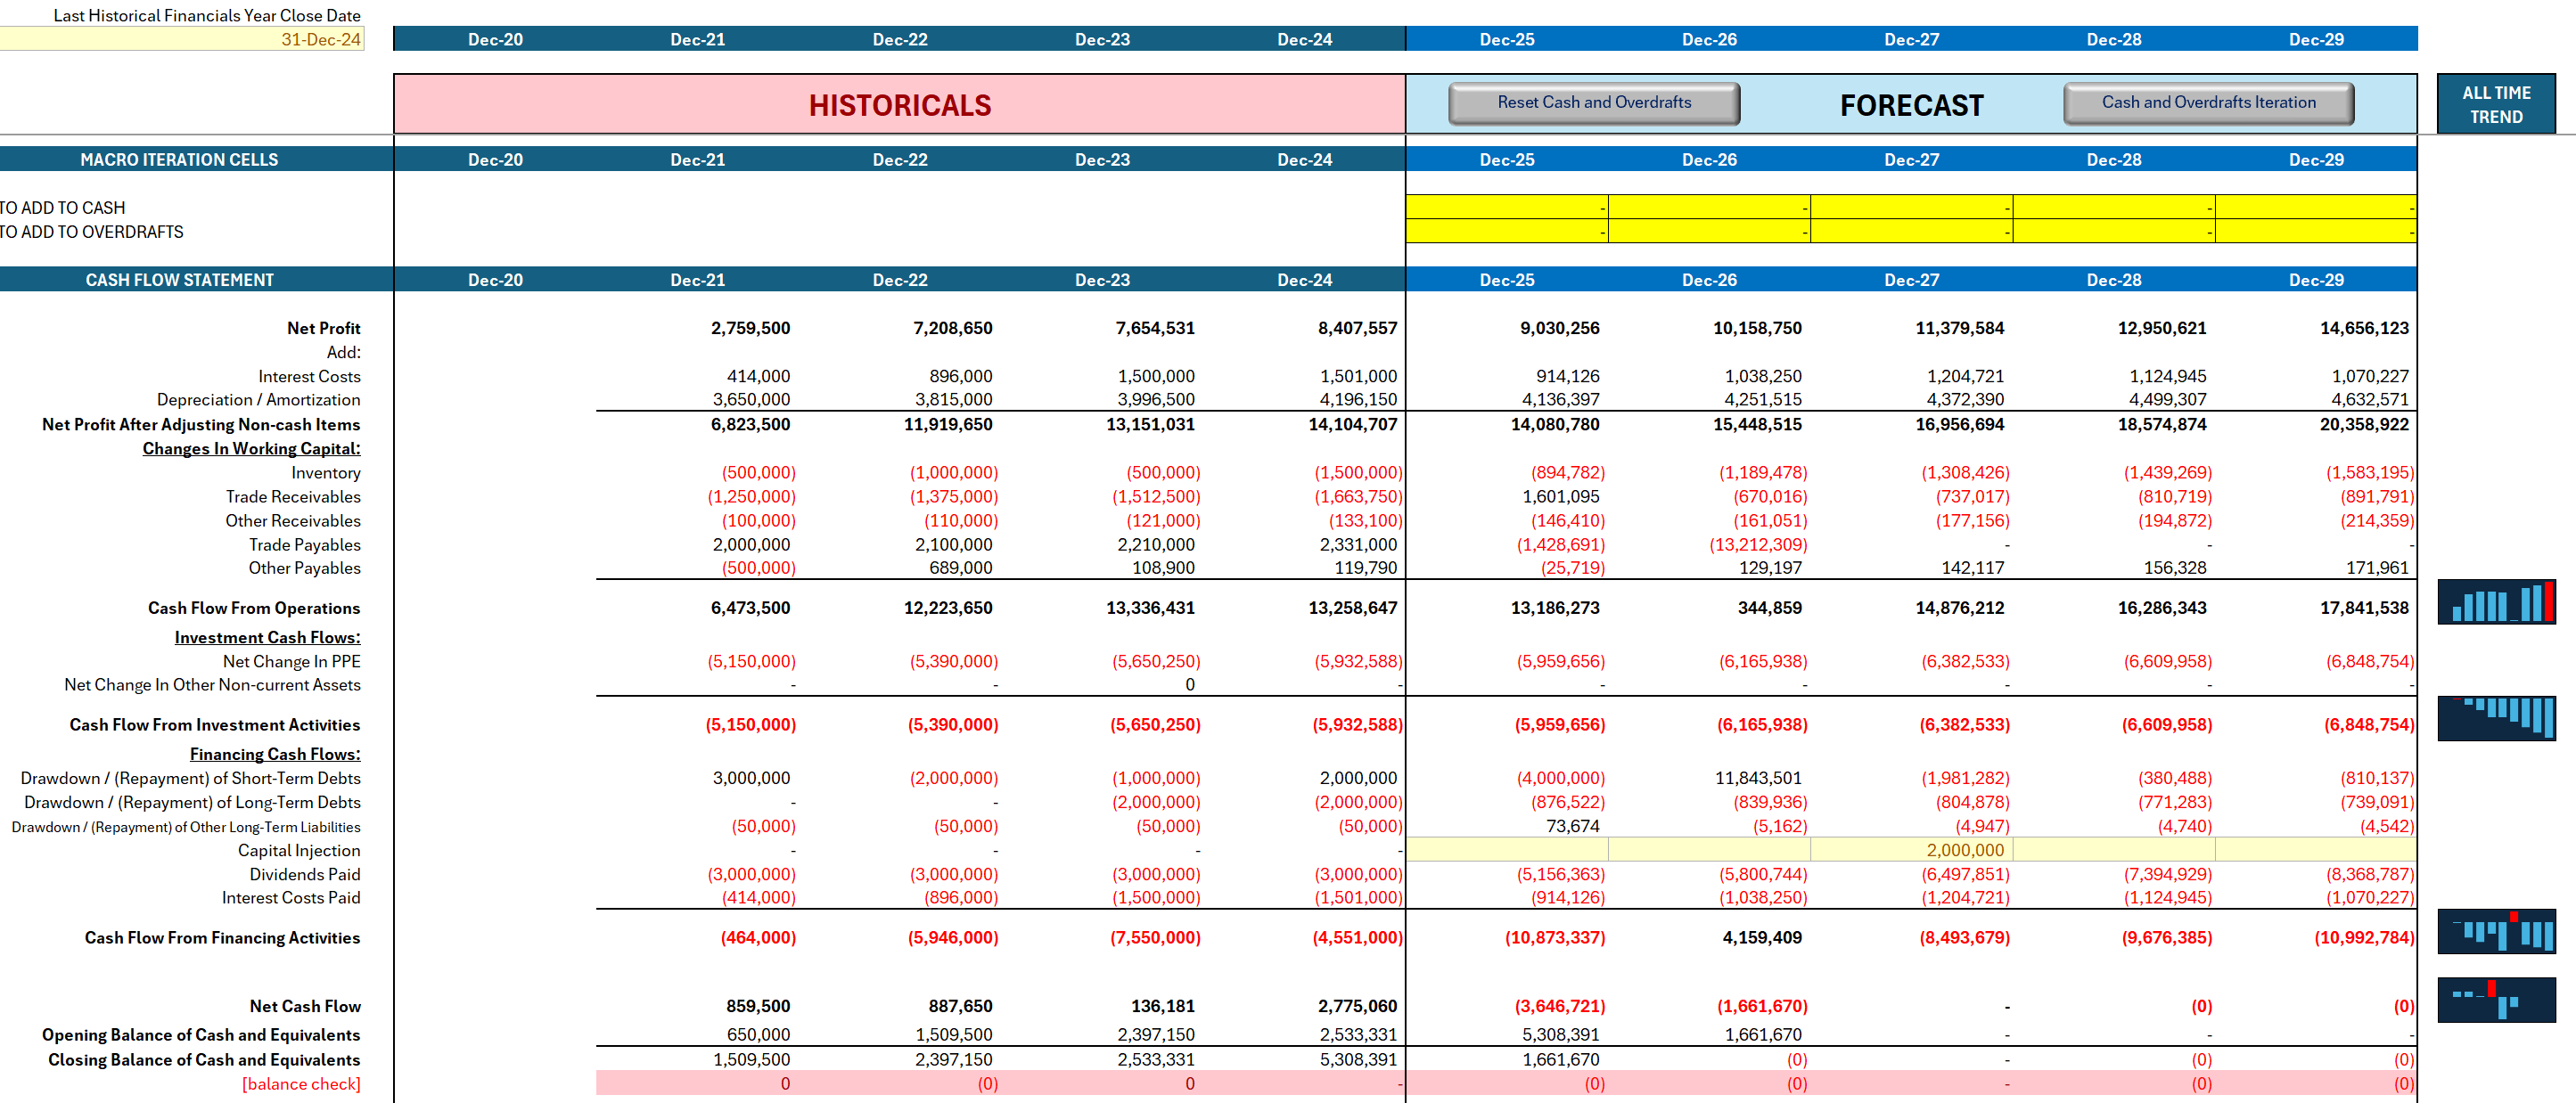
*** Cash Flow Statement ***
• The cash flow statement is a straight forward and standard format using the “indirect method” of calculating differences between balance sheet items and adding them to adjusted net profit after adding back non cash items like depreciation.
• The statement shows a balance check which should automatically show zeros once the balance sheet is balanced.
• The only input needed here is an assumed capital injection into the company for the forecast period.
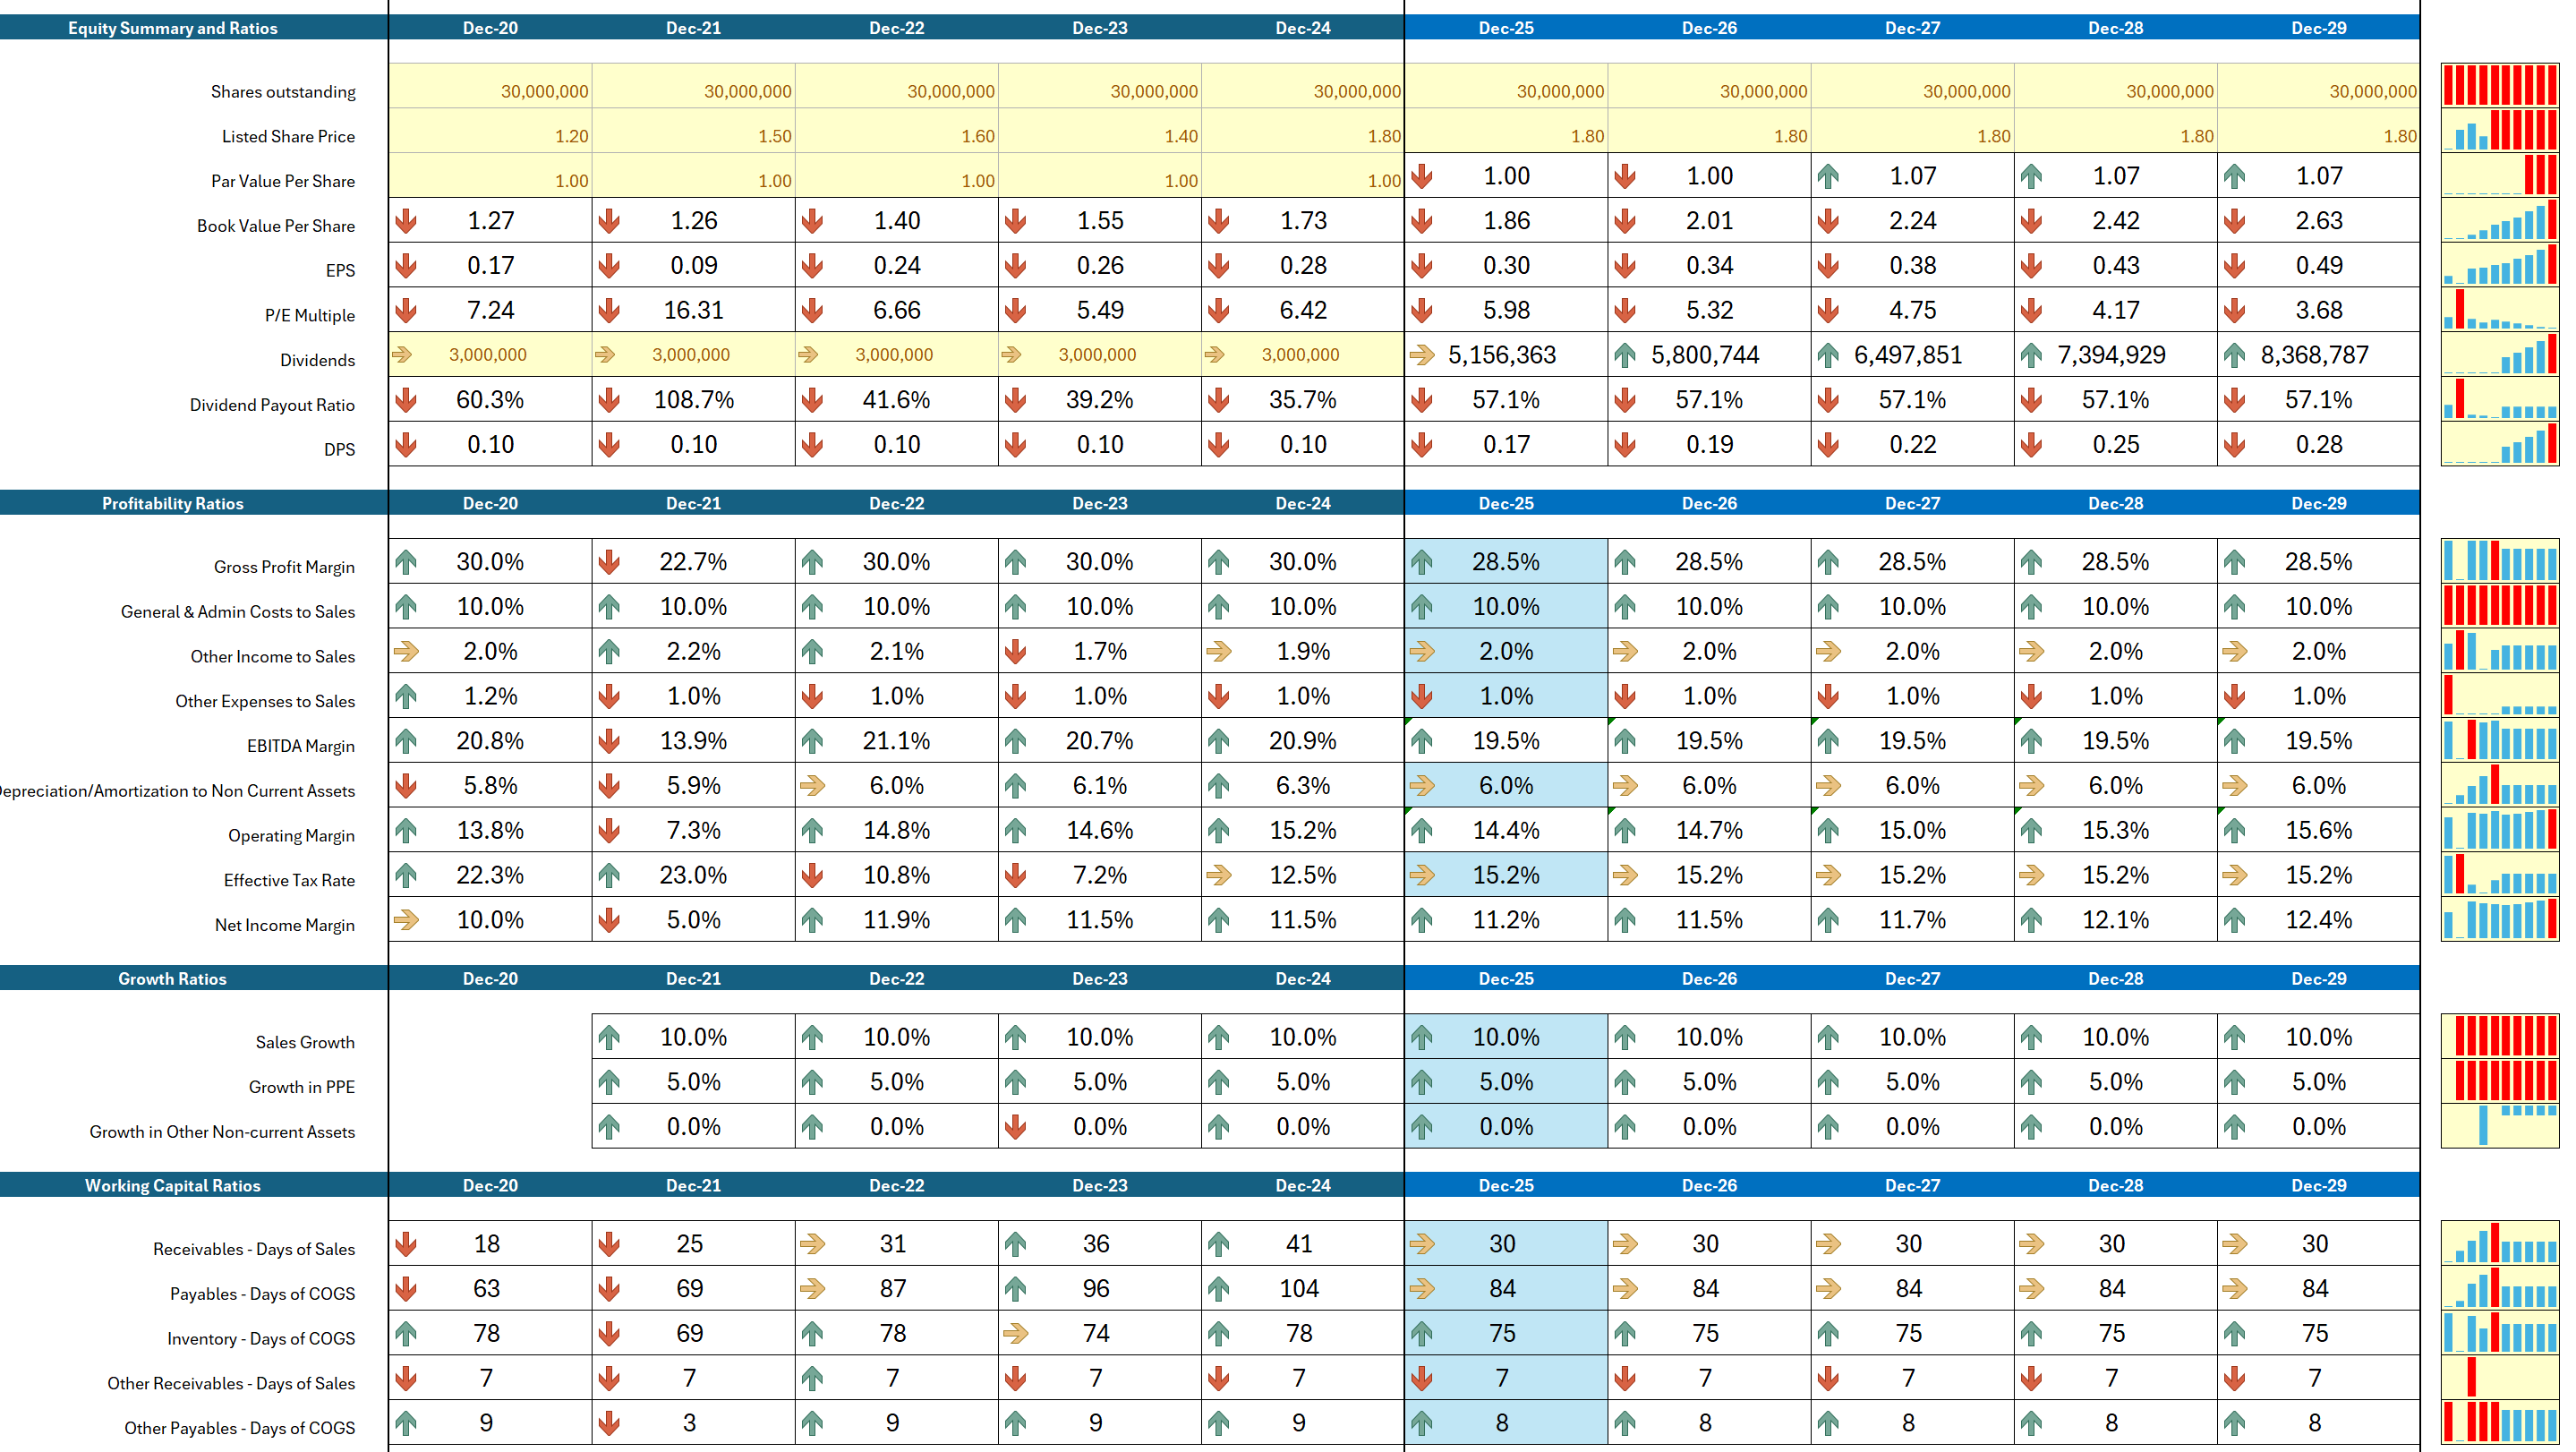
*** Equity Ratios ***
• Shares outstanding are plugged in for both the historical and forecast periods.
• The listed share price is plugged in for the historical period actuals, and an assumed forecast price per share is also plugged in.
• The par value per share is calculated based on the paid share capital divided by the number of shares.
• The book value per share is calculated based on the total equity divided by the number of shares.
• The earnings per share is calculated based on the net profit divided by the number of shares.
• The P/E multiple is calculated based on the assumed forecast price per share divided by the earnings per share.
• Dividends are calculated based on a projected average dividend payout ratio.
• The dividend payout ratio is based on the actual historical dividends plugged in the yellow historical dividends cells as a ratio to the annual profit.
*** Profitability Ratios ***
• Gross profit margin is based on the ratio of gross profit to sales. The historical average is used to project Cost of Sales.
• General and admin costs are shown as a ratio to sales. The historical average is used to project G&A costs.
• Other income is shown as a ratio to sales. The historical average is used to project other income.
• Depreciation is shown as a ratio to non-current assets. This is used to project depreciation expenses.
• EBITDA margin and Operating Margin are shown as a ratio to sales.
• The effective tax rate is calculated based on taxes as a ratio to EBT. This is used to forecast tax expenses.
*** Growth, Working Capital and Liquidity Ratios ***
• Sales are projected using an average for historical growth rates.
• Increase in PPE is projected using historical growth rates.
• Growth in other non-current assets is projected using historical growth rates.
• Receivables are other receivables days are calculated based on sales. The average historical number of days is assumed to continue for the forecast. While payables and other payables days are based on historical days of COGS.
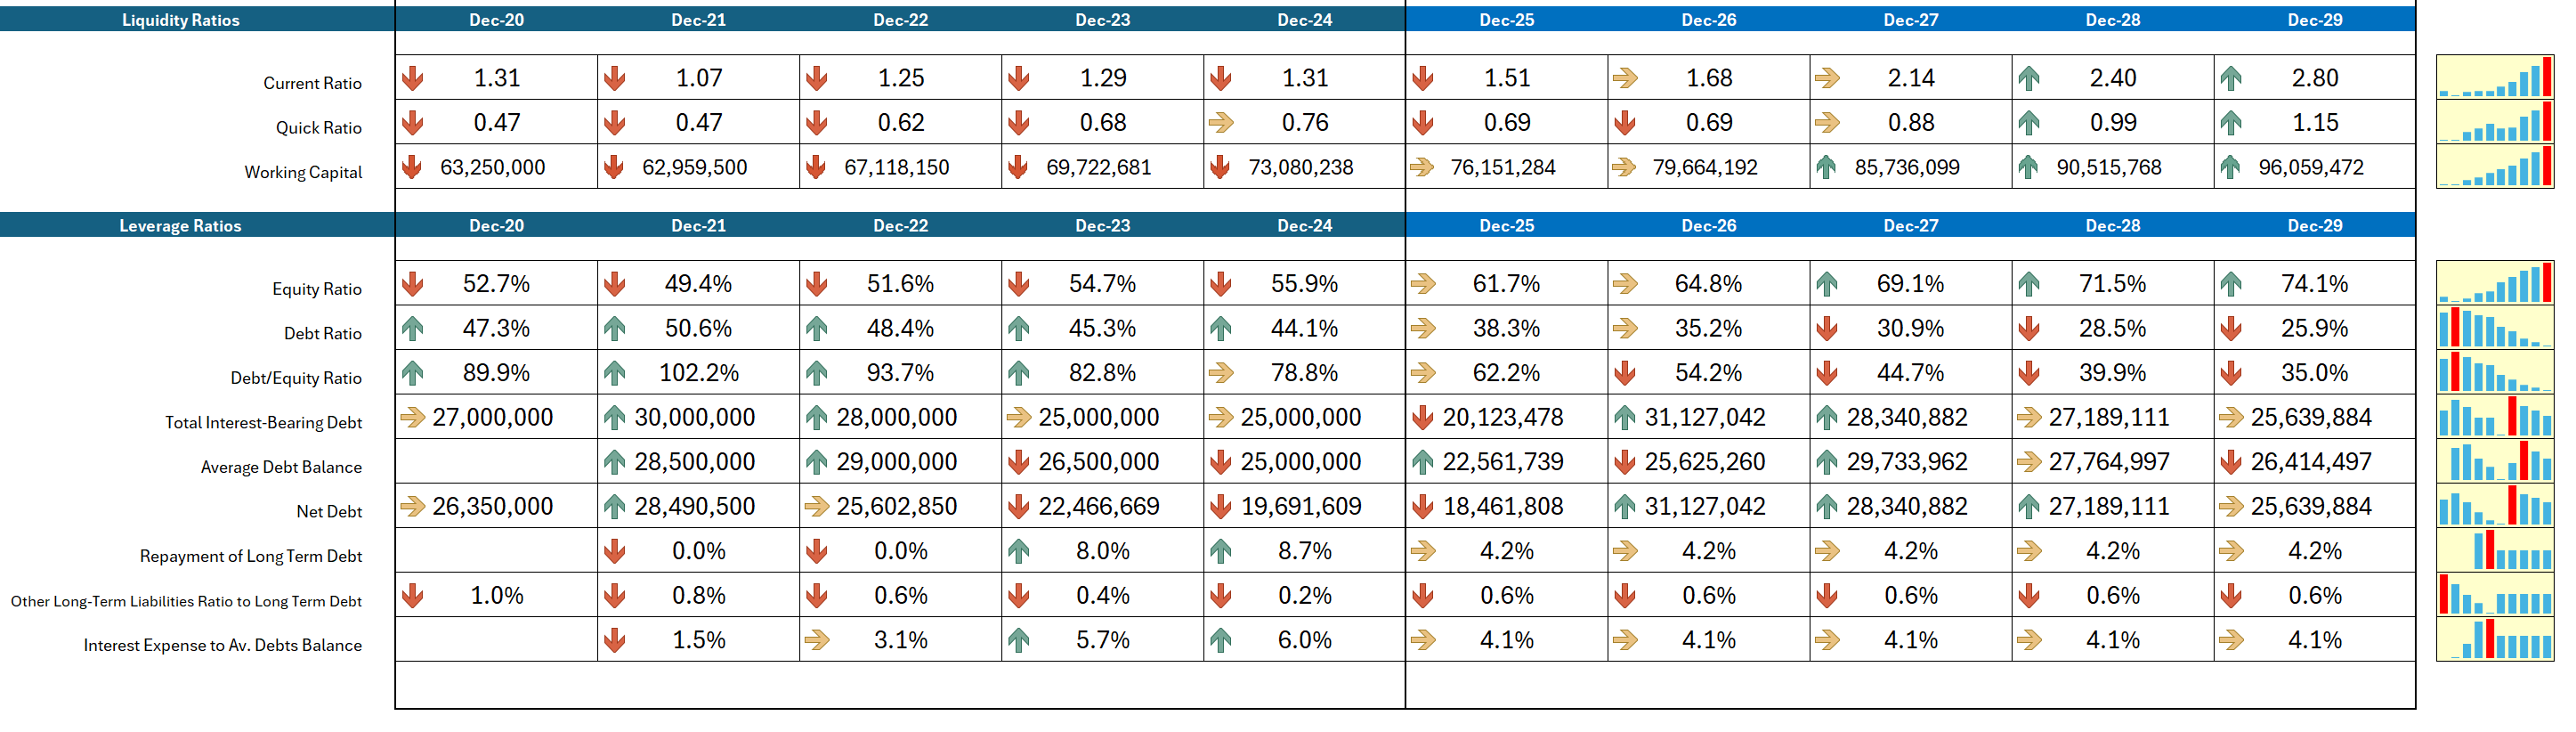
• Balance sheet liquidity ratios are calculated. Current ratio is based on current assets to current liabilities, while quick ratio excludes inventory.
• The size of the company’s working capital is shown for the historical and projections period.
*** Leverage Ratios ***
• The split between equity vs debt finance is shown from the equity and debt ratios separately as well as the multiple of debt to equity.
• The portion of liabilities relating to interest bearing debt is shown in this section as well as the average debt balance.
• The net debt of the company shows bank debts after deducting cash balances.
• The repayment of long term debt is shown as a percentage of the previous year balance. This is used to forecast repayments.
• Forecasting other long term liabilities was based on a ratio to long term debt.
• The ratio of interest to debts historically was used to project the interest rates applied going forward in the projections.
*** Model Overview ****
• Part of the roles of a financial analyst is evaluating investment opportunities. Such opportunities may be numerous and vary in complexity. The valuation methods however will include projecting the financial performance of a target asset in the future.
• Having a dynamic template to enable an analyst to quickly plugin historical statements and instantly produce a set of forecasted financial statements will add a lot of value and productivity to their work.
• Similarly, sometimes conducting a forecast for a company’s financials is required by finance institutions, investors and other creditors. It is also a useful business planning tool for a corporation.
*** Income Statement Forecast ***
• The income statement starts with forecasting sales. This is done based on the average year on year growth rate of historical sales in the past 5 years.
• COGS is then forecasted based on the historical average of gross profit margin.
• Other income, G&A expenses and other expenses are forecasted using their average ratio to sales in the past 5 years.
• Depreciation/Amortization is forecasted using an average ratio of this expense to the balance of non-current assets.
• Interest expense is forecasted based on the average cost of debt over the past 5 years and the average debt balance.
• Taxes are forecasted based on the average tax rate ratio of to EBT in the past 5 years.
*** Balance Sheet Forecast ***
• Non-current assets are forecasted using growth in Net Book Value of PPE and Other Non-Current Assets. The growth rates are found in the growth ratios section and based on the historical average.
• Inventory is forecasted using the historical average Inventory Days of COGS.
• Trade Receivables and Other Receivables are forecasted based on the historical average Days of Sales separately.
• Trade Payables and Other Payables are forecasted based on the historical average Days of COGS separately.
• Cash & Cash Equivalents and Overdrafts & Short-Term Debts are used as balancing figures for the forecast depending on the cash surplus or deficit in the forecast years.
• Banks Loans balances over the forecast are linked to a repayment ratio taken from average change in loan balances over the past years. This is initially a simplistic quick assumption which can be replaced with precise repayment ratios or amounts to override this calculation. The repayment is linked to the cashflow statement as well and interest is calculated on the average balances.
• Other Long Term Liabilities are forecasted based on a historical average ratio of this balance to bank loans.
• Share Capital is forecasted based on a plugged in capital increase (yellow cells in the financing section of the cash flow statement).
• Reserves are linked to previous balances, assumed to be constant, unless new values are plugged in, the model will assign changes to the reserves from retained earnings.
• Retained Earnings are linked to the profit generated from the income statement and the dividends paid. Those dividends are calculated in the equity ratios section based on historical plugins.
• Balancing the Balance Sheet: After all assumptions of the historical and plugged in as well any capital additions in the forecast, we must now balance the balance sheet. This involves recording either a surplus cash or covering deficits in financing using an overdraft. The first step is to reset the cash and overdrafts by clicking the macro button on top. The second step is to click the “cash and overdrafts iteration” button several times if needed until the balance sheet check shows zero balances on all years.
*** Cash Flow Statement ***
• The cash flow statement is a straight forward and standard format using the “indirect method” of calculating differences between balance sheet items and adding them to adjusted net profit after adding back non cash items like depreciation.
• The statement shows a balance check which should automatically show zeros once the balance sheet is balanced.
• The only input needed here is an assumed capital injection into the company for the forecast period.
*** Equity Ratios ***
• Shares outstanding are plugged in for both the historical and forecast periods.
• The listed share price is plugged in for the historical period actuals, and an assumed forecast price per share is also plugged in.
• The par value per share is calculated based on the paid share capital divided by the number of shares.
• The book value per share is calculated based on the total equity divided by the number of shares.
• The earnings per share is calculated based on the net profit divided by the number of shares.
• The P/E multiple is calculated based on the assumed forecast price per share divided by the earnings per share.
• Dividends are calculated based on a projected average dividend payout ratio.
• The dividend payout ratio is based on the actual historical dividends plugged in the yellow historical dividends cells as a ratio to the annual profit.
*** Profitability Ratios ***
• Gross profit margin is based on the ratio of gross profit to sales. The historical average is used to project Cost of Sales.
• General and admin costs are shown as a ratio to sales. The historical average is used to project G&A costs.
• Other income is shown as a ratio to sales. The historical average is used to project other income.
• Depreciation is shown as a ratio to non-current assets. This is used to project depreciation expenses.
• EBITDA margin and Operating Margin are shown as a ratio to sales.
• The effective tax rate is calculated based on taxes as a ratio to EBT. This is used to forecast tax expenses.
*** Growth, Working Capital and Liquidity Ratios ***
• Sales are projected using an average for historical growth rates.
• Increase in PPE is projected using historical growth rates.
• Growth in other non-current assets is projected using historical growth rates.
• Receivables are other receivables days are calculated based on sales. The average historical number of days is assumed to continue for the forecast. While payables and other payables days are based on historical days of COGS.
• Balance sheet liquidity ratios are calculated. Current ratio is based on current assets to current liabilities, while quick ratio excludes inventory.
• The size of the company’s working capital is shown for the historical and projections period.
*** Leverage Ratios ***
• The split between equity vs debt finance is shown from the equity and debt ratios separately as well as the multiple of debt to equity.
• The portion of liabilities relating to interest bearing debt is shown in this section as well as the average debt balance.
• The net debt of the company shows bank debts after deducting cash balances.
• The repayment of long term debt is shown as a percentage of the previous year balance. This is used to forecast repayments.
• Forecasting other long term liabilities was based on a ratio to long term debt.
• The ratio of interest to debts historically was used to project the interest rates applied going forward in the projections.
This Best Practice includes
1 excel file (office 365 required) and 1 pdf file manual
Further information
The objective of this model is to increase the productivity of financial analysts and modelers in quickly creating a base case forecast for a company on which they are conducting a review or valuation. The model quickly converts historical statements to projected ones using smart ratio assumptions.
this model requires enabling macros and using the latest version of excel 365
