
Originally published: 09/09/2021 08:17
Publication number: ELQ-41455-1
View all versions & Certificate
Publication number: ELQ-41455-1
View all versions & Certificate

Fast Food Chain Financial Model
The financial model presents the business case of a startup fast-food chain. The model accommodates up to 20 outlets with business and financial assumptions.
fast foodfast food chainfinancial modelexcelthree statementsdcfinternal rate of returnstart-upfoodhospitality
Description
The financial model presents the business case of a startup fast-food chain. The model accommodates up to 20 outlets with business and financial assumptions for each outlet.
This financial model template will enable you to:
- Plan the sources of monetization from each store and decide whether to continue operating or close the store
- Forecast the revenues
- Analyze the direct costs for running the outlets.
- Setting up payroll costs, and operating expenses.
- Set the initial investment amount and the equipment needed
- Set the relevant currency and timing
- Create the three financial statements (Profit and Loss, Balance Sheet and Cash Flow) monthly for 60 months.
- Financial Ratios to check the viability of your business
- Valuation with Free Cash Flows to the firm to get a ballpark figure of the value of your business
- Graphs and charts you can use in your presentations
- Dashboard to check the plan for each of your stores
- Printable model as PDF for your investors
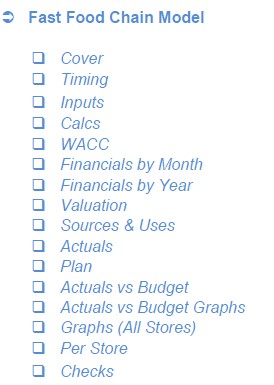
So, a quick overview of the model, in the contents tab you can see the structure of the model and by clicking on any of the headlines to be redirected to the relevant worksheet.
On the timing tab you can feed the general information for the model such as: model name, responsible, timeline of the model and date and currency conventions.
Additionally, there is a description of the color coding of the model in the same tab. Inputs are always depicted with a yellow fill and blue letters, call ups (that is direct links from other cells) are filled in light blue with blue letters while calculations are depicted with white fill and black characters.
There is also a color coding for the various tabs of the model. Yellow tabs are mostly assumptions tabs, grey tabs are calculations tabs, blue tabs are outputs tabs (that is effectively results or graphs) and finally light blue tabs are admin tabs (for example: the cover page, contents, and checks).
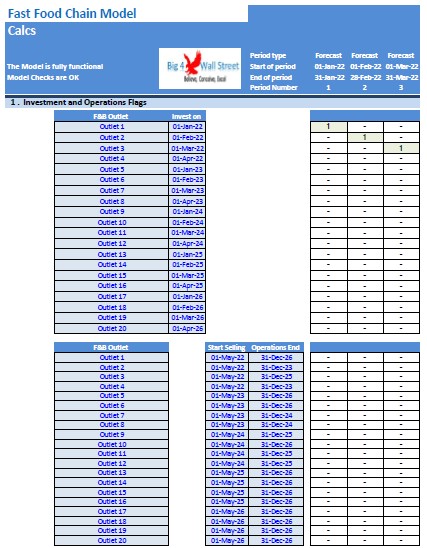
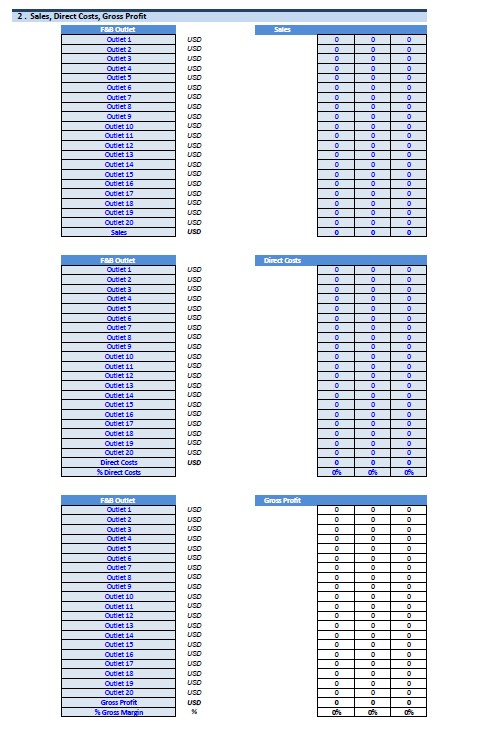
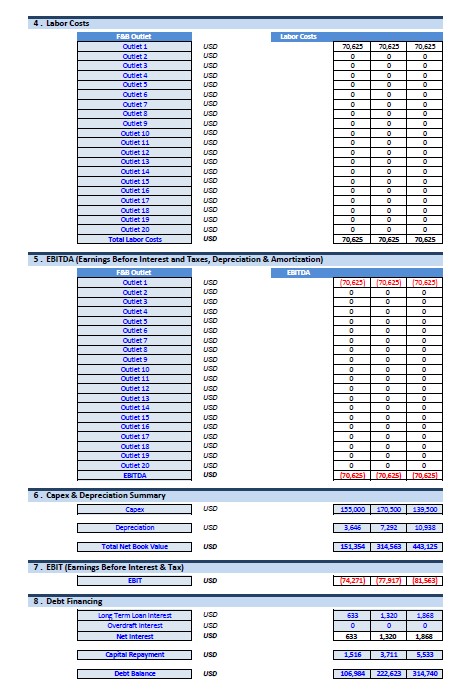
Moving on to the inputs tab, you can adjust the various assumptions of the model based on the specifications and requirements of your business. So effectively you can adjust the detailed revenue assumptions and the user can amend the most important drivers such as: investing month, operations start, operations end, sales seasonality and food and drink sales for each outlet. Moving on, the cost is comprised of three main categories: direct costs (for food and drinks), fixed and variable non labor cost (rent, utilities, insurance, advertising, other, etc.), labor cost for both stores and headquarters (headcount, salaries, employment costs and other benefits). Going forward you can adjust noncurrent assets, capex as well as their depreciation schedule, the working capital assumptions (inventory, receivables, and payables) can also be adjusted accordingly and finally the financing assumptions of the business whether these are debt or equity financed can also be amended.
On the calculation tab, all calculations are performed instantly without the need of an excel macro. The calculations follow the same logical flow as the in the inputs tab. As already mentioned, no inputs from the use are needed here, as all the inputs are fed in the yellow cells on the inputs tab only.
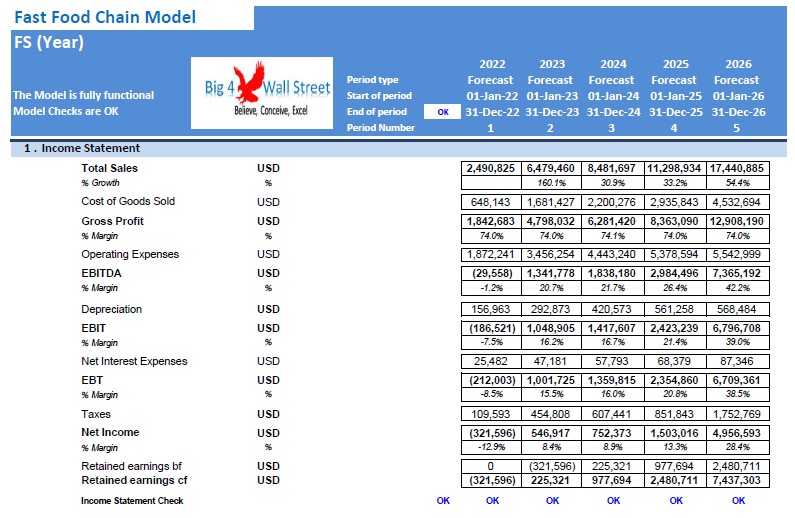
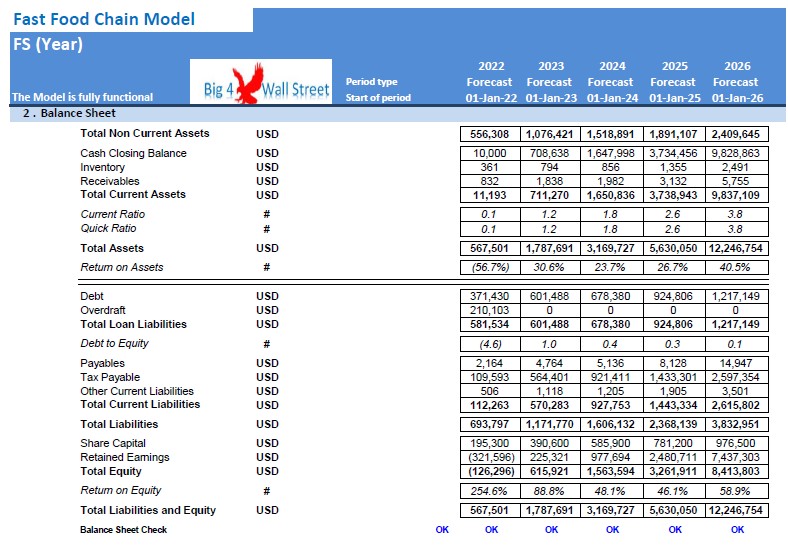
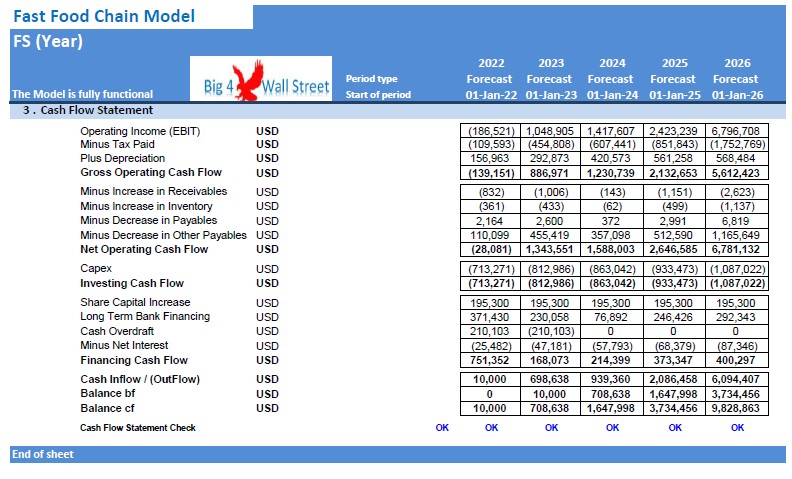
On the Financial Statements tabs you can see the resulting income statement, balance sheet as well as the cash flow of the company and or project. These financial statements are generated on a monthly as well as on a yearly basis.
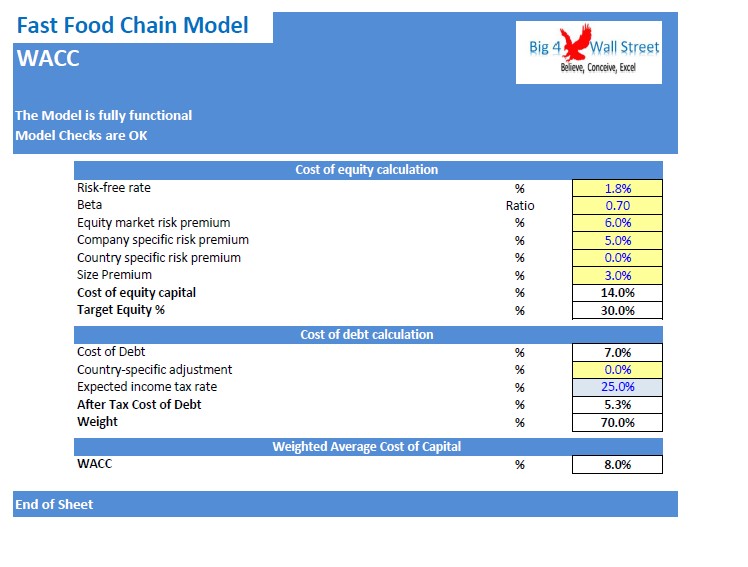
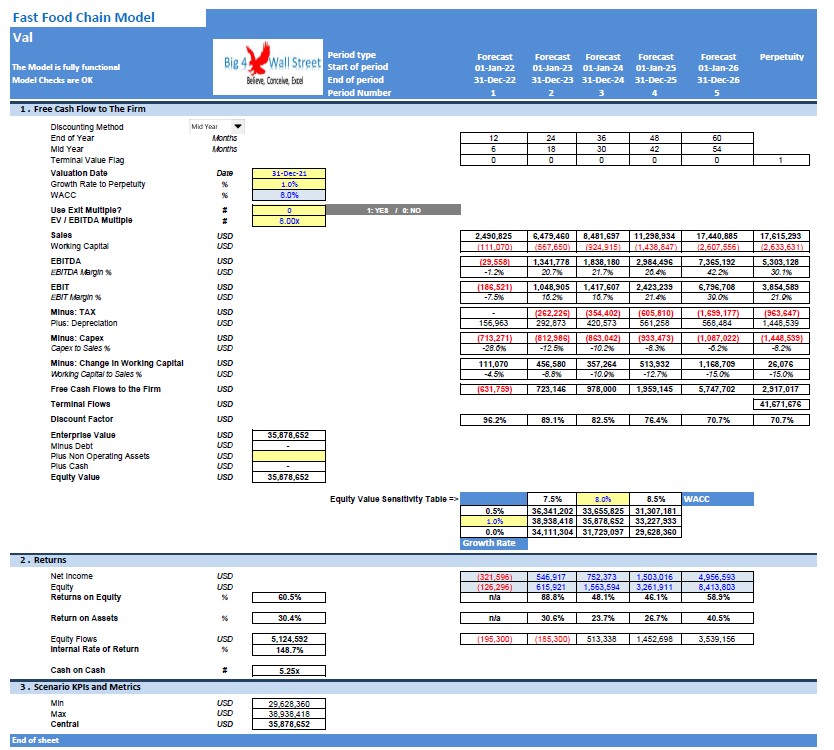
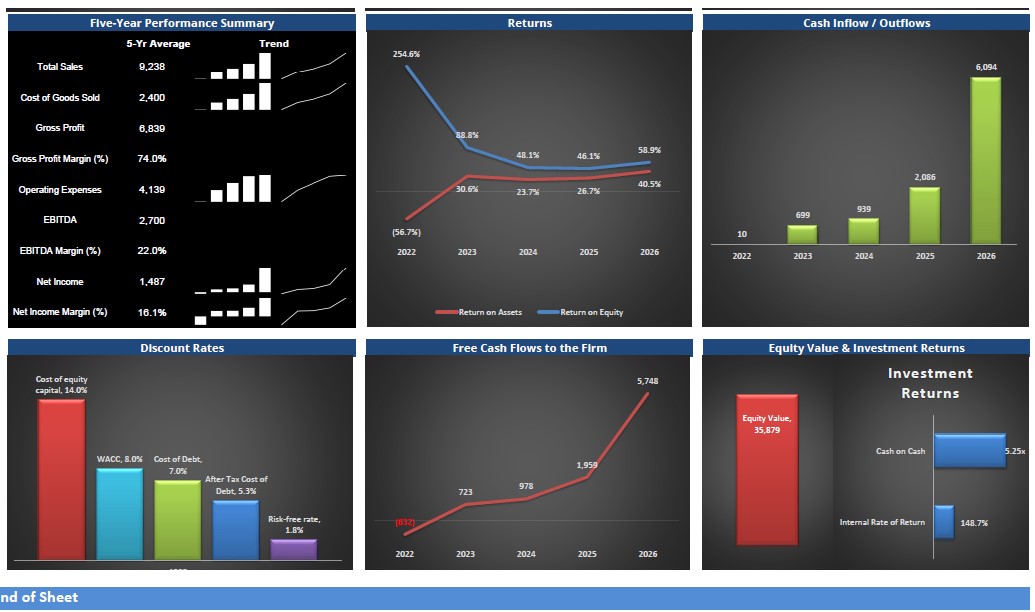
In the Valuation tab, the valuation of the company is performed based on the free cash flows to the firm. In the same tab you can also find some feasibility metrics such as Return on Equity, Return on Assets, Internal Rate of Return and Cash on Cash Multiple. On the same tab various ratios and margins are presented.
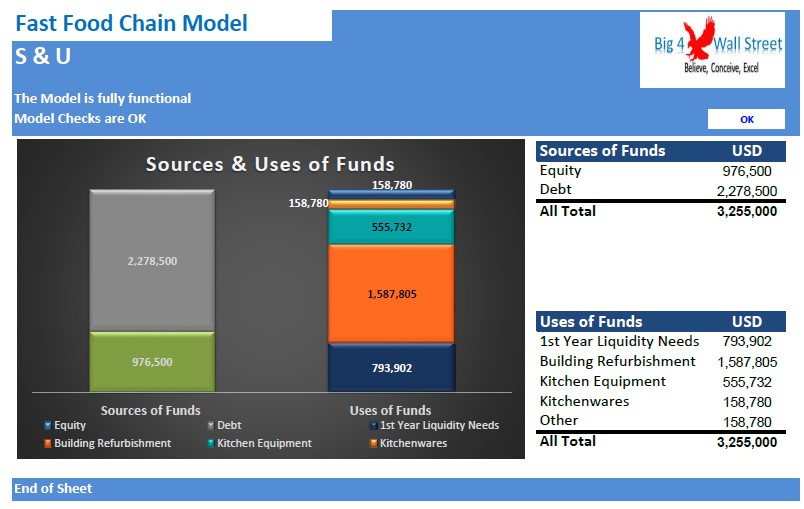
In the Sources and Uses tab, the user is presented with the sources of financing, and how the funds are used in the business.
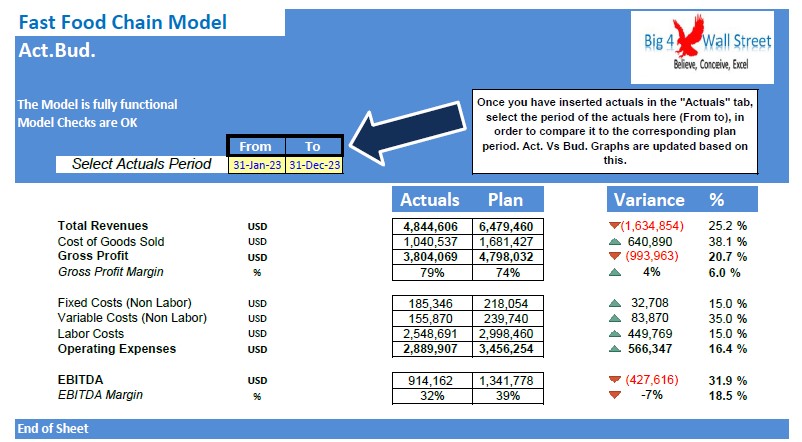
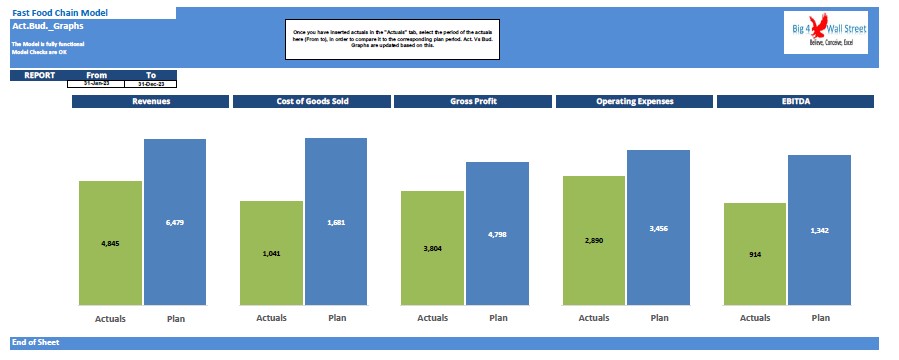
In the Actual tab the user needs to set the actual figures from the operations of the business in the yellow cells, then these inputs are compared with the planned figures in the Plan tab. In the Actual versus Budget tab, the user can select the period he desires to compare actuals with planned values. The comparison of the actuals versus planned values in terms of absolute and percentage variation is presented in the columns K and M. The same comparison with a graphical representation can be found on the next tab with the Actual versus Budget Graphs.
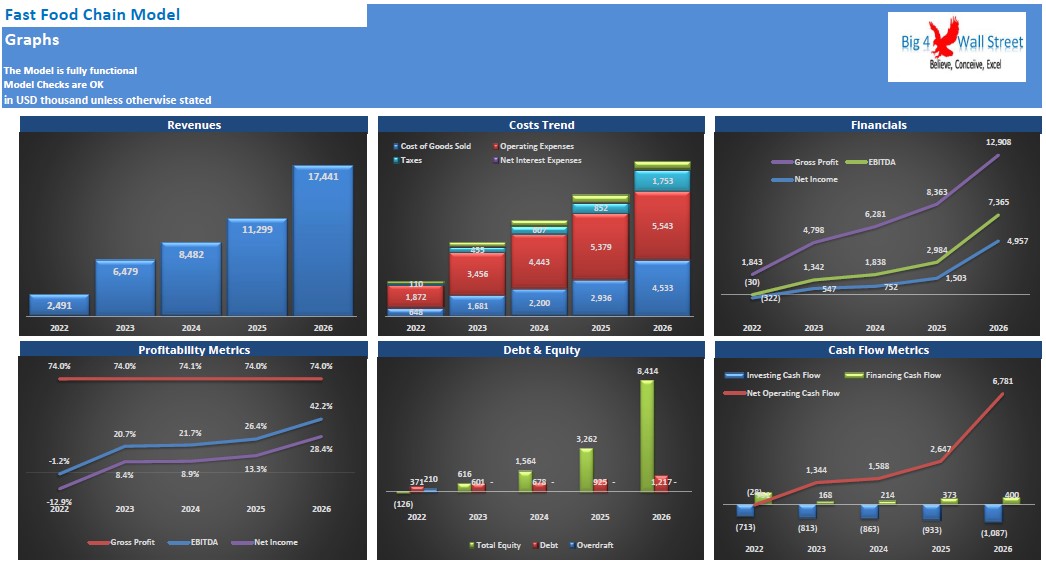
The most important business and financial KPIs in the Graphs tab. For example: Revenues Costs, Financials, Profitability, Debt and Equity, Cash Flows as well as discount rates, valuation and returns.
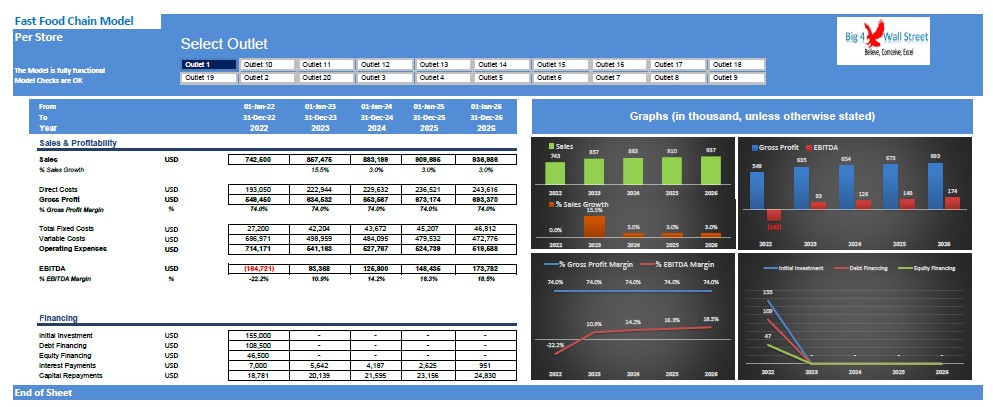
On the Per Store tab, the user is able to select any combination of outlets stores and see the sales and profitability of each store (sales, gross profit, EBITDA, Net Income) as well as its financing (investment, debt, equity, interest, repayments).
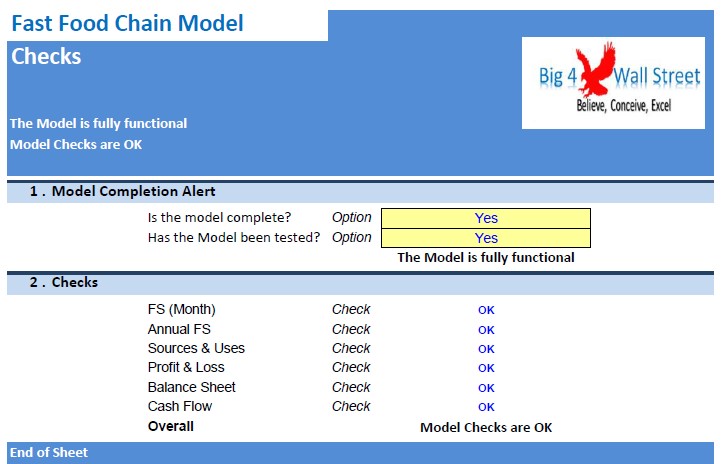
Finally the checks tab where the most critical checks are aggregated in this page. Whenever you see an error message in any page, you should consult this page to see where the error is coming from.
The financial model presents the business case of a startup fast-food chain. The model accommodates up to 20 outlets with business and financial assumptions for each outlet.
This financial model template will enable you to:
- Plan the sources of monetization from each store and decide whether to continue operating or close the store
- Forecast the revenues
- Analyze the direct costs for running the outlets.
- Setting up payroll costs, and operating expenses.
- Set the initial investment amount and the equipment needed
- Set the relevant currency and timing
- Create the three financial statements (Profit and Loss, Balance Sheet and Cash Flow) monthly for 60 months.
- Financial Ratios to check the viability of your business
- Valuation with Free Cash Flows to the firm to get a ballpark figure of the value of your business
- Graphs and charts you can use in your presentations
- Dashboard to check the plan for each of your stores
- Printable model as PDF for your investors
So, a quick overview of the model, in the contents tab you can see the structure of the model and by clicking on any of the headlines to be redirected to the relevant worksheet.
On the timing tab you can feed the general information for the model such as: model name, responsible, timeline of the model and date and currency conventions.
Additionally, there is a description of the color coding of the model in the same tab. Inputs are always depicted with a yellow fill and blue letters, call ups (that is direct links from other cells) are filled in light blue with blue letters while calculations are depicted with white fill and black characters.
There is also a color coding for the various tabs of the model. Yellow tabs are mostly assumptions tabs, grey tabs are calculations tabs, blue tabs are outputs tabs (that is effectively results or graphs) and finally light blue tabs are admin tabs (for example: the cover page, contents, and checks).
Moving on to the inputs tab, you can adjust the various assumptions of the model based on the specifications and requirements of your business. So effectively you can adjust the detailed revenue assumptions and the user can amend the most important drivers such as: investing month, operations start, operations end, sales seasonality and food and drink sales for each outlet. Moving on, the cost is comprised of three main categories: direct costs (for food and drinks), fixed and variable non labor cost (rent, utilities, insurance, advertising, other, etc.), labor cost for both stores and headquarters (headcount, salaries, employment costs and other benefits). Going forward you can adjust noncurrent assets, capex as well as their depreciation schedule, the working capital assumptions (inventory, receivables, and payables) can also be adjusted accordingly and finally the financing assumptions of the business whether these are debt or equity financed can also be amended.
On the calculation tab, all calculations are performed instantly without the need of an excel macro. The calculations follow the same logical flow as the in the inputs tab. As already mentioned, no inputs from the use are needed here, as all the inputs are fed in the yellow cells on the inputs tab only.
On the Financial Statements tabs you can see the resulting income statement, balance sheet as well as the cash flow of the company and or project. These financial statements are generated on a monthly as well as on a yearly basis.
In the Valuation tab, the valuation of the company is performed based on the free cash flows to the firm. In the same tab you can also find some feasibility metrics such as Return on Equity, Return on Assets, Internal Rate of Return and Cash on Cash Multiple. On the same tab various ratios and margins are presented.
In the Sources and Uses tab, the user is presented with the sources of financing, and how the funds are used in the business.
In the Actual tab the user needs to set the actual figures from the operations of the business in the yellow cells, then these inputs are compared with the planned figures in the Plan tab. In the Actual versus Budget tab, the user can select the period he desires to compare actuals with planned values. The comparison of the actuals versus planned values in terms of absolute and percentage variation is presented in the columns K and M. The same comparison with a graphical representation can be found on the next tab with the Actual versus Budget Graphs.
The most important business and financial KPIs in the Graphs tab. For example: Revenues Costs, Financials, Profitability, Debt and Equity, Cash Flows as well as discount rates, valuation and returns.
On the Per Store tab, the user is able to select any combination of outlets stores and see the sales and profitability of each store (sales, gross profit, EBITDA, Net Income) as well as its financing (investment, debt, equity, interest, repayments).
Finally the checks tab where the most critical checks are aggregated in this page. Whenever you see an error message in any page, you should consult this page to see where the error is coming from.
This Best Practice includes
1 Excel and 1 PDF
Further information
Calculate financial statements, valuation, graphs, per store analysis and actual versus budget for a fast food chain business.
