




Small Hydropower Bankable Financial Model
Originally published: 17/07/2026 13:08
Publication number: ELQ-74584-1
View all versions & Certificate
certified

Small Hydropower Bankable Financial Model

Bankable Excel model for run-of-river hydropower: hydrology to returns.

Description
Small Hydropower Bankable Financial Model

A Fully-Integrated, Lender-Ready
Excel Model for Run-of-River Hydropower Projects

Overview

This workbook is a complete, professionally structured financial model built to the standard expected by international lenders, development finance institutions, and equity investors evaluating a small run-of-river hydropower project. It is designed to function as the analytical backbone of a project finance transaction — the single source of truth that technical advisors, lenders' engineers, tax advisors, and sponsors can all interrogate, stress-test, and rely upon during due diligence.
Unlike simplified feasibility spreadsheets that jump straight from a capacity assumption to a revenue line, this model builds every output from first principles. Hydrology drives energy production; energy production drives revenue; revenue, cost, and financing structure together drive the cash flow waterfall; and the cash flow waterfall drives the returns that ultimately determine whether the project is bankable. Every number on every sheet can be traced backward to a stated assumption, and every assumption is visible, editable, and clearly flagged as an input rather than a calculation.

The model spans a 27-year timeline — a 2-year construction period followed by 25 years of commercial operation — modelled entirely in annual periods with monthly granularity reserved for the hydrological and energy computations where it matters most.

Why This Model Exists
Small hydropower projects occupy an awkward middle ground in project finance. They are too small to justify the multi-million-dollar modelling budgets of large infrastructure deals, yet they carry the same fundamental risks — hydrological uncertainty, construction cost overrun, interest rate exposure, and debt service coverage — that any lender will scrutinize closely before committing capital. This model closes that gap. It gives a small hydro sponsor, developer, or advisory team an institutional-grade tool without the six-figure modelling engagement, while remaining fully transparent and auditable — no black boxes, no hidden macros, no proprietary add-ins.

It is equally useful in several contexts:
  • Project sponsors preparing a bankable feasibility study or information memorandum for lenders and equity partners
  • Financial advisors and consultants who need a robust starting template they can recalibrate quickly to a new site's hydrology and cost profile
  • Lenders and their independent engineers who want a transparent model they can pressure-test line by line during due diligence
  • Academic and training contexts, where the model serves as a teaching tool for project finance, renewable energy economics, or infrastructure modelling courses

Structural Philosophy
The model follows the conventions that lenders and rating agencies expect to see in any bankable infrastructure model:
  • Color-coded cell logic — blue for hardcoded inputs, black for formulas, green for cross-sheet links — so that any reviewer can immediately distinguish an assumption from a calculation without opening each cell
  • A single, consistent timeline running across every operating sheet, so that column E on the Debt sheet, the Revenue sheet, and the Cashflow sheet all refer to the same operating year
  • No circular references — interest expense is calculated on opening debt balances rather than average balances, a deliberate simplification that keeps the model stable and fast to recalculate without iterative calculation settings
  • Full traceability — every output on the Returns sheet can be followed back through the P&L, Cashflow, Debt, Revenue, and Energy sheets to the original technical or commercial assumption that produced it
  • An embedded audit trail — a dedicated Model Checks sheet runs eight automated integrity tests every time the model recalculates, so errors introduced by future edits are caught immediately rather than discovered during a lender's review

What the Model Covers, Sheet by Sheet

Cover — A project summary and full table of contents, establishing the currency, modelling basis, and financing structure at a glance.

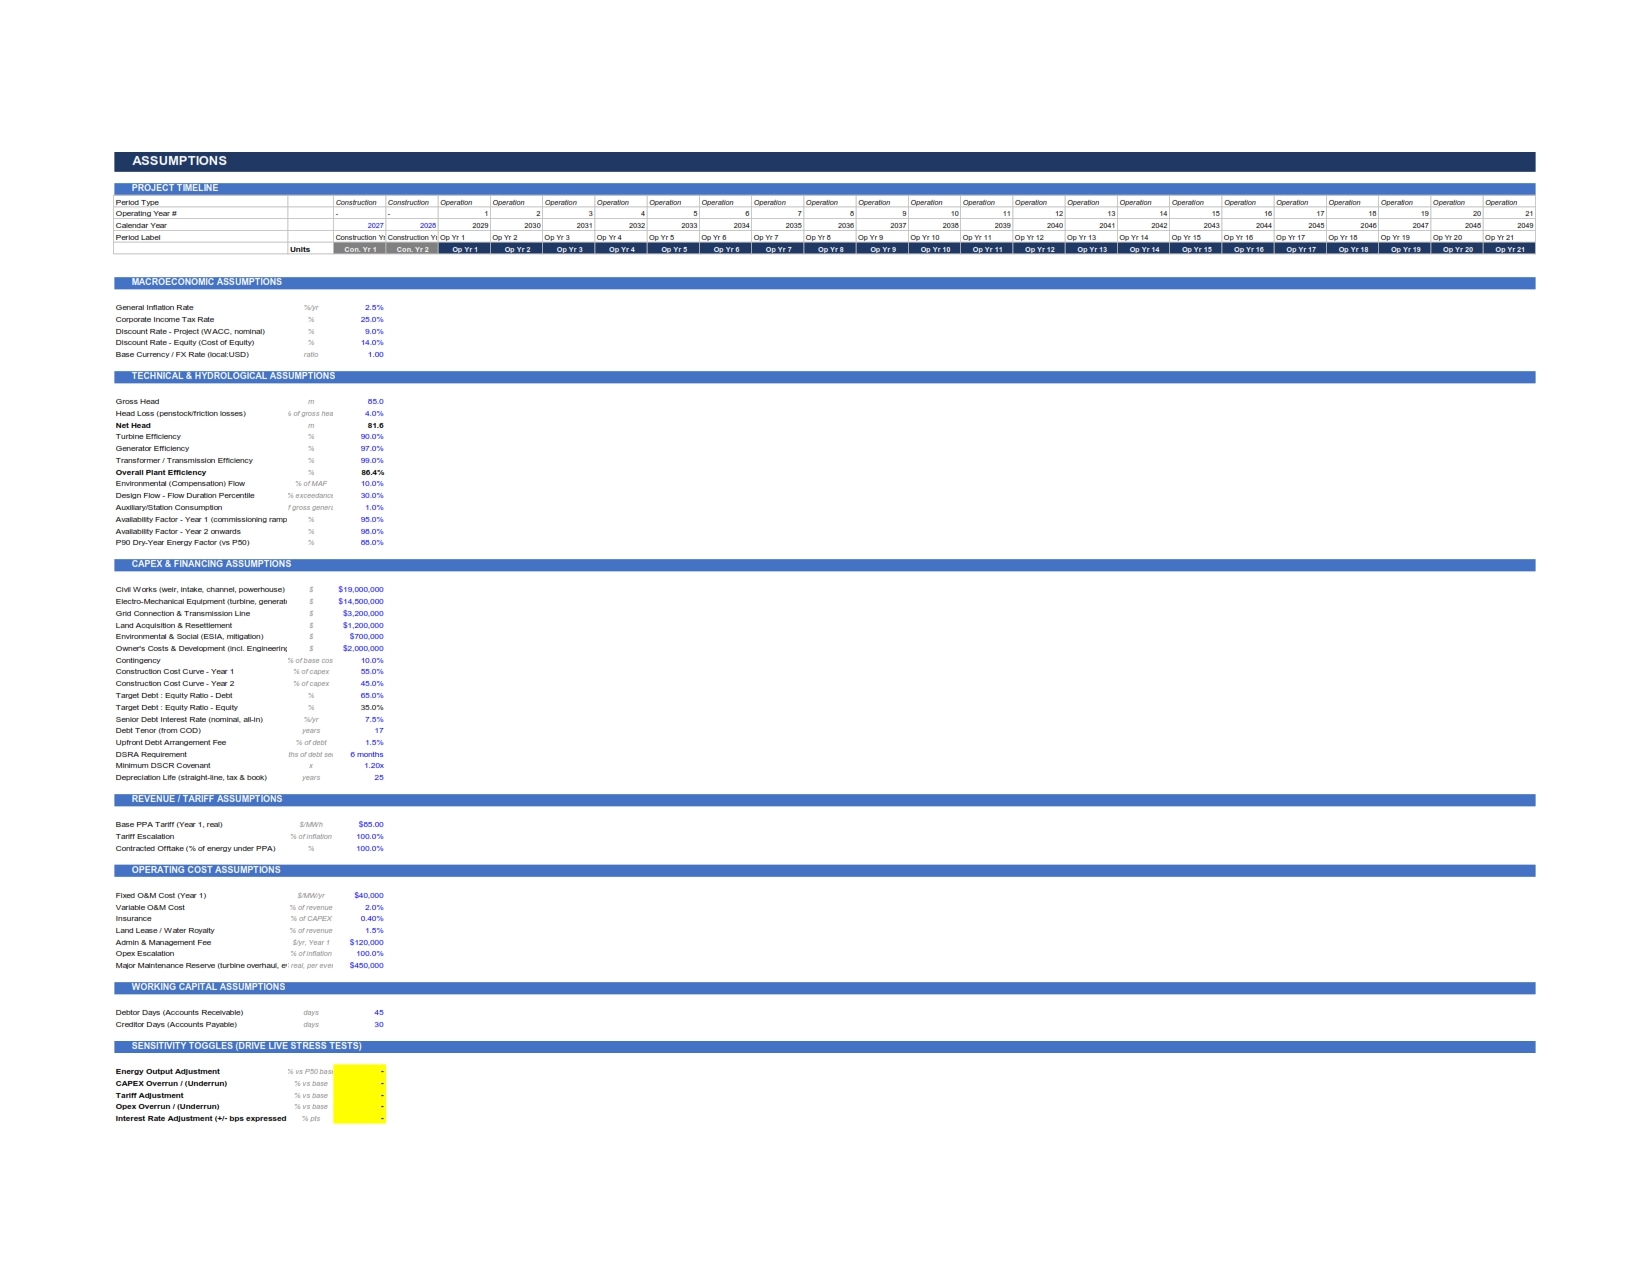
Assumptions — The single control panel for the entire model: macroeconomic parameters (inflation, tax, discount rates), technical and hydrological parameters (gross head, head losses, turbine and generator efficiency, environmental flow policy, design flow percentile), CAPEX and financing parameters (cost build-up, gearing, tenor, interest rate, DSRA requirement, minimum DSCR covenant), and revenue and operating cost assumptions. A dedicated block of five sensitivity toggle cells allows a user to stress-test energy output, CAPEX, tariff, opex, and interest rate assumptions live, with the effect flowing through every downstream sheet instantly.

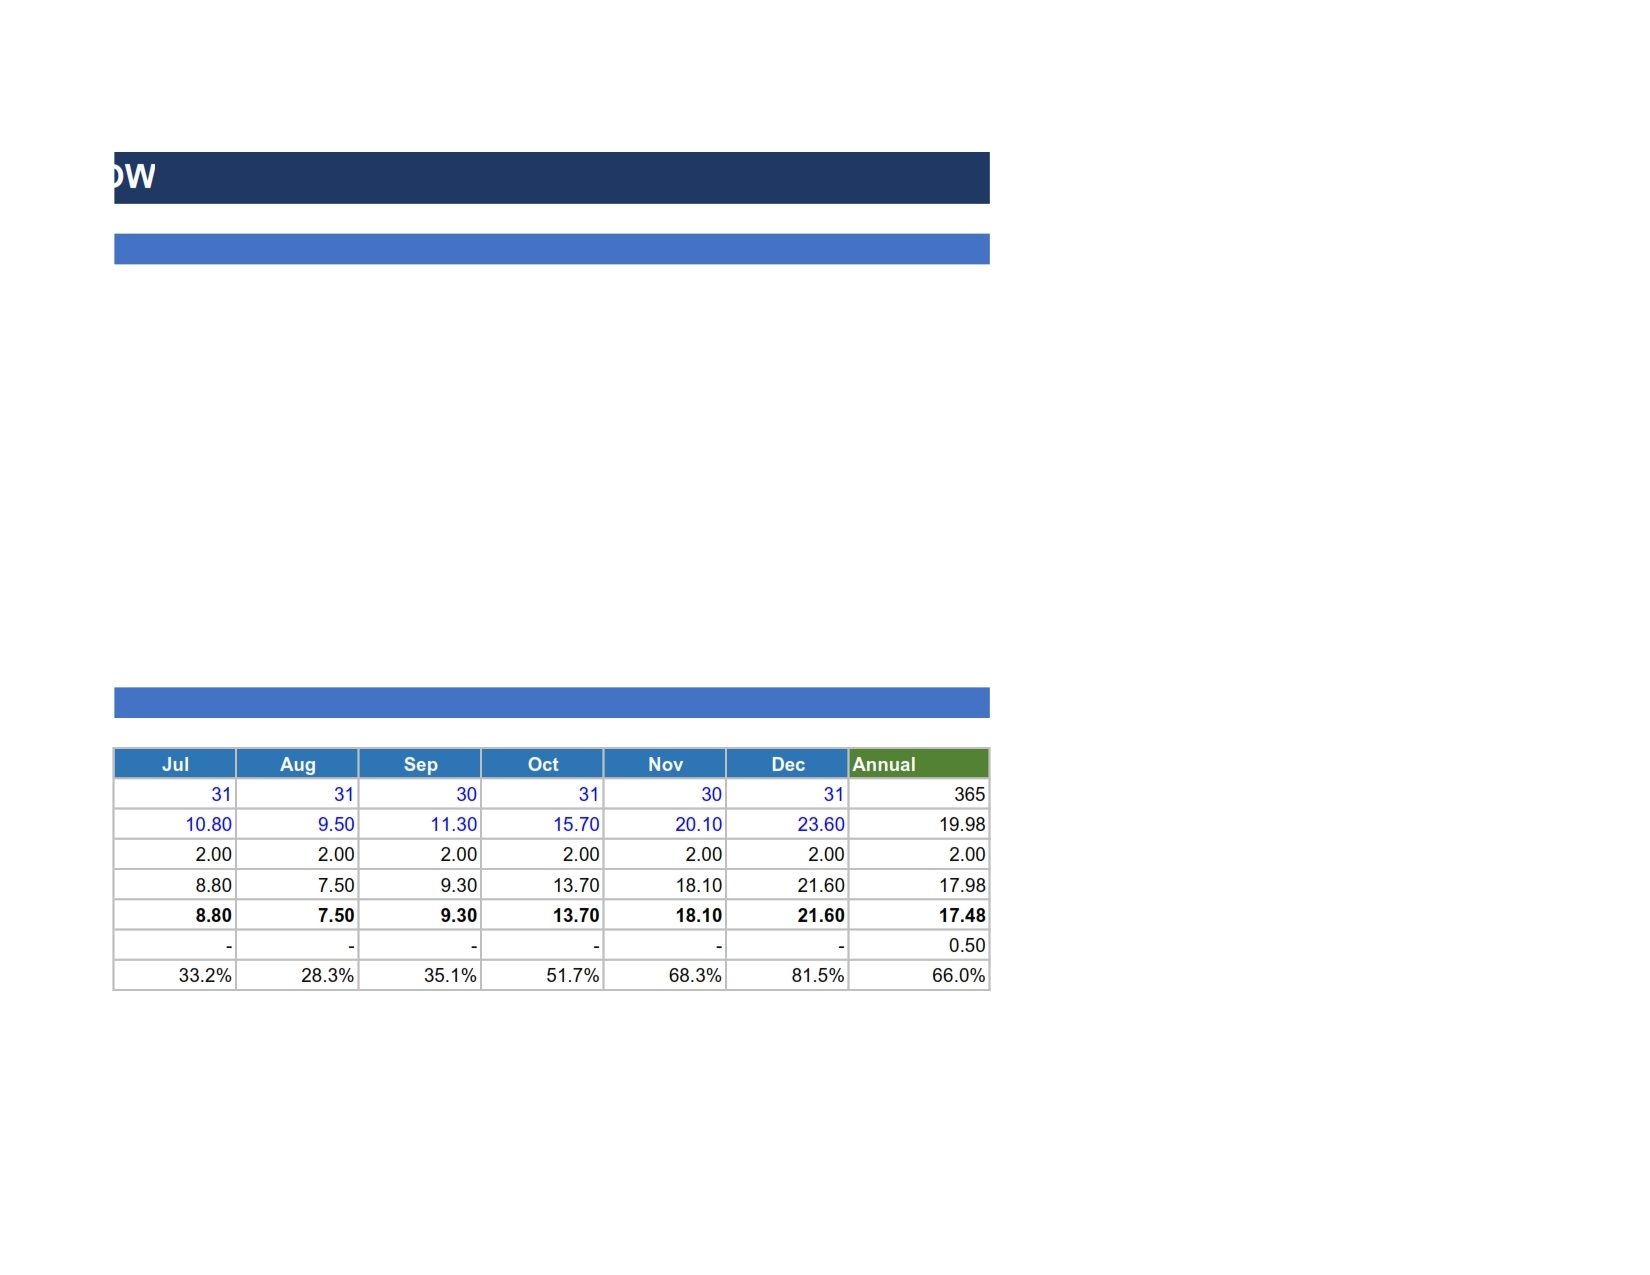
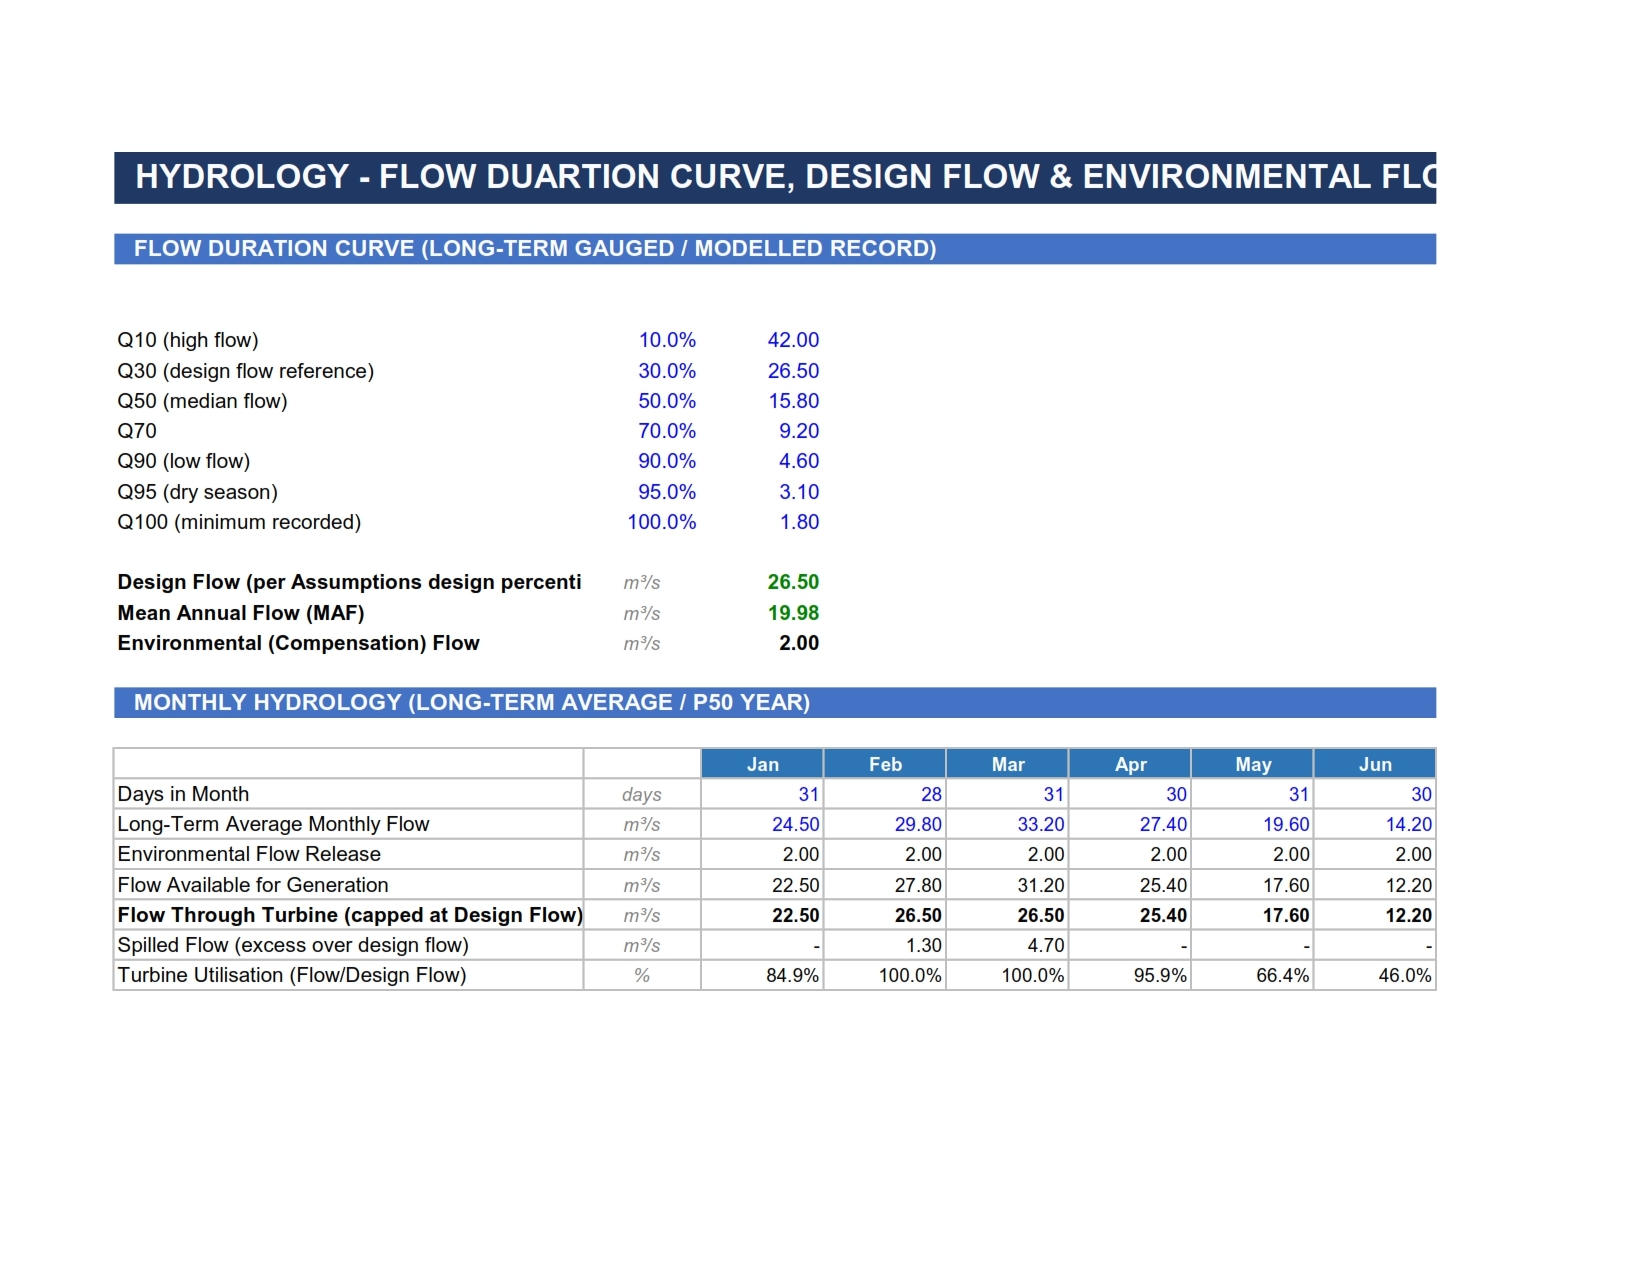
Hydrology — The technical foundation of the model. A flow duration curve (Q10 through Q100) establishes the statistical character of the river, from which the mean annual flow, the environmental (compensation) flow — set per IFC Performance Standard 6 / Building Block Methodology conventions — and the design flow are derived. Twelve months of long-term average flow data feed a monthly calculation of available flow, turbine flow (capped at design flow), and spill, giving a realistic month-by-month picture of how the plant will actually operate across a typical hydrological year.

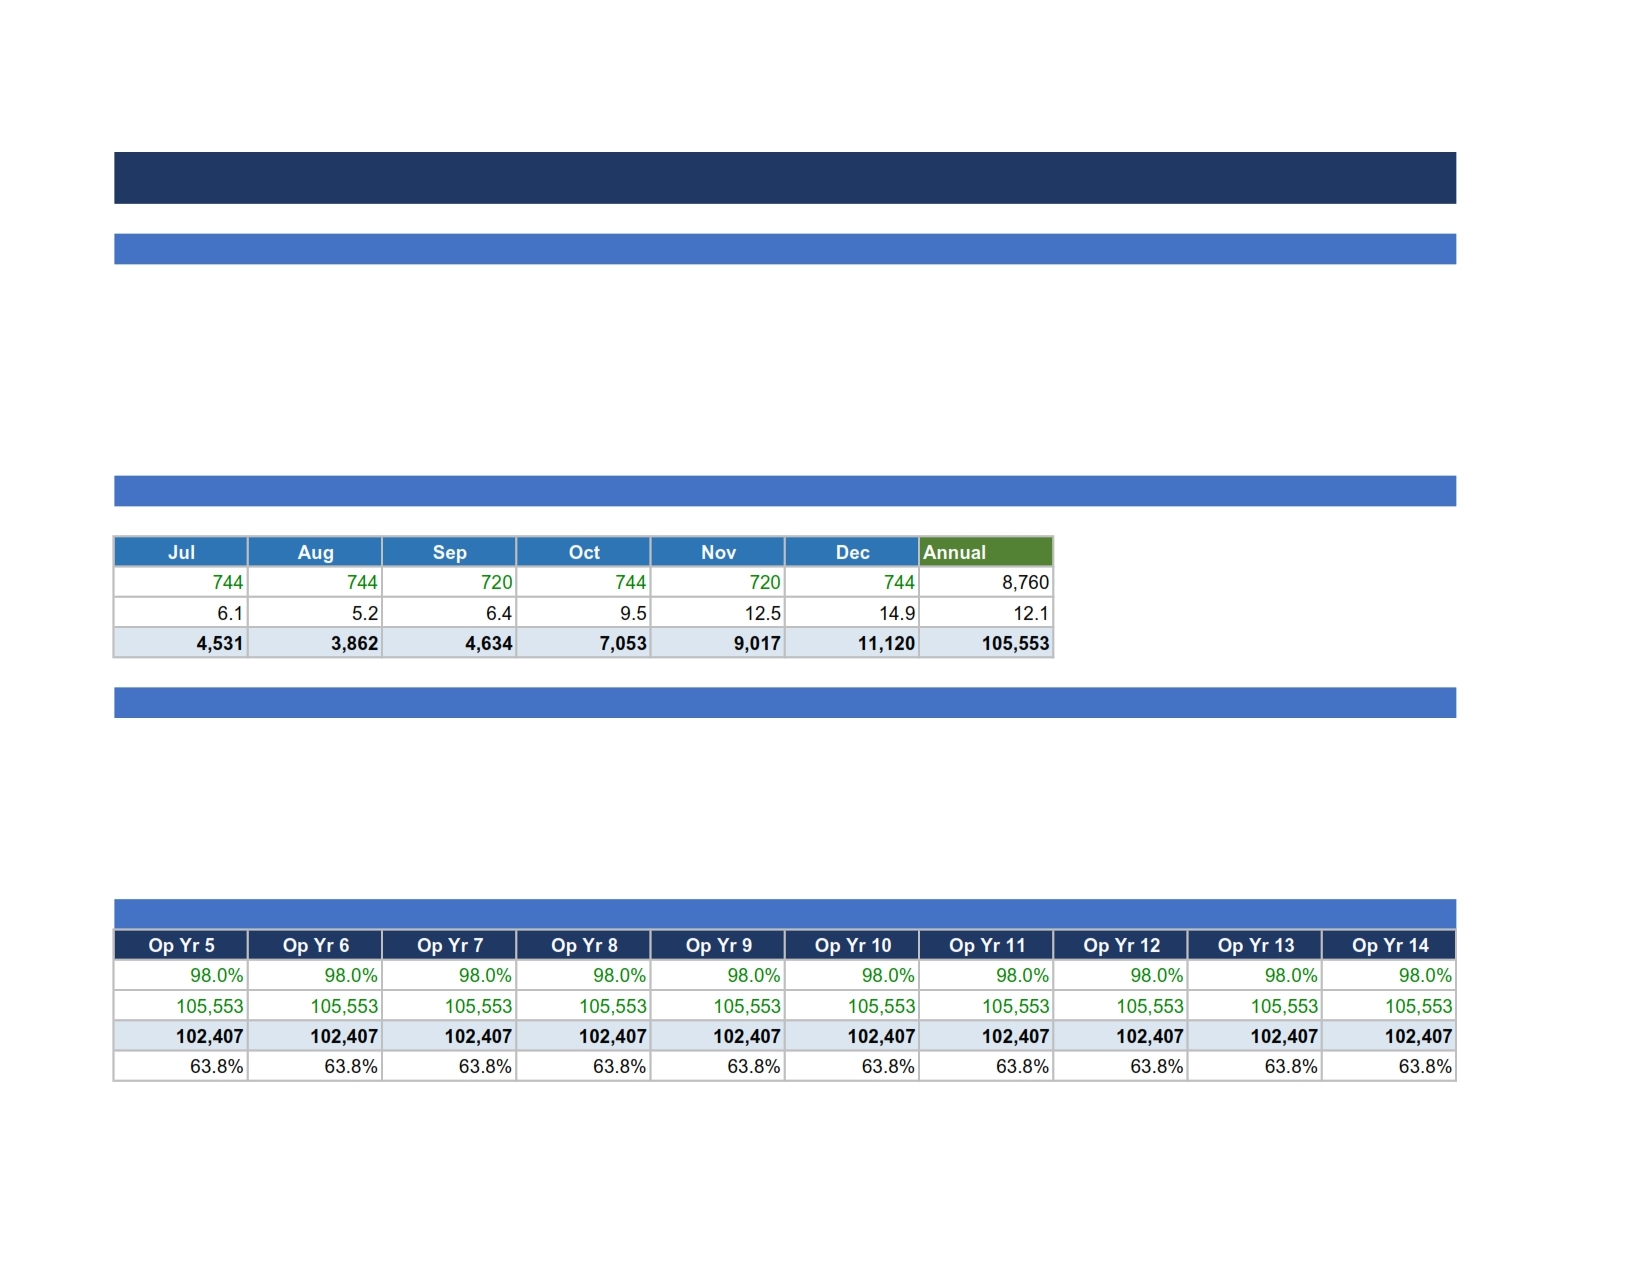
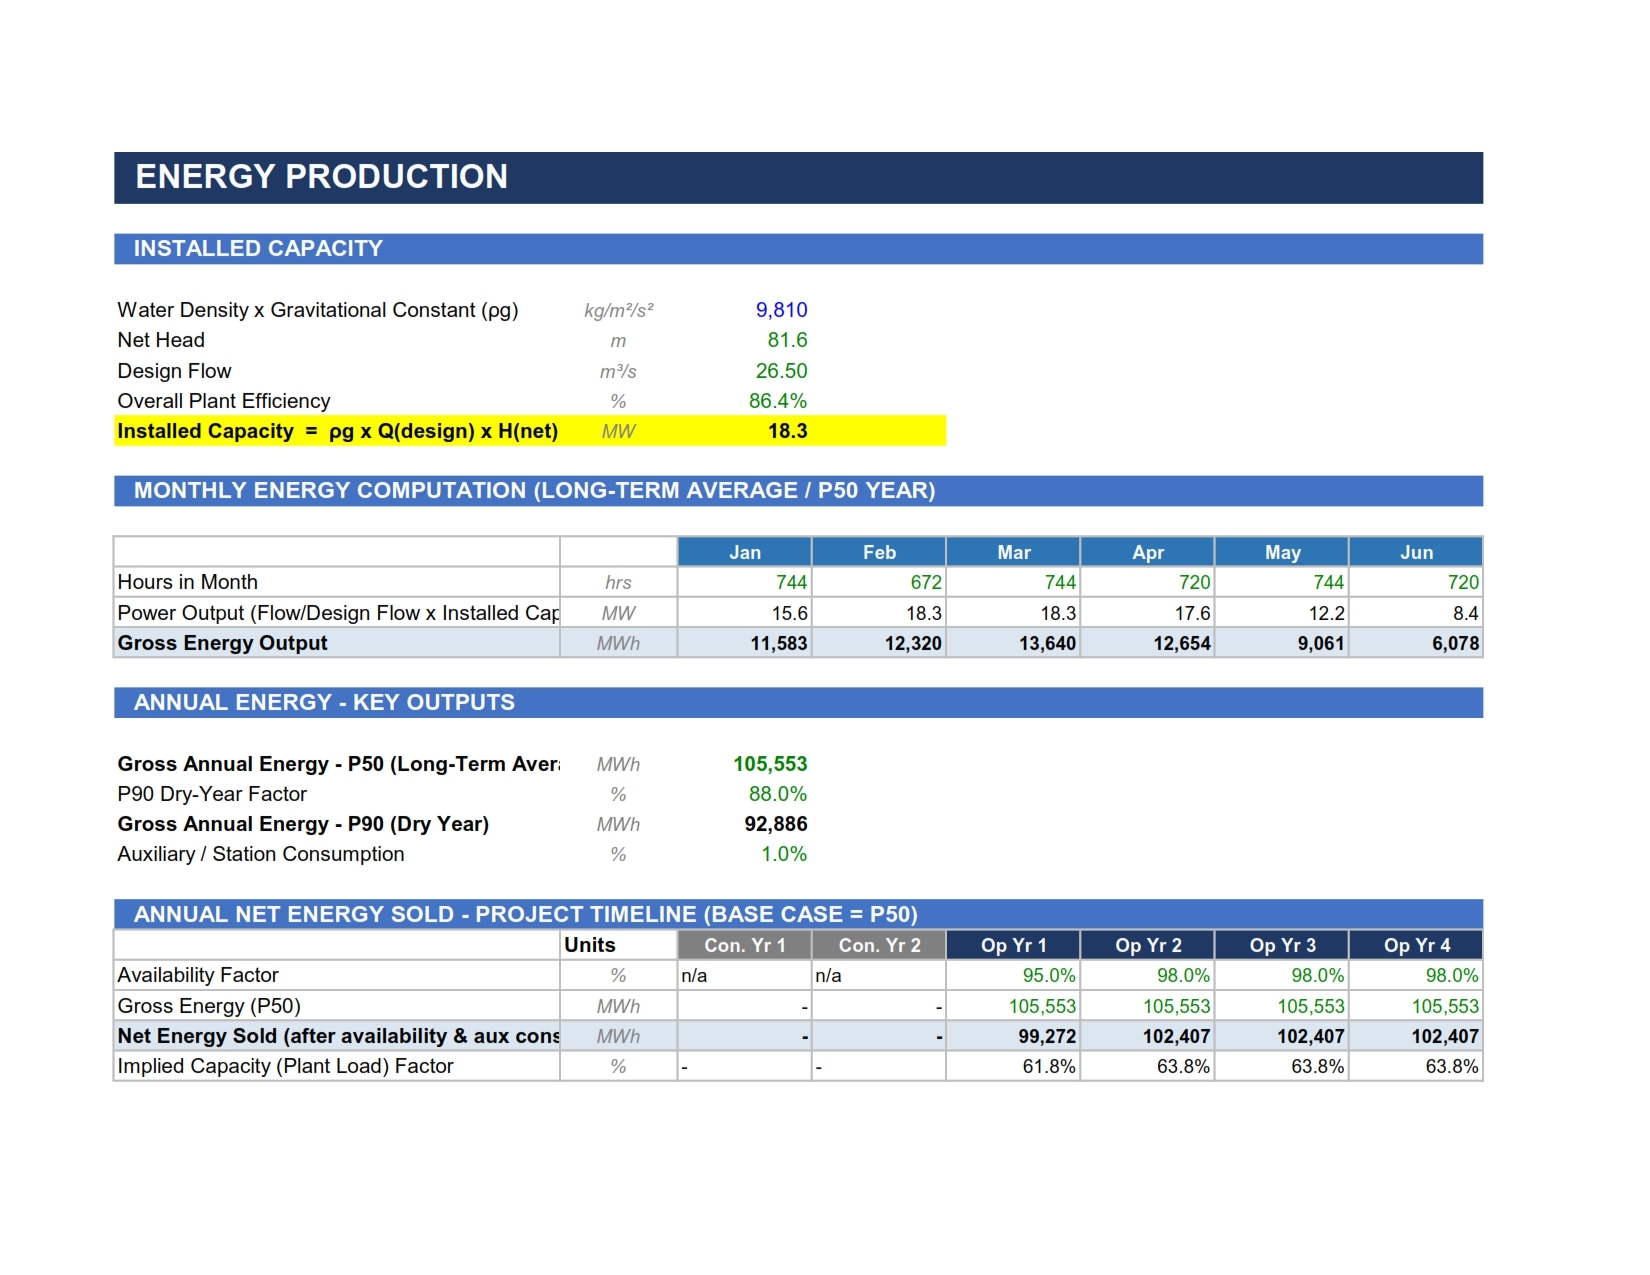
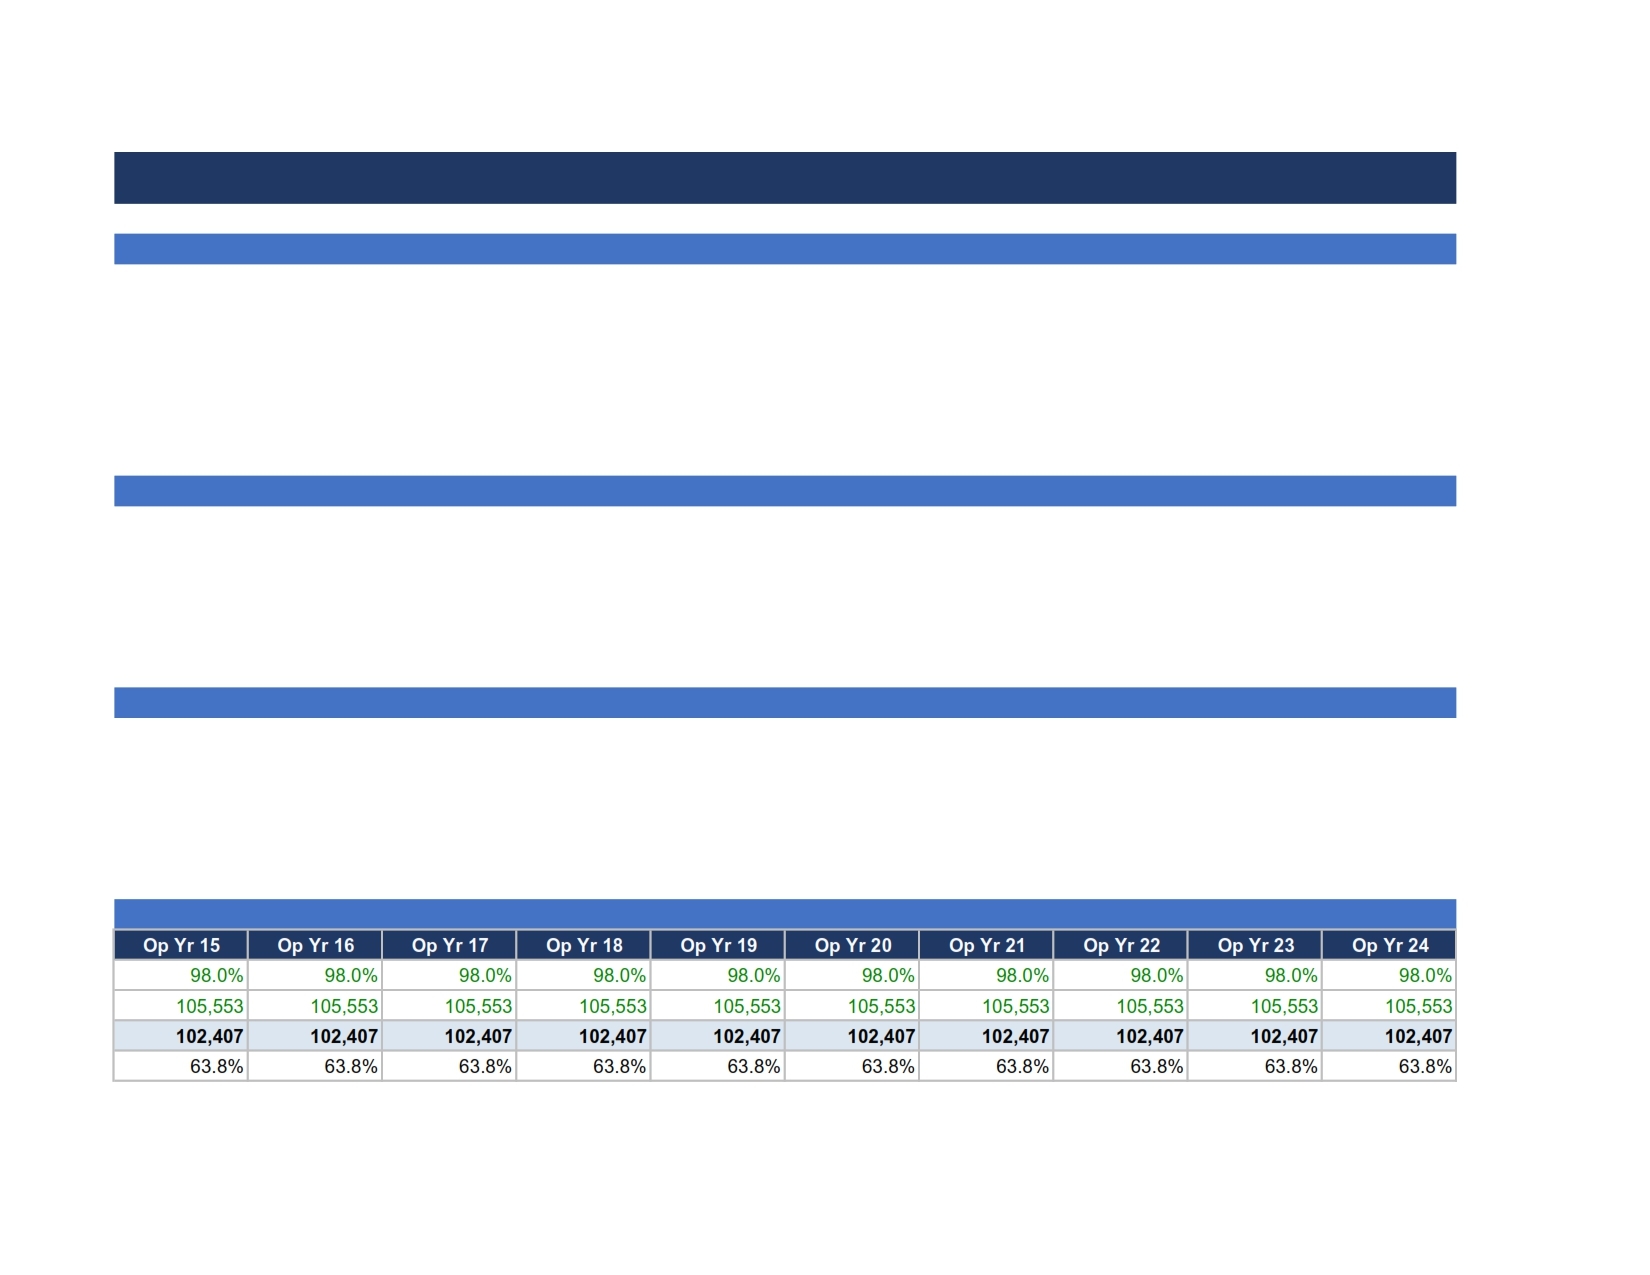
Energy — Converts hydrology into megawatts and megawatt-hours. Installed capacity is derived directly from the physical power equation (density × gravity × design flow × net head × overall efficiency), and monthly energy output is computed from the Hydrology sheet's turbine flow profile. The sheet produces both a P50 (long-term average) and P90 (dry-year) annual energy estimate, then carries the P50 case forward across all 25 operating years, adjusted for a commissioning ramp-up in Year 1, steady-state availability thereafter, and auxiliary/station consumption.

CAPEX — Builds total project cost from its component parts (civil works, electro-mechanical equipment, grid connection, land, environmental and social costs, owner's costs, and contingency), schedules the spend across the two construction years, computes interest during construction on a mid-year drawdown convention, capitalizes the debt arrangement fee, and reconciles total sources of funds against total uses to the dollar.

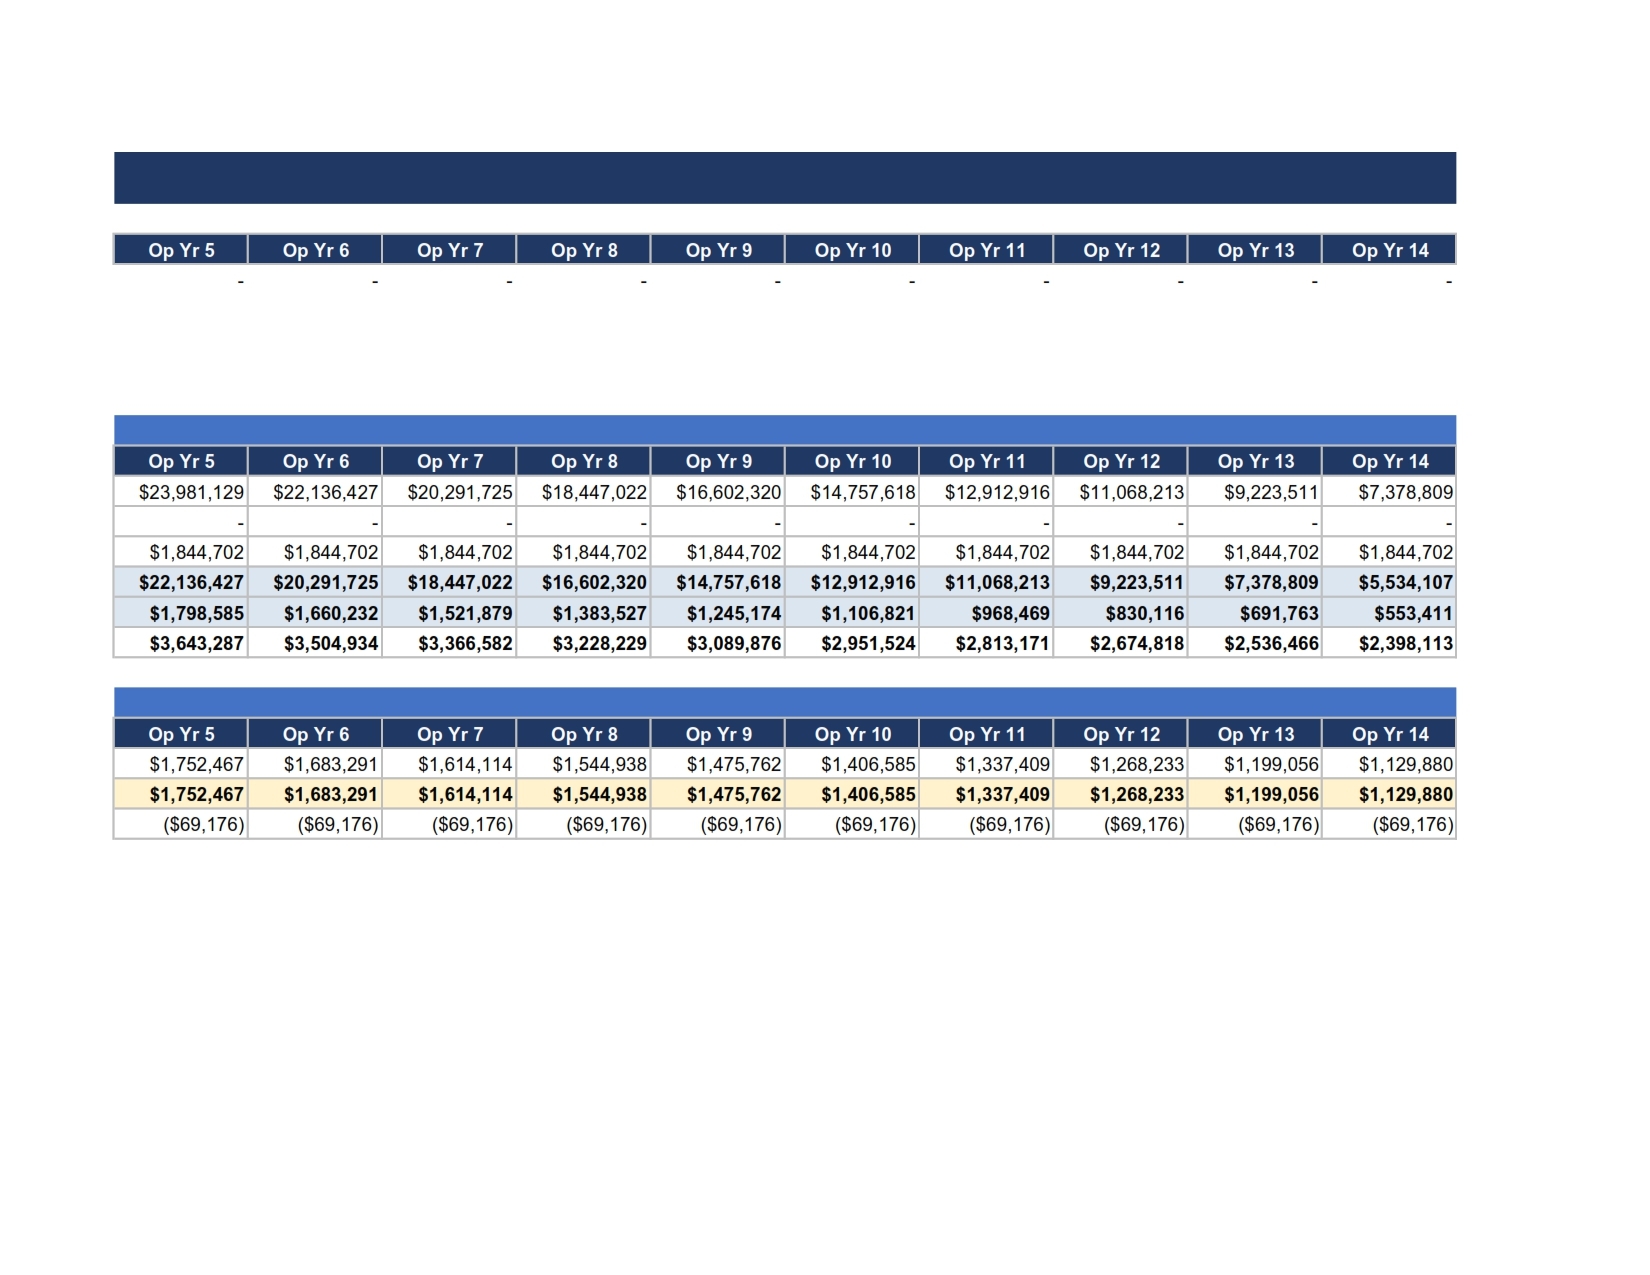
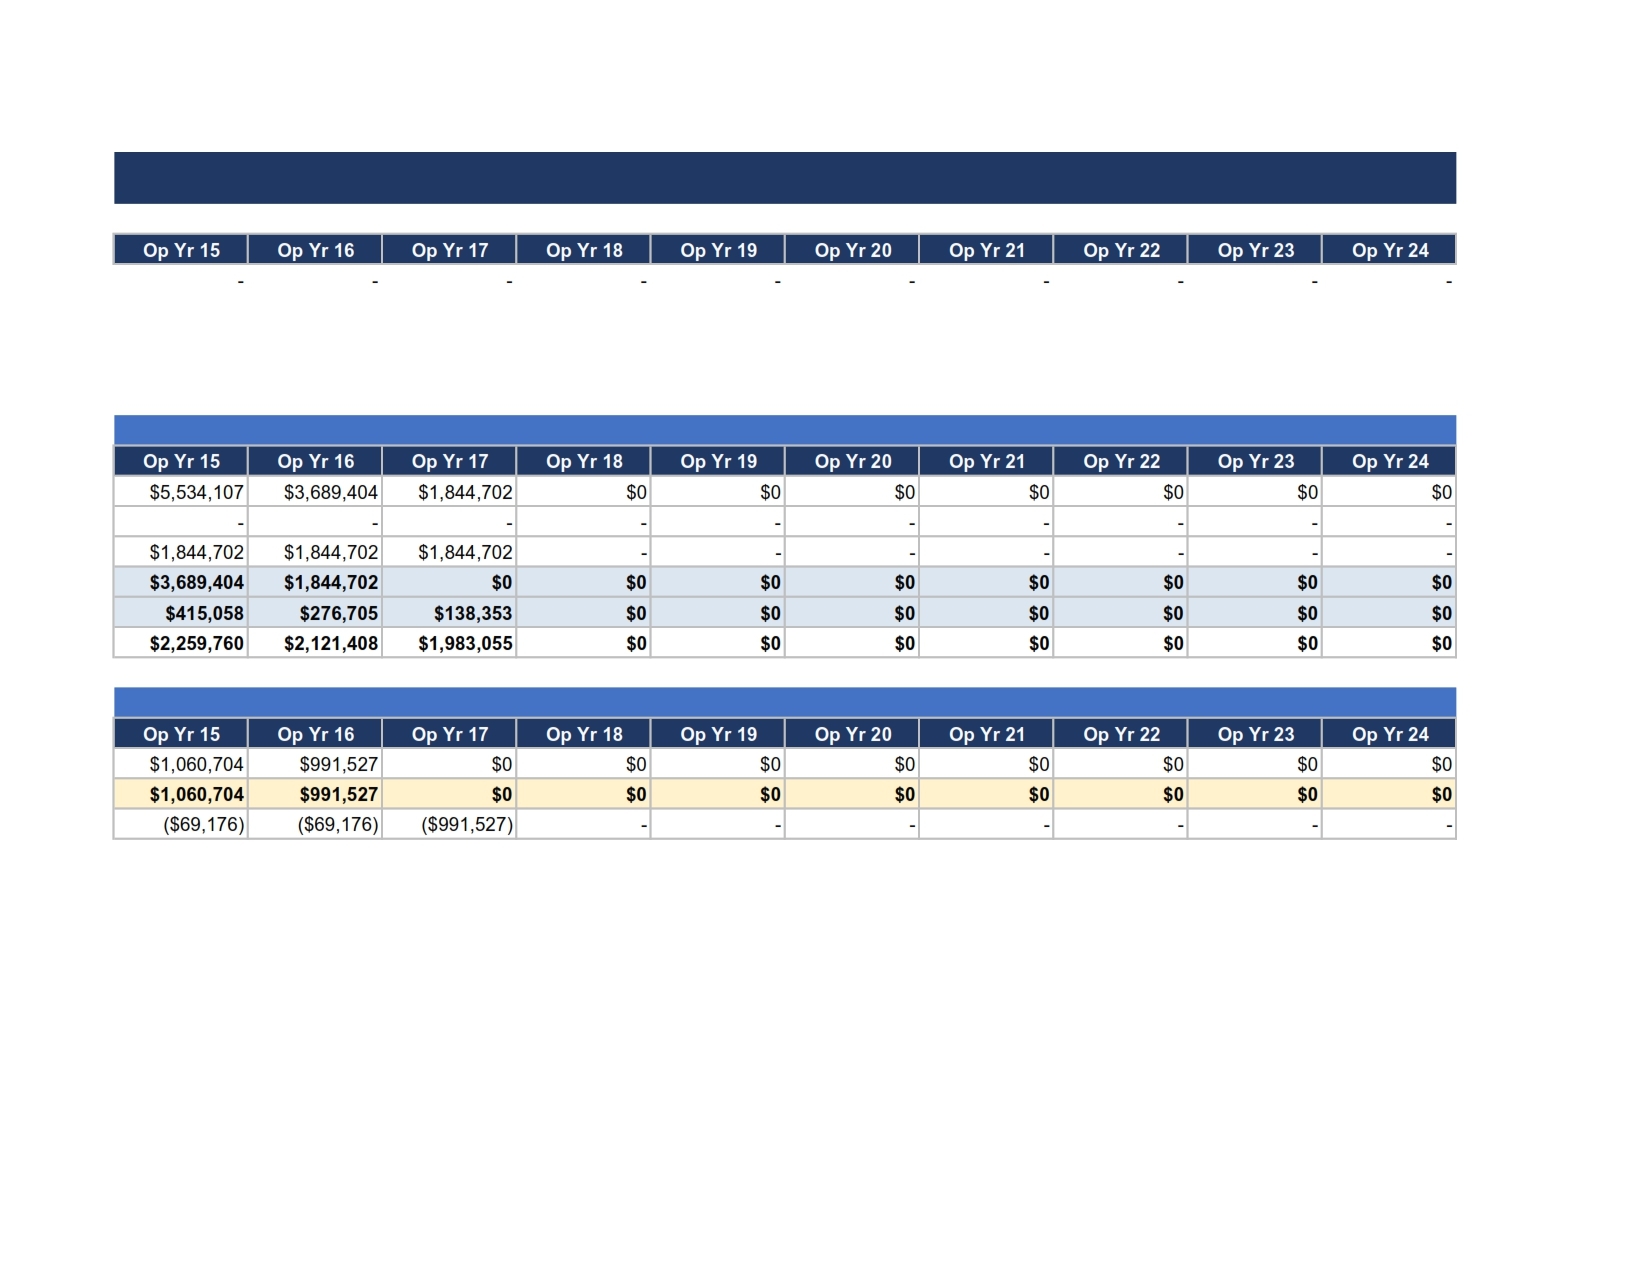
Debt — A full senior debt schedule: drawdown (including capitalized construction-period interest and fees), straight-line amortization over a lender-specified tenor, opening-balance interest calculation, and a Debt Service Reserve Account sized at a specified number of months of forward debt service, funded at financial close and released at final maturity.

Revenue — Applies an escalating PPA tariff, indexed to a configurable share of general inflation, to the net energy sold each year, incorporating the tariff sensitivity toggle.

Opex — Builds operating costs from fixed O&M (scaled to installed capacity), variable O&M (a percentage of revenue), insurance, land lease/water royalty, administration, and a periodic major maintenance reserve for turbine overhauls — all escalated with inflation.

Depreciation — A straight-line depreciation schedule over the full asset life, feeding both the P&L and the balance sheet's net book value.
PnL — A conventional income statement from revenue down to net income, correctly excluding construction-period interest (which is capitalized into CAPEX rather than expensed).

Cashflow — The heart of any project finance model: working capital, CFADS, annual DSCR, debt service, DSRA movements, and a full equity cash flow waterfall with a cash sweep mechanism that distributes 100% of available cash as dividends once debt service and reserve requirements are met.

BalanceSheet — A complete balance sheet (cash, receivables, net fixed assets, DSRA on the asset side; payables and senior debt on the liability side; share capital and retained earnings on the equity side) that balances to the dollar in every single year, verified automatically by the Model Checks sheet.

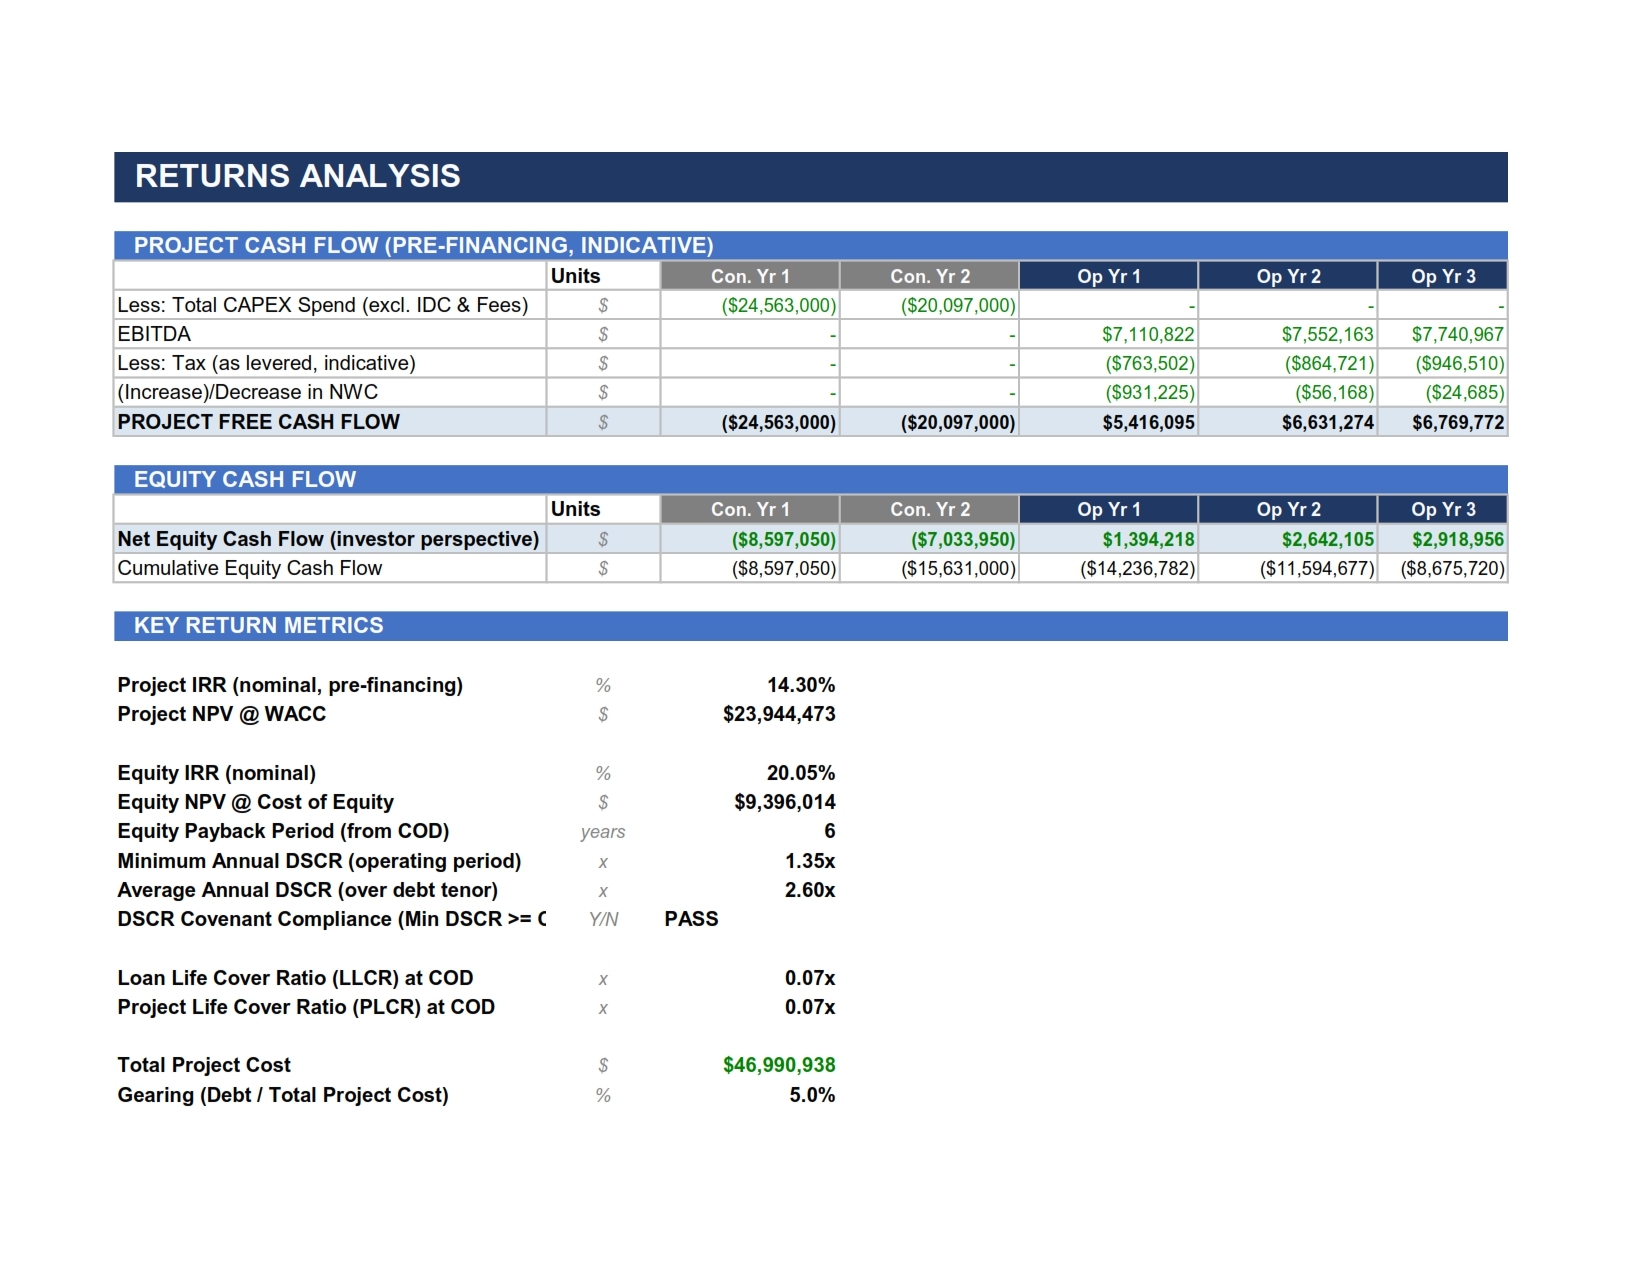
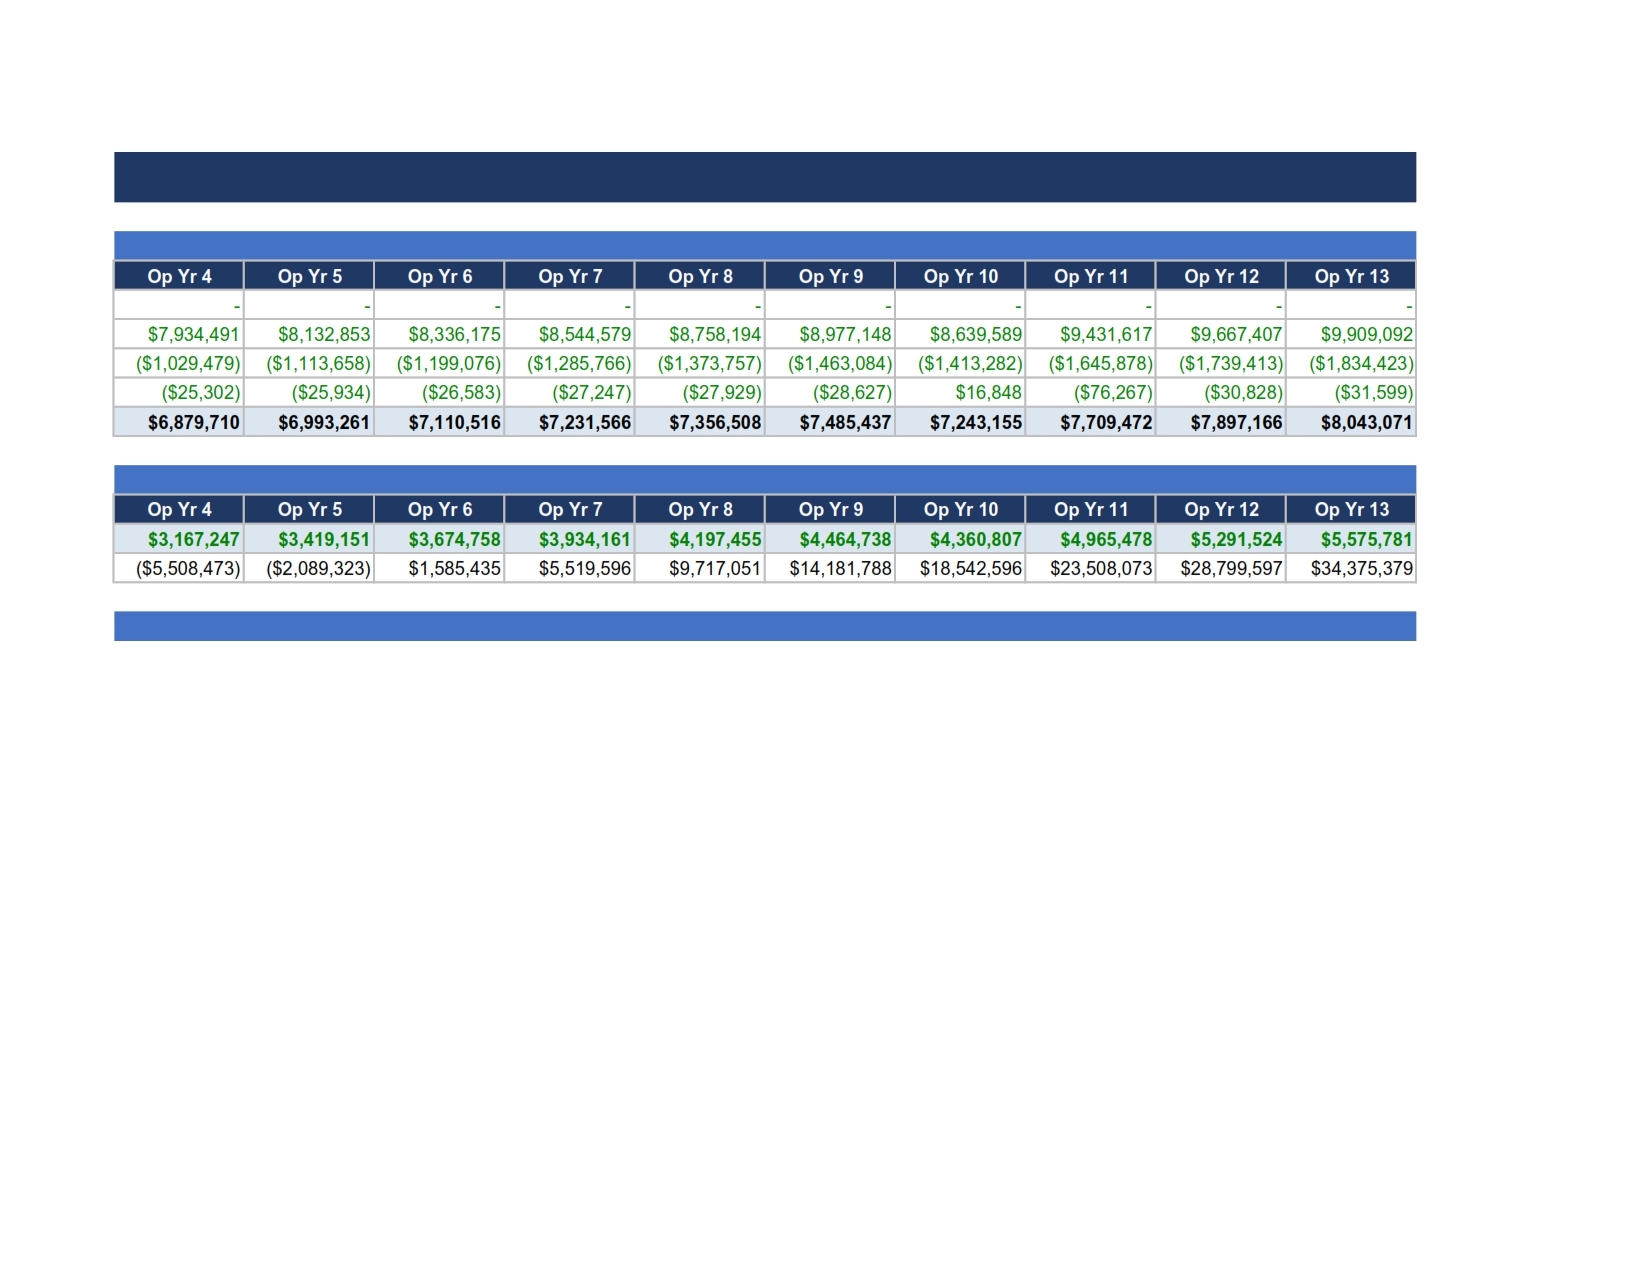
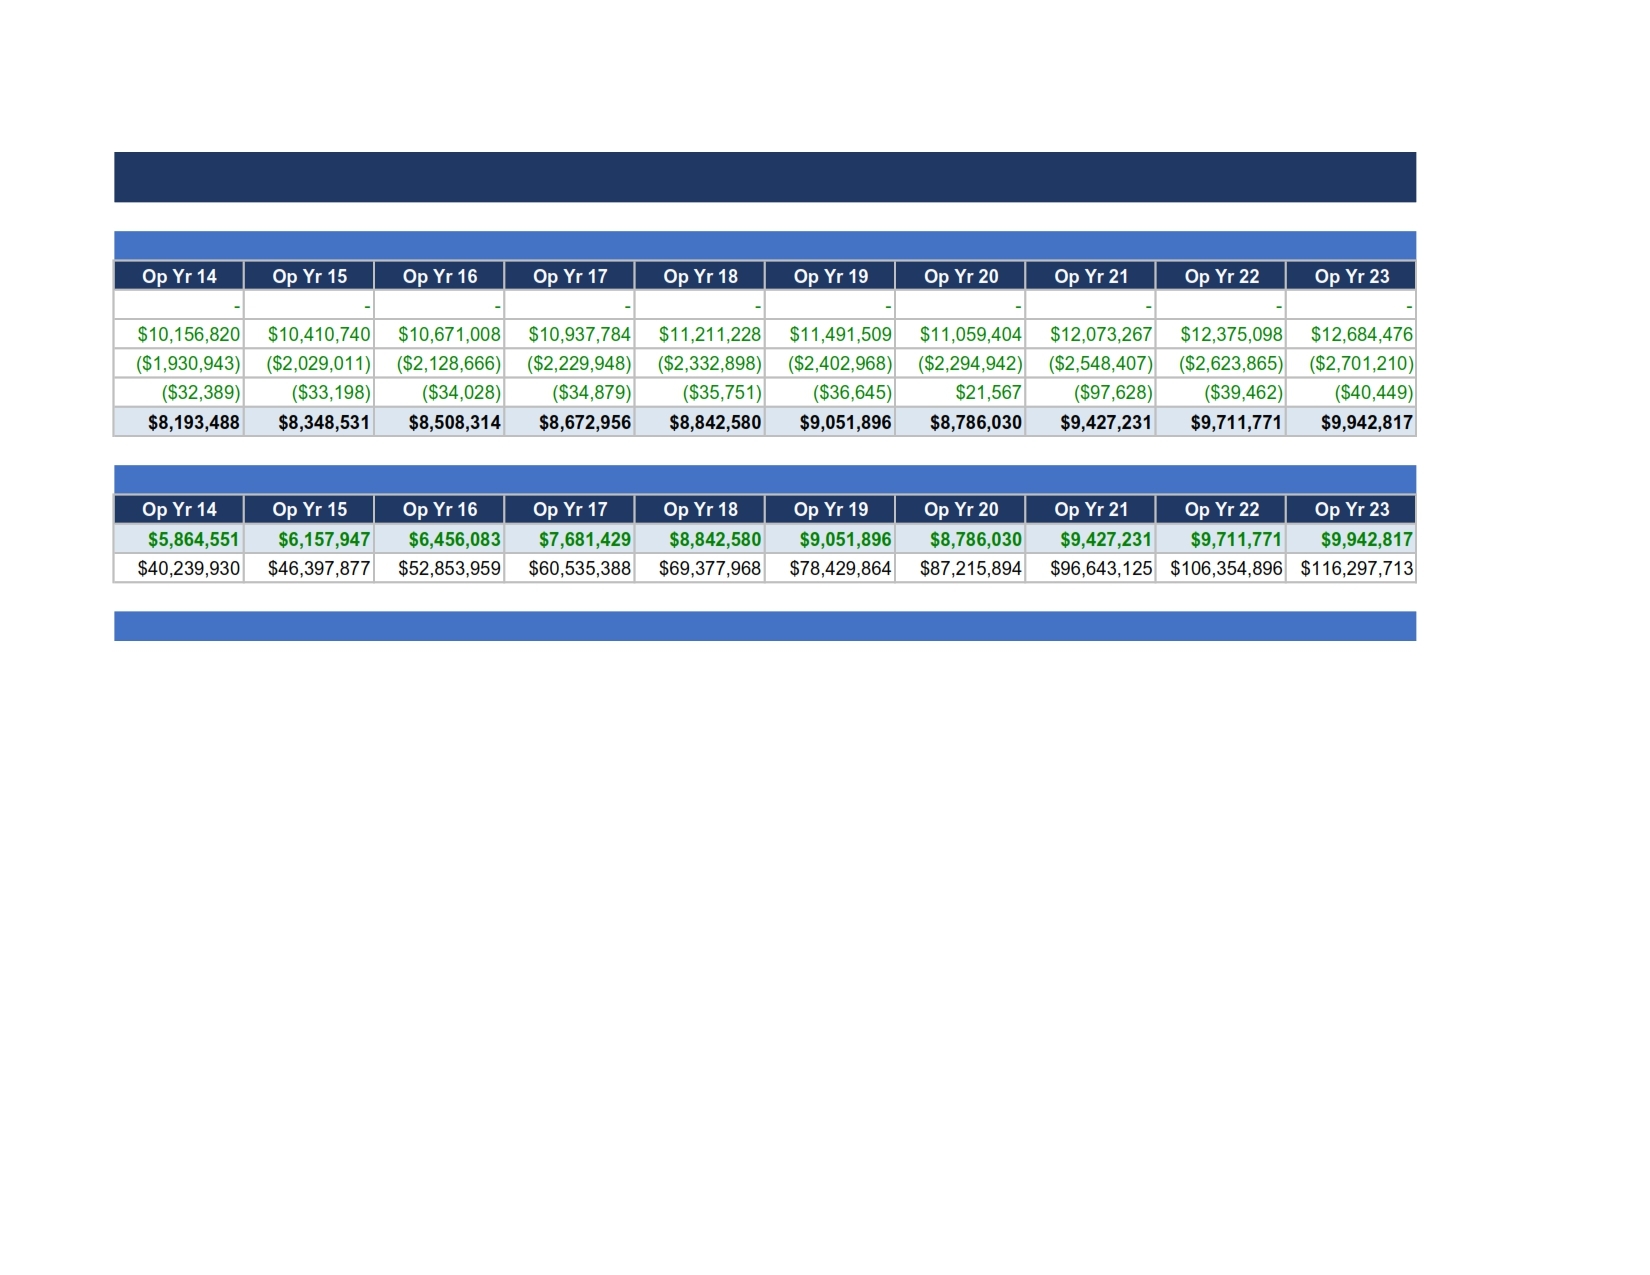
Returns — Project IRR and NPV (pre-financing), Equity IRR and NPV (post-financing), payback period, minimum and average DSCR, DSCR covenant compliance, and both Loan Life Cover Ratio (LLCR) and Project Life Cover Ratio (PLCR) — the metrics a lender's credit committee will look for first.

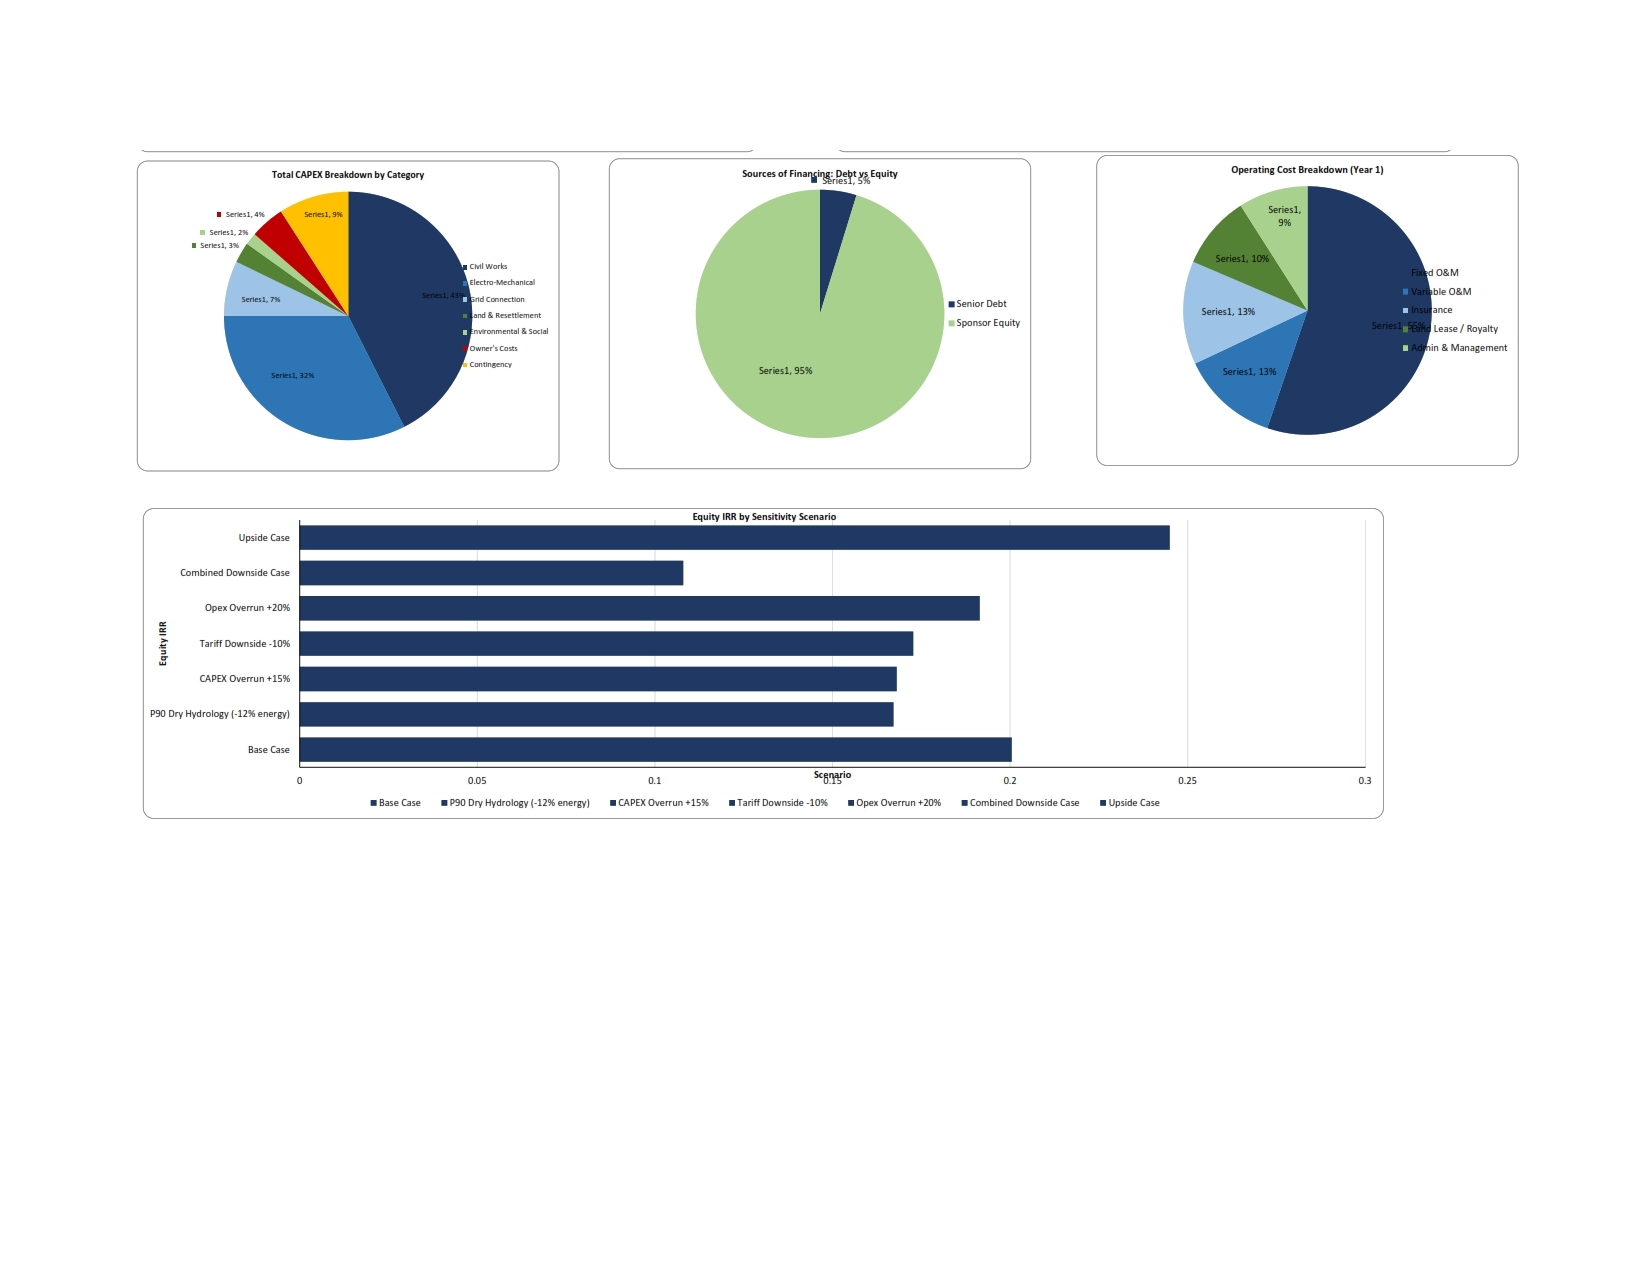
Sensitivity — Five live stress-test toggles plus a pre-computed table of seven standard scenarios (P90 hydrology, CAPEX overrun, tariff downside, opex overrun, a combined downside case, and an upside case), each independently re-run through the full model so the reported IRR and DSCR impacts are genuine model outputs rather than approximations.

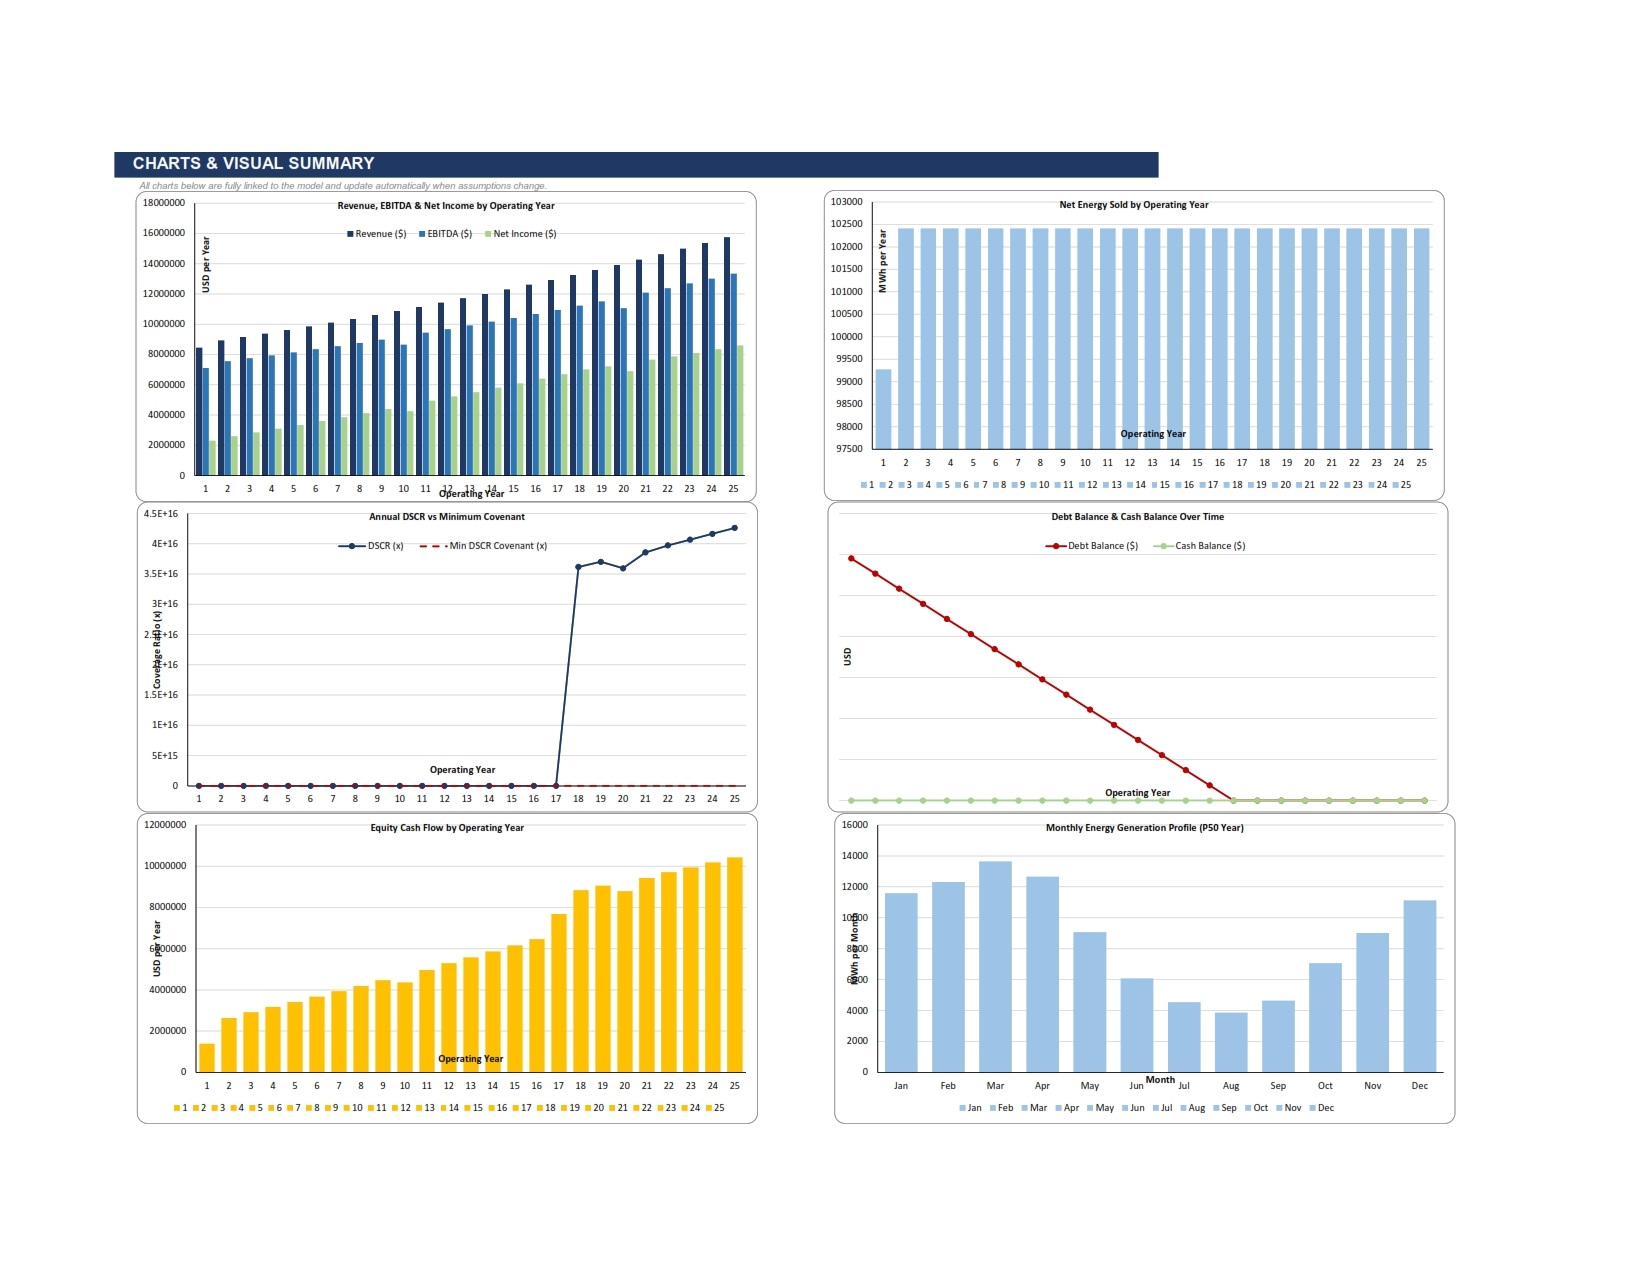
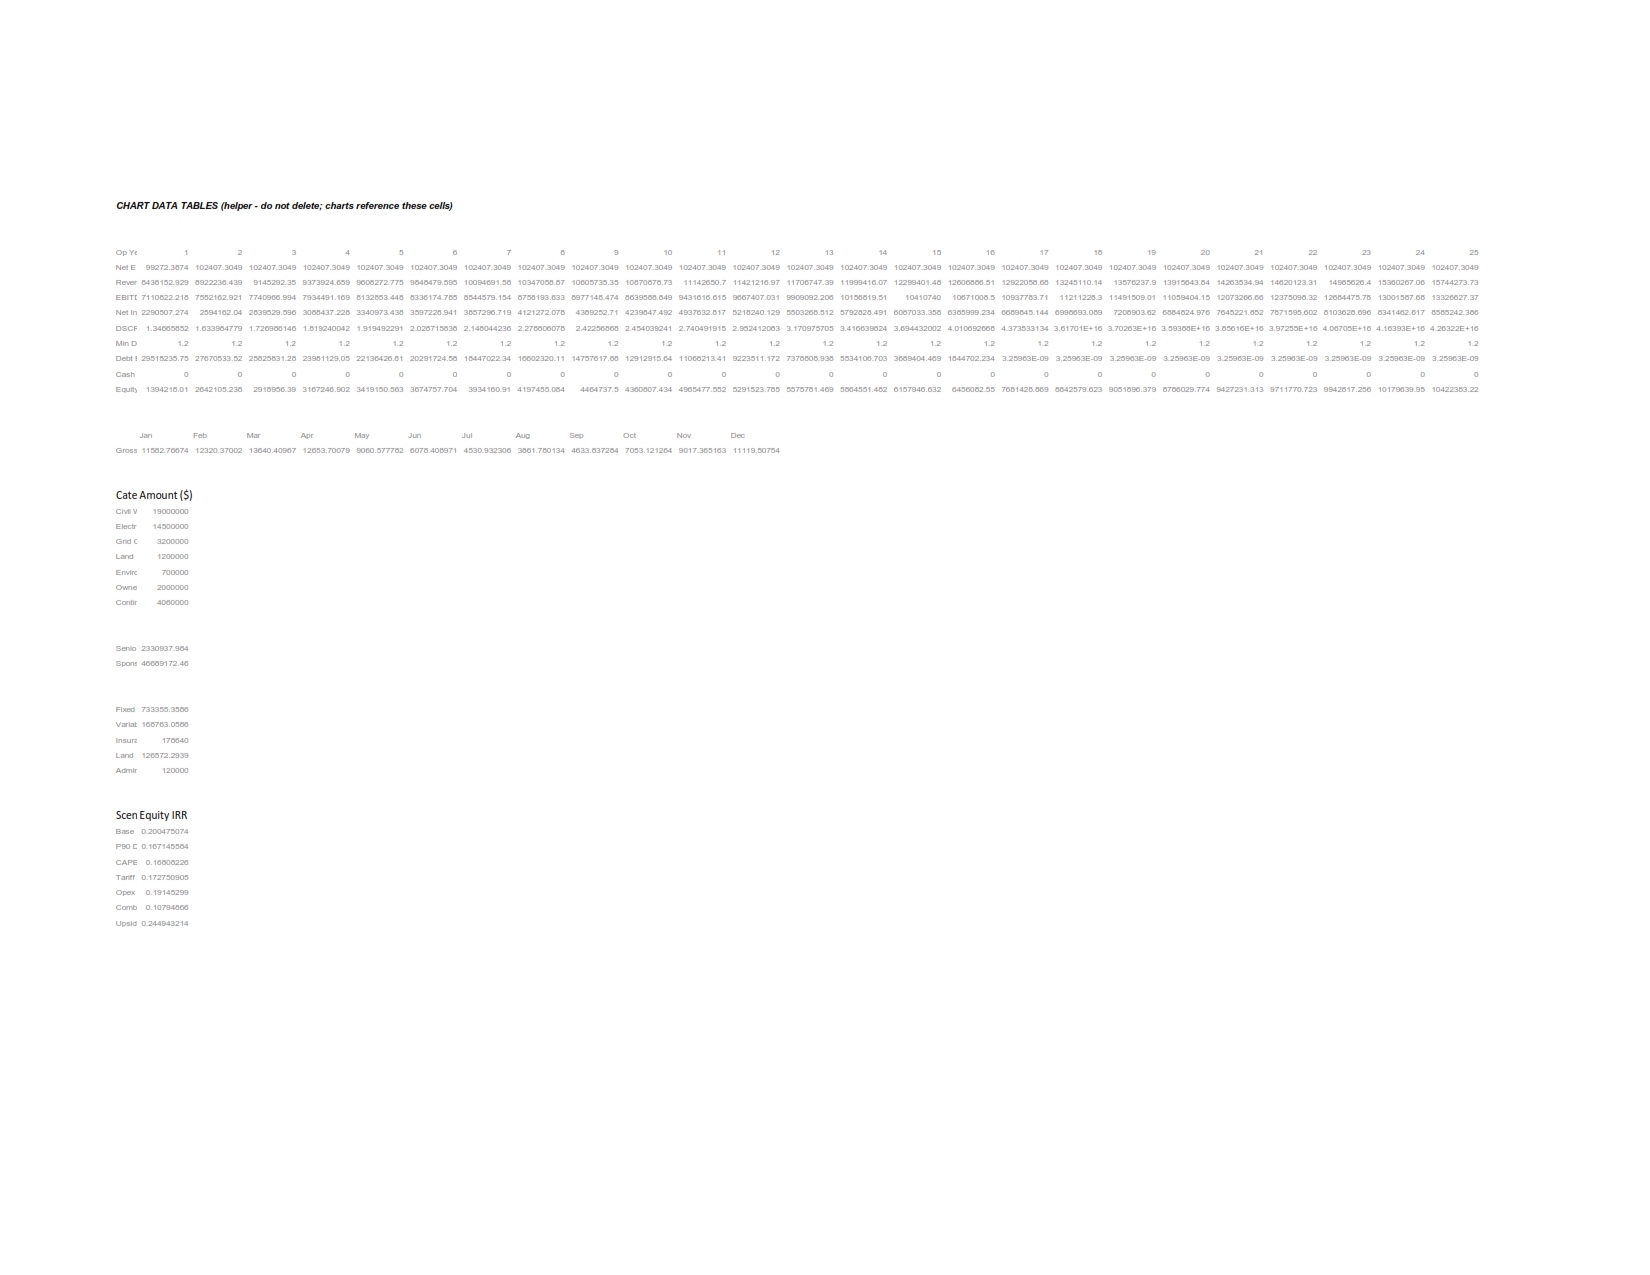
Charts — Visual summaries of revenue and profitability, energy production, the DSCR profile against covenant, debt and cash balances over time, and the equity cash flow profile.

ModelChecks — Eight automated pass/fail integrity tests (sources = uses, balance sheet balances, non-negative cash, full debt repayment, DSCR covenant compliance, non-negative CFADS, full depreciation, and capacity factor sanity), color-coded green or red, alongside a one-glance key output summary.

Illustrative Base Case
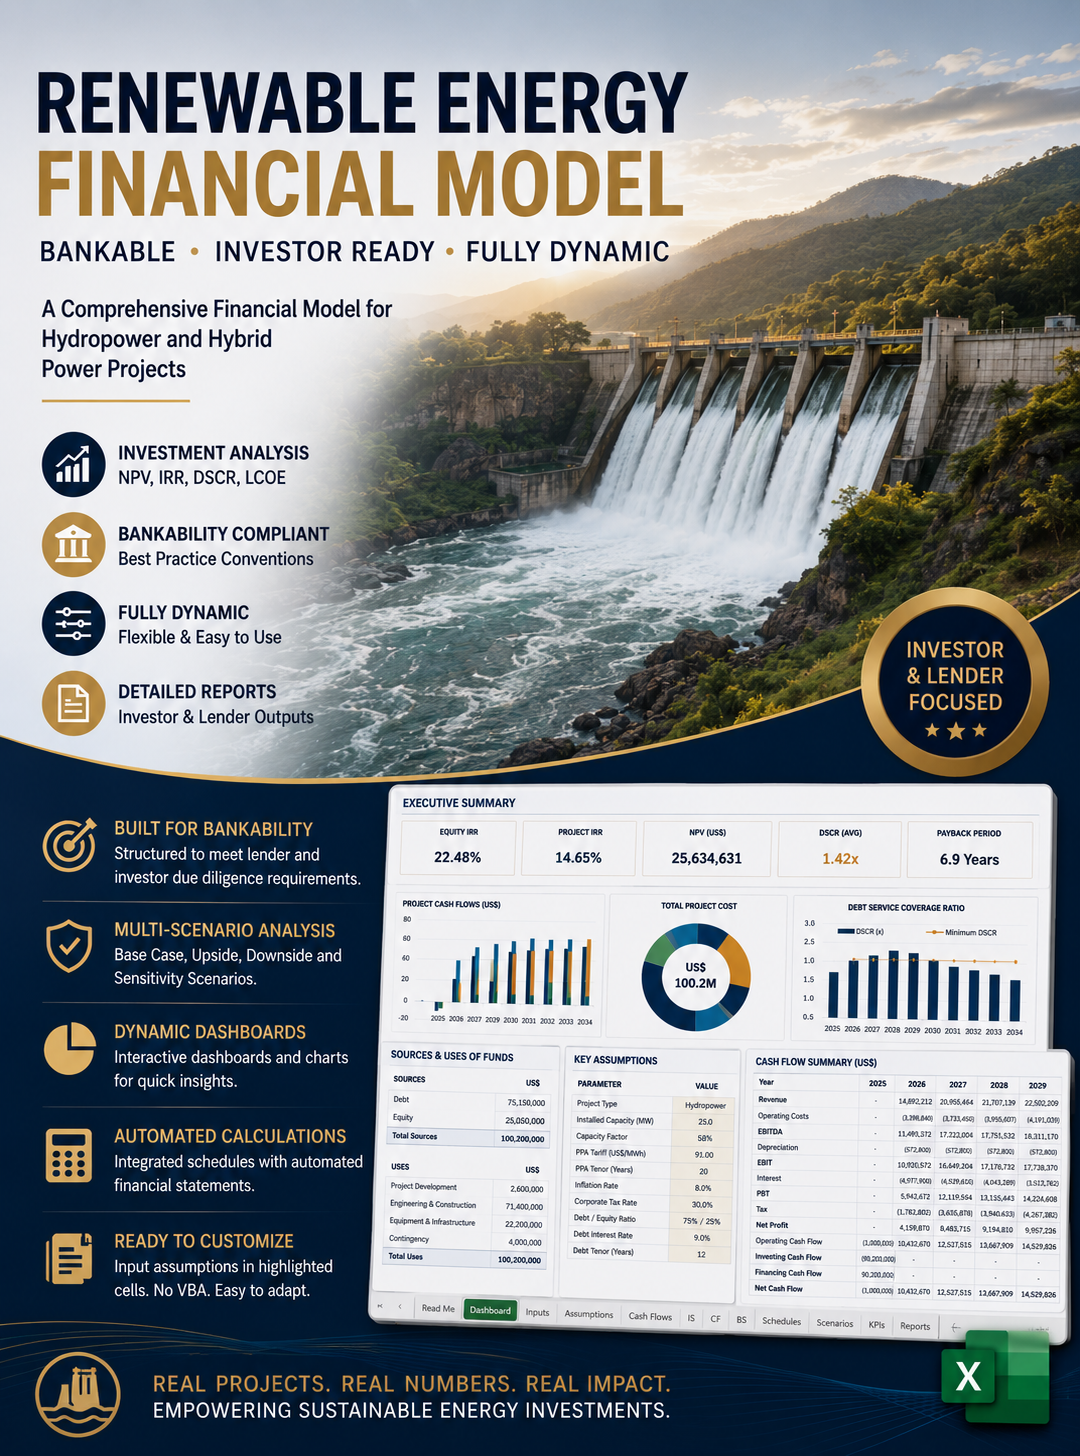
With the default assumptions supplied, the model describes an 18.3 MW plant producing approximately 105,550 MWh per year, a total project cost of roughly $47 million, a Project IRR of 14.3%, an Equity IRR of 20.0%, and a minimum DSCR of 1.35x against a 1.20x covenant — return and coverage metrics consistent with what a small hydro project of this scale could realistically expect to present to lenders and equity investors.

Important Caveat
Every quantitative input in this workbook — hydrological data, capital costs, tariff, financing terms — is illustrative and clearly source-noted as such. The model's value lies in its structure, its linkages, and its analytical completeness, not in the specific numbers supplied. Before this model is used to support an actual financing decision, every assumption must be replaced with project-specific data drawn from a hydrological study, EPC quotations, a signed or term-sheeted PPA, and indicative lender terms.

This Best Practice includes
1 PDF file and 1 MS Excel Workbook

Acquire business license for $250.00

Add to cart

Add to bookmarks

Discuss

Further information

Objectives of the Small Hydropower Bankable Financial Model

1. Translate technical hydrology into bankable outputs — convert flow duration curves, environmental flow policy, and design flow selection into installed capacity and annual energy (P50/P90) that lenders and engineers can independently verify.

2. Size and structure the financing — determine total project cost, optimal debt/equity gearing, tenor, and DSRA requirements that keep debt service coverage within lender covenants.

3. Test bankability against lender criteria — produce the standard credit metrics (DSCR, LLCR, PLCR) that determine whether a lender's credit committee will approve the deal.

4. Quantify investor returns — calculate Project IRR and Equity IRR (and NPVs) to assess whether the project meets sponsor and equity investor return thresholds.

5. Stress-test key risks — show how hydrological shortfall, capex overrun, tariff downside, opex overrun, and interest rate movement affect returns and coverage, individually and combined.

6. Ensure full auditability — link every output back to its source assumption with transparent formulas (no black boxes), color-coded inputs vs. calculations, and automated integrity checks that catch errors immediately.

7. Support the full lifecycle of a transaction — serve equally as a feasibility/IM tool for sponsors, a due-diligence tool for lenders and independent engineers, and a live negotiating tool for structuring debt terms and tariff.

8. Provide a reusable, adaptable template — allow assumptions (hydrology, costs, tariff, financing terms) to be swapped out for a new site without rebuilding the model's architecture.

Conditions Under Which This Financial Model Applies Best

1. Run-of-river hydropower projects — the hydrology, design flow, and environmental flow logic are built specifically for run-of-river schemes with no significant reservoir/storage; it is not structured for large storage/dam projects with multi-year regulation or pumped-storage economics.

2. Small-to-mid scale capacity — best suited to projects roughly in the 1–30 MW range, where a single-turbine or few-turbine configuration and a simplified linear flow-to-power relationship remain reasonably accurate. Larger multi-unit cascades with staggered dispatch would need a more granular structure.

3. Single offtake / single tariff structure — assumes one PPA tariff (with a defined escalation mechanism) applied to substantially all energy produced. Projects with merchant sales, multiple offtakers, or split contracted/merchant volumes would need the Revenue sheet extended.

4. Conventional project finance structure — a standard senior debt + sponsor equity capital structure, single-tranche debt, straight-line amortization, and a DSRA. Projects with mezzanine debt, multiple debt tranches, sculpted/cash-sweep amortization, or blended concessional financing would require adaptation of the Debt sheet.

5. Annual periodicity is sufficient — suited to long-term feasibility, financing, and lender due diligence where annual cash flows are the standard reporting unit. It is not built for short-term liquidity/working-capital management or intra-year covenant testing that requires quarterly or monthly cash flow detail.

6. Availability of basic hydrological data — requires at least a long-term monthly average flow series and a flow duration curve (even from regional regression or a short gauge record). Projects with no hydrological study at all would need that data commissioned before the model's outputs are meaningful.

7. Fixed-price or largely fixed-scope EPC cost basis — the CAPEX build-up assumes a defined cost breakdown by category with a contingency margin; it is not designed for cost-reimbursable or highly uncertain scope contracts without a defined estimate.

8. Corporate/standard tax and inflation environment — straightforward corporate income tax and general inflation indexation are modelled; projects in jurisdictions with tax holidays, accelerated depreciation incentives, VAT/import duty exemptions, or carbon credit revenue streams would need those features added.

9. Feasibility, financing, and due-diligence stages — most valuable from pre-financing feasibility through financial close and periodic lender monitoring; it is not an operational/real-time SCADA or asset management tool for day-to-day plant dispatch.

10. Users comfortable with Excel-based, formula-driven models — best applied by sponsors, advisors, or lenders who will actively recalibrate assumptions (hydrology, costs, tariff, financing terms) to their specific site rather than use the illustrative defaults as-is.

Conditions Under Which This Financial Model Does Not Apply Ideally

1. Storage/reservoir or pumped-storage hydropower — projects with multi-year or seasonal storage, reservoir regulation, or pumped-storage arbitrage economics need reservoir operation modelling (storage balance, spill rules, multi-year carryover) that this run-of-river structure doesn't provide.

2. Very large or multi-unit cascade schemes — large hydropower (typically well above ~30 MW) or cascades of multiple plants with staggered dispatch, shared infrastructure, or complex hydraulic interaction between units need a more granular, unit-by-unit dispatch structure than the single linear flow-to-power relationship used here.

3. Merchant or multi-offtaker revenue structures — projects selling into a wholesale/merchant market, with variable spot pricing, capacity markets, ancillary services revenue, or multiple offtakers with different tariffs and volumes, need a materially expanded Revenue sheet; this model assumes one tariff applied to substantially all output.

4. Complex capital structures — deals with multiple debt tranches, mezzanine or subordinated debt, sculpted/cash-sweep amortization tied to a target DSCR, interest rate hedging/swaps, or blended concessional and commercial financing need a more sophisticated Debt sheet than the single-tranche, straight-line structure provided.

5. Short-term liquidity or intra-year cash management — because the model runs on annual periods, it is not suited to working-capital management, seasonal cash flow timing within a year, or covenant tests that require quarterly/monthly granularity.

6. Projects without any hydrological data — sites lacking even a regional flow duration curve or a long-term average monthly flow series will produce unreliable outputs; the model doesn't generate hydrology from first principles (e.g., rainfall-runoff modelling) — it consumes hydrological study outputs as an input.

7. Uncertain or cost-reimbursable EPC scope — projects without a defined CAPEX estimate (e.g., very early-stage concepts, cost-plus contracts, or highly uncertain scope) will not benefit from the fixed cost-category build-up and contingency approach used here.

8. Special tax, incentive, or environmental revenue regimes — projects benefiting from tax holidays, accelerated/bonus depreciation, import duty exemptions, carbon credits (Article 6, voluntary carbon markets), green certificates, or capacity payments need those revenue/tax mechanics added; the base model only handles standard corporate tax and inflation indexation.

9. Non-USD, multi-currency, or hedged financing structures — the model works in a single base currency without FX translation, hedging costs, or multi-currency debt tranches; projects with foreign-currency debt against local-currency revenue need a currency risk module layered in.

10. Operational/asset management use — this is a financing and feasibility tool, not a SCADA, dispatch, or real-time operations and maintenance management system; it won't support day-to-day plant operating decisions or real-time production monitoring.

11. Non-power-generation renewable technologies — solar, wind, battery storage, or thermal generation projects have fundamentally different production drivers (irradiance, wind speed, degradation curves, dispatch/charging logic) and would need a different production/energy sheet entirely, even though the financing/returns architecture could be adapted.


0.0 / 5 (0 votes)

please wait...