Automated Stock Two-Pager w/ Historical Valuation Charts (Bloomberg Formulas)
Originally published: 16/02/2025 10:42
Publication number: ELQ-90938-1
View all versions & Certificate
certified

Automated Stock Two-Pager w/ Historical Valuation Charts (Bloomberg Formulas)

A fully automated equity tear-sheet w/ BBG formulas designed for hedge fund analysts and institutional investors.

Description
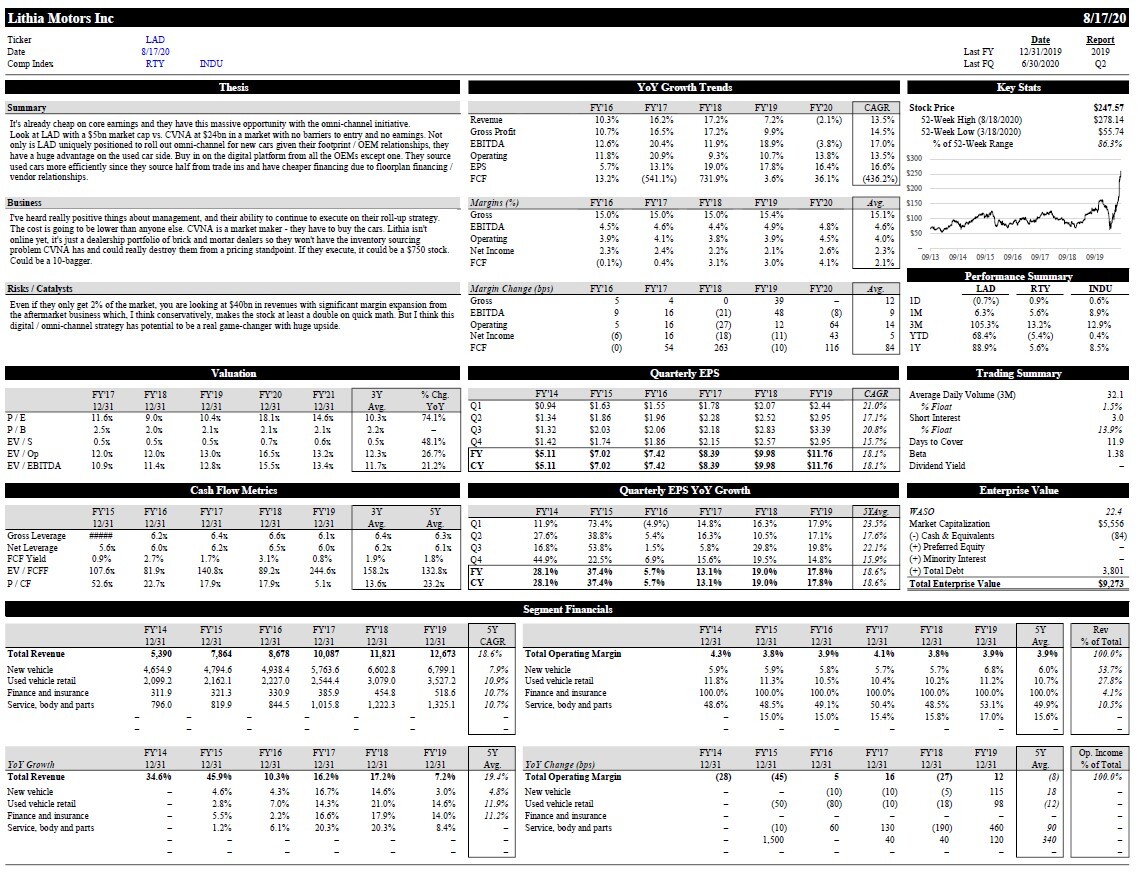
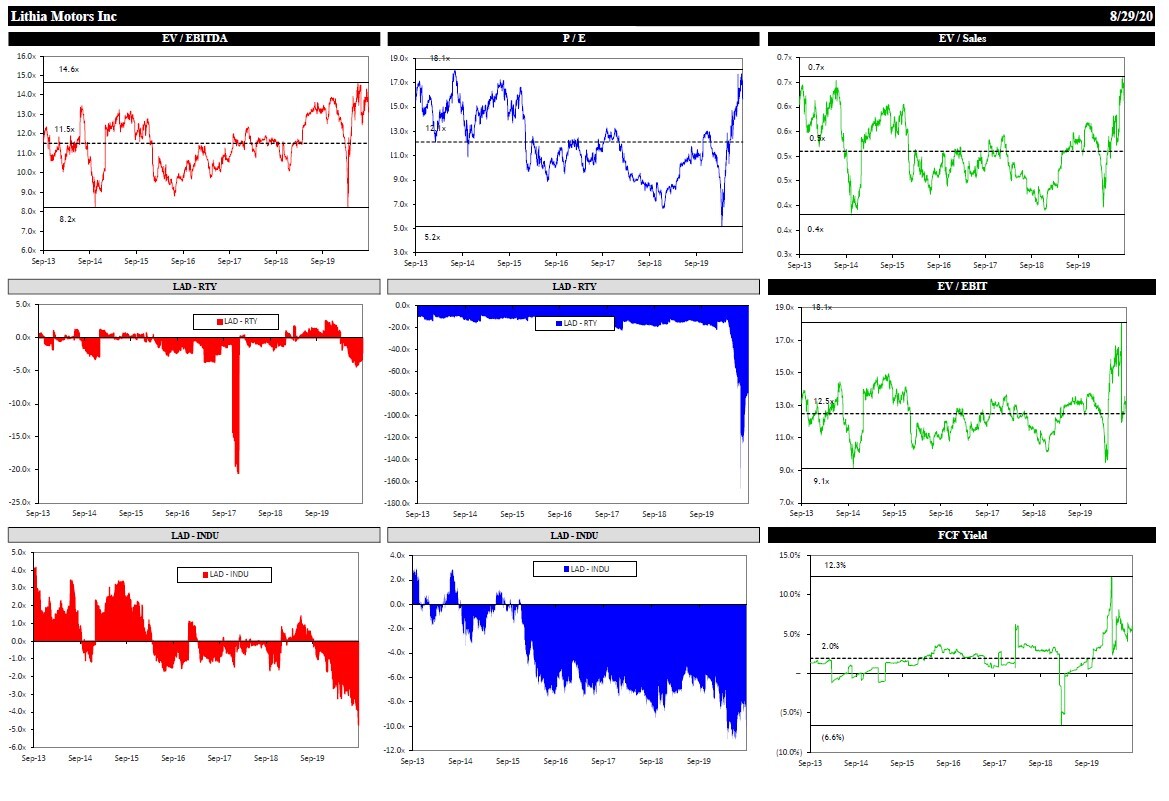
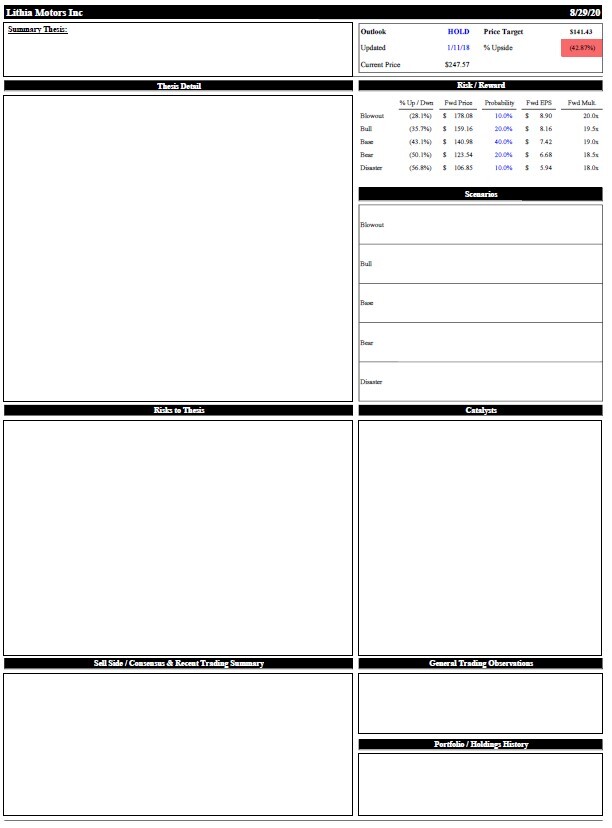
This is a three-page automated Bloomberg tear sheet designed to facilitate rapid idea generation and easy tracking for L/S equity generalists. Input the BBG ticker, two benchmark indices for valuation and return comparisons, and the reference date. The first page of the template automatically populates summary financial data, including sector financials, and trading stats, with room for a quick thesis summary and diligence notes. The second page graphs rolling 12M forward P/E, EV/EBITDA, EV/EBIT, EV/Sales, and Levered FCF Yield, as well as the relative valuation compared to the selected benchmark indices. The third page is a thesis template with price target calculation based on scenartio analysis. I've refined this over a decade on the buyside.


Key Features:
✔ Automated tear sheet—just enter a Bloomberg ticker, two comp indices, and a reference date.
✔ Rolling forward multiples charts—EV/EBITDA, P/E, P/B, EV/Sales, and more.
✔ Charts & valuation table auto-update.
✔ Editable thesis & summary page—customize with your own insights.
✔ Designed for institutional investors, hedge fund analysts, and finance professionals.✔ Formatted for easy printing 

🎯 Who This is For:
  • Hedge fund analysts
  • Institutional investors
  • Equity research professionals
  • Anyone who builds stock research reports

This Best Practice includes
1 excel template

Acquire business license for $199.00

Add to cart

Add to bookmarks

Discuss


0.0 / 5 (0 votes)

please wait...