


Originally published: 06/03/2018 15:42
Publication number: ELQ-19088-1
View all versions & Certificate
Publication number: ELQ-19088-1
View all versions & Certificate

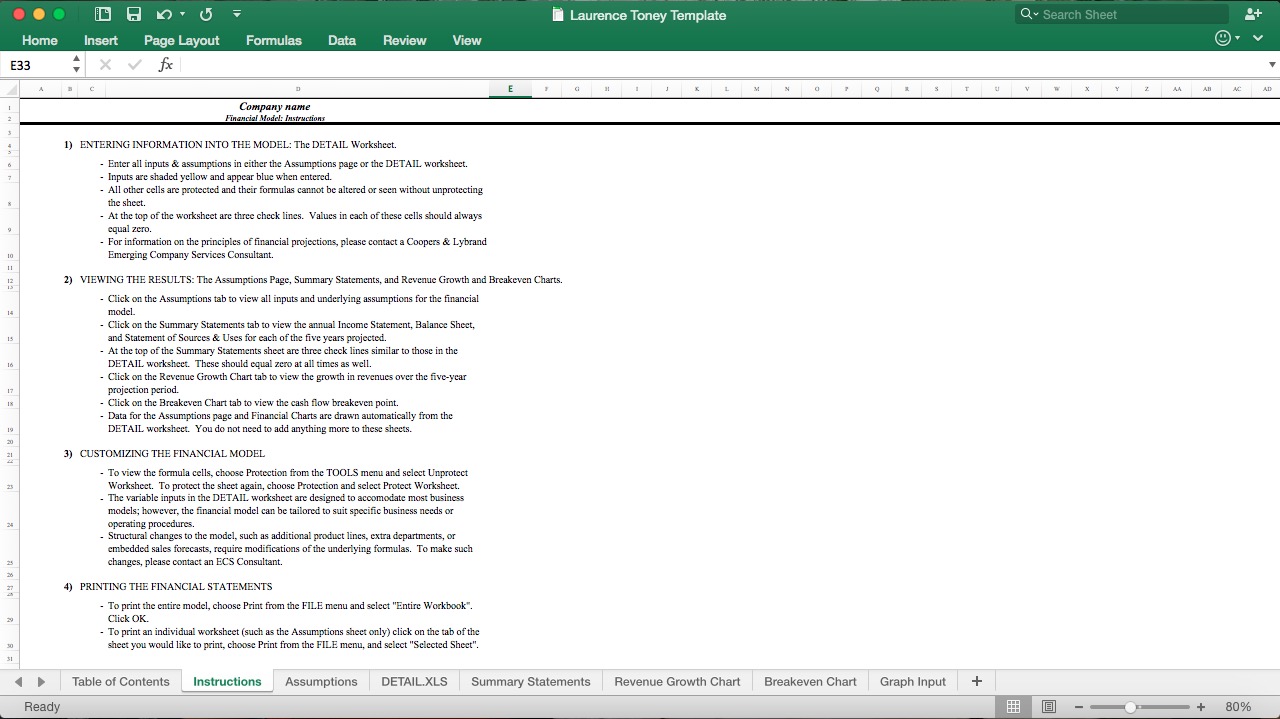
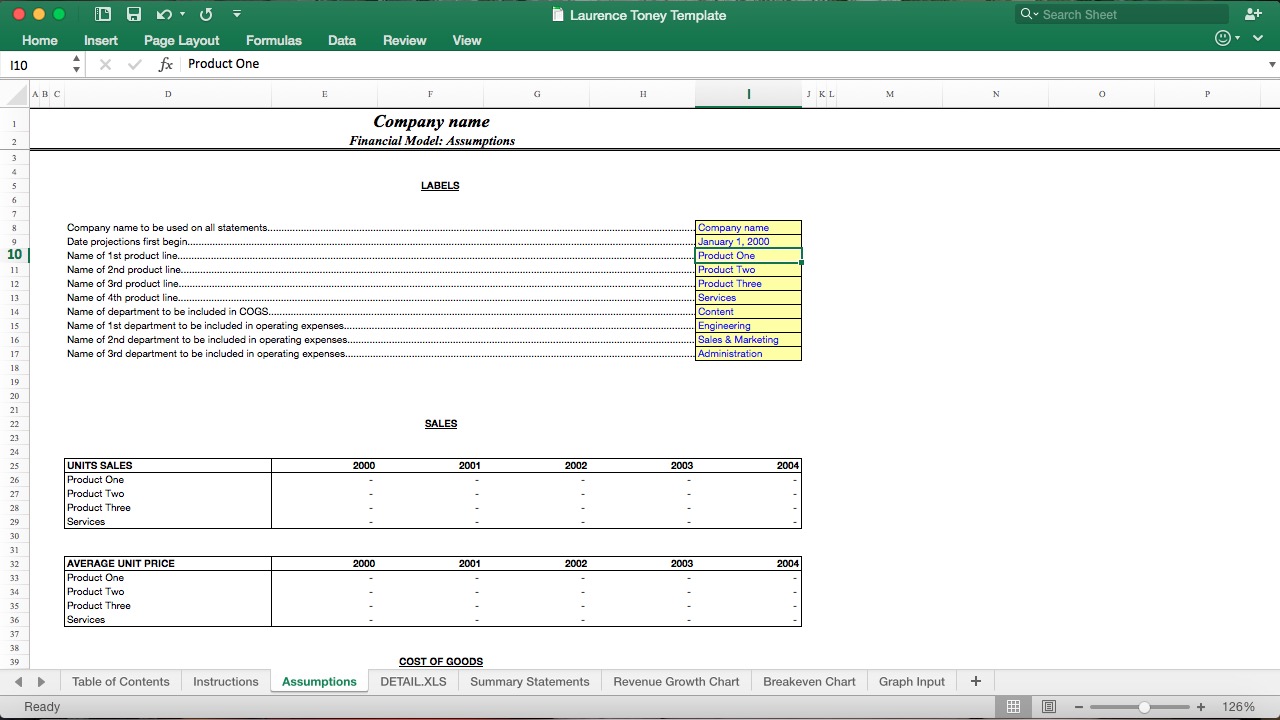
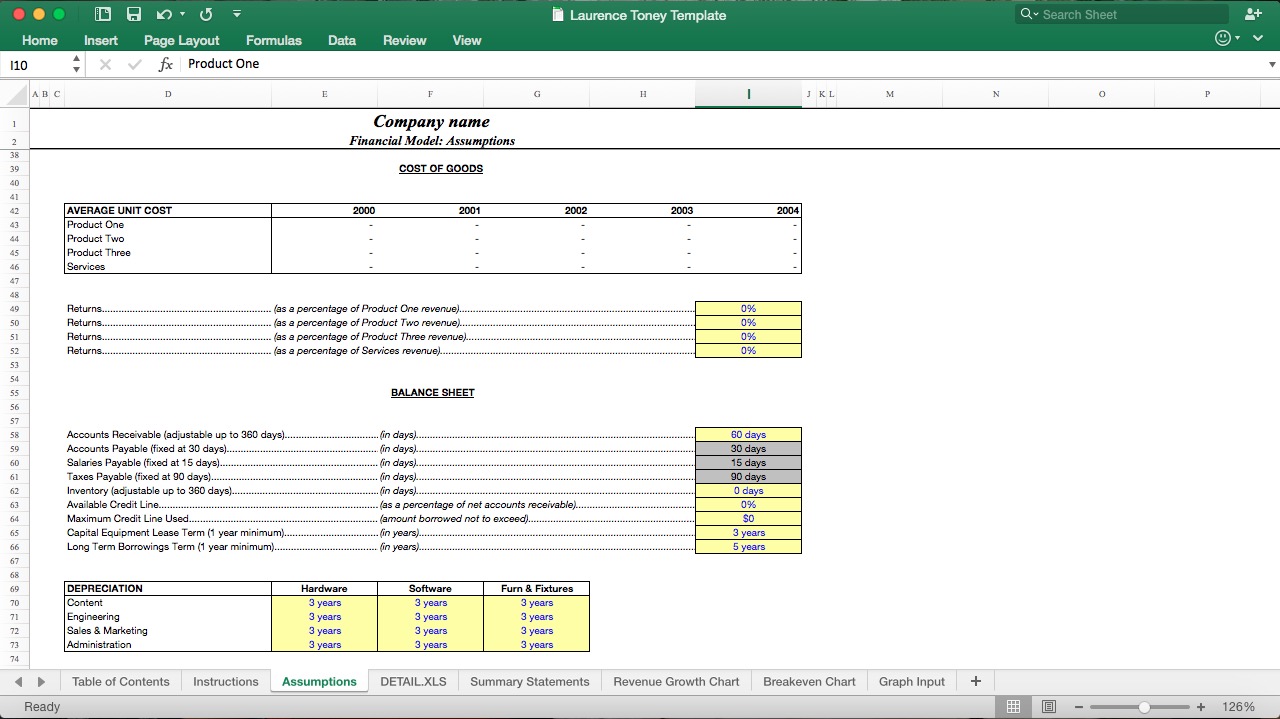
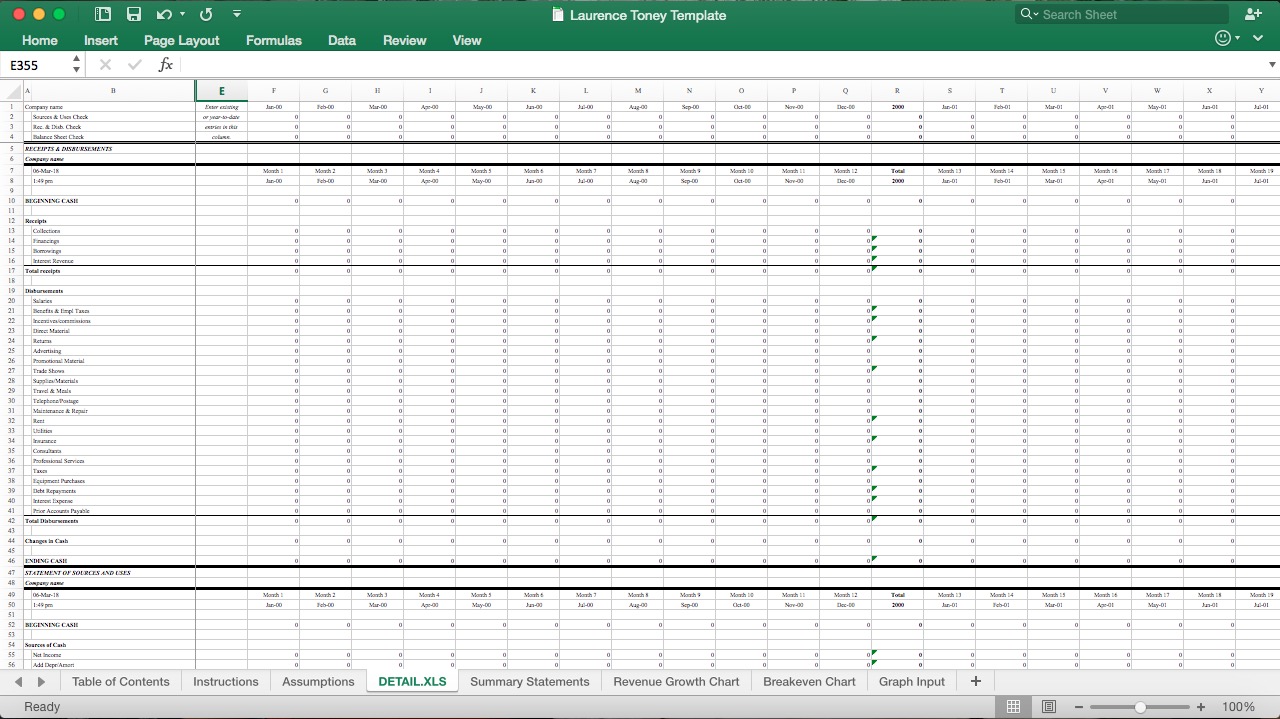
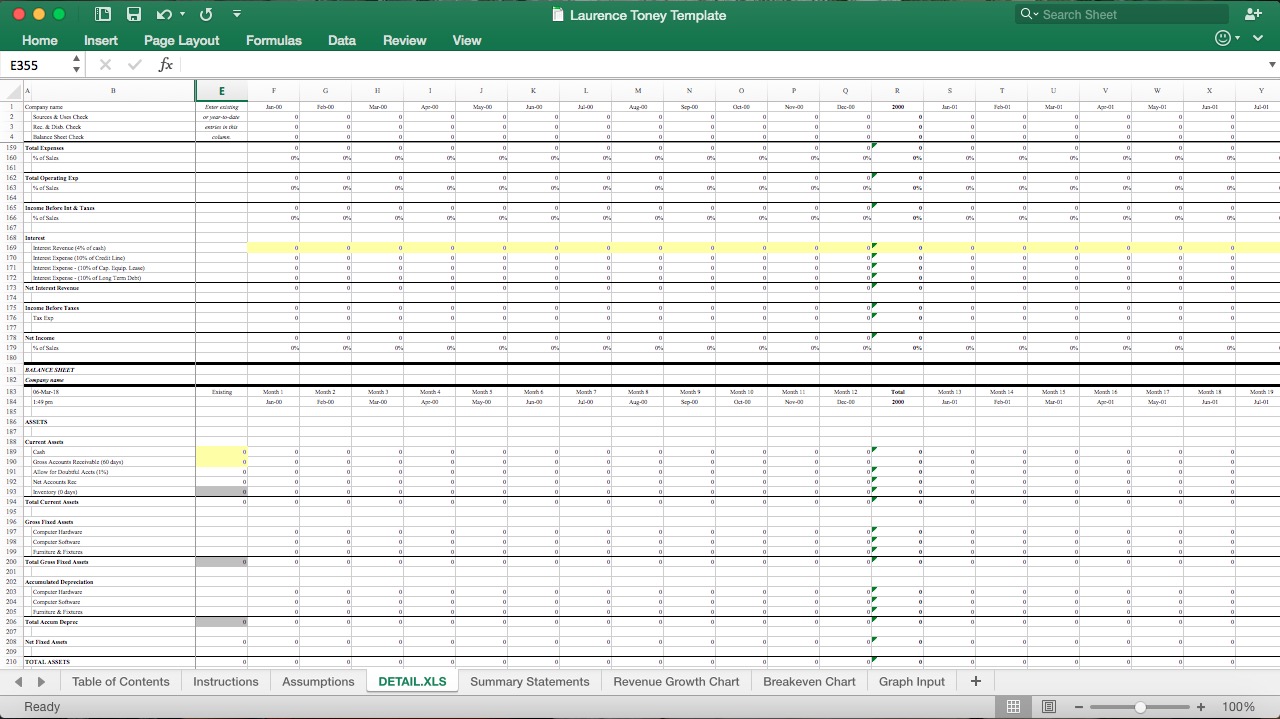
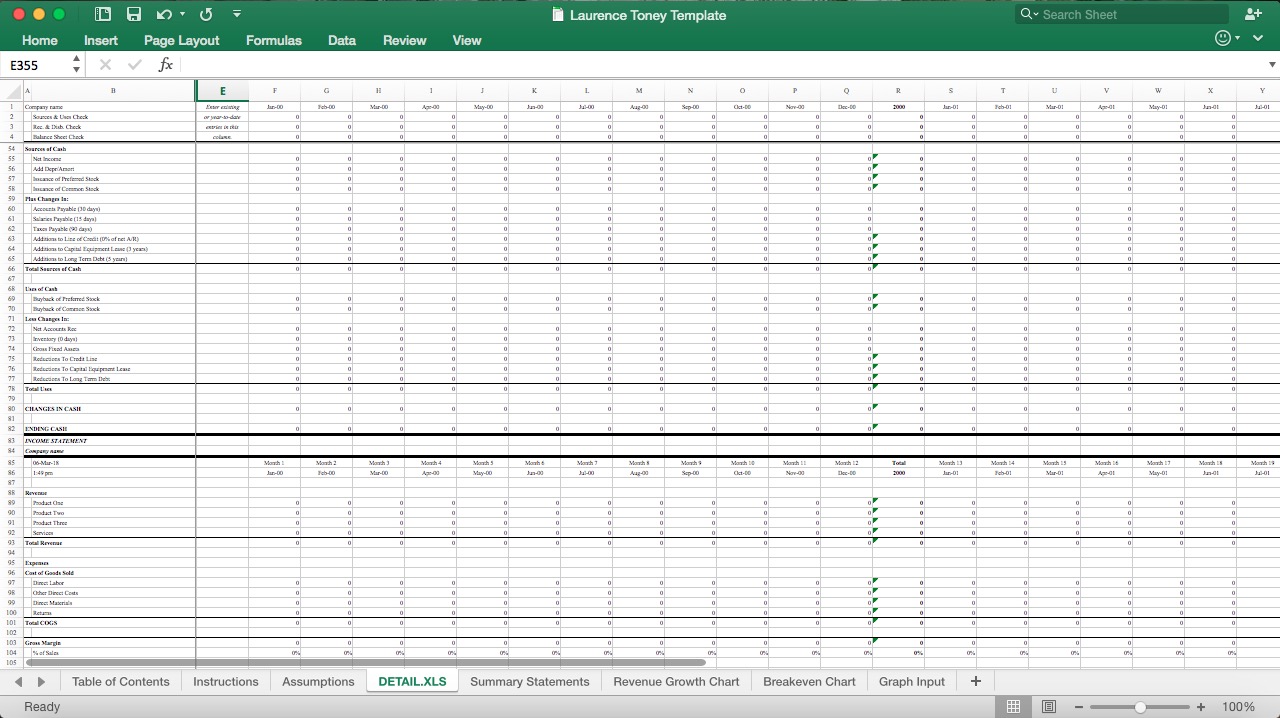
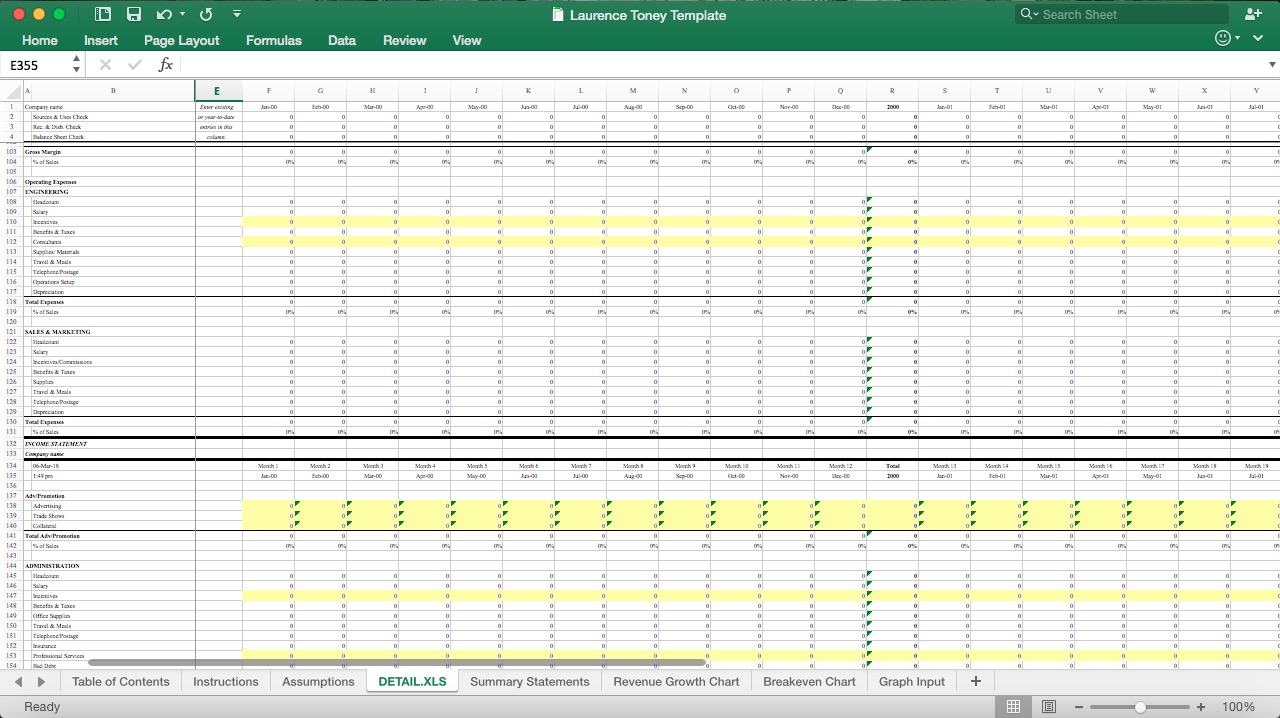
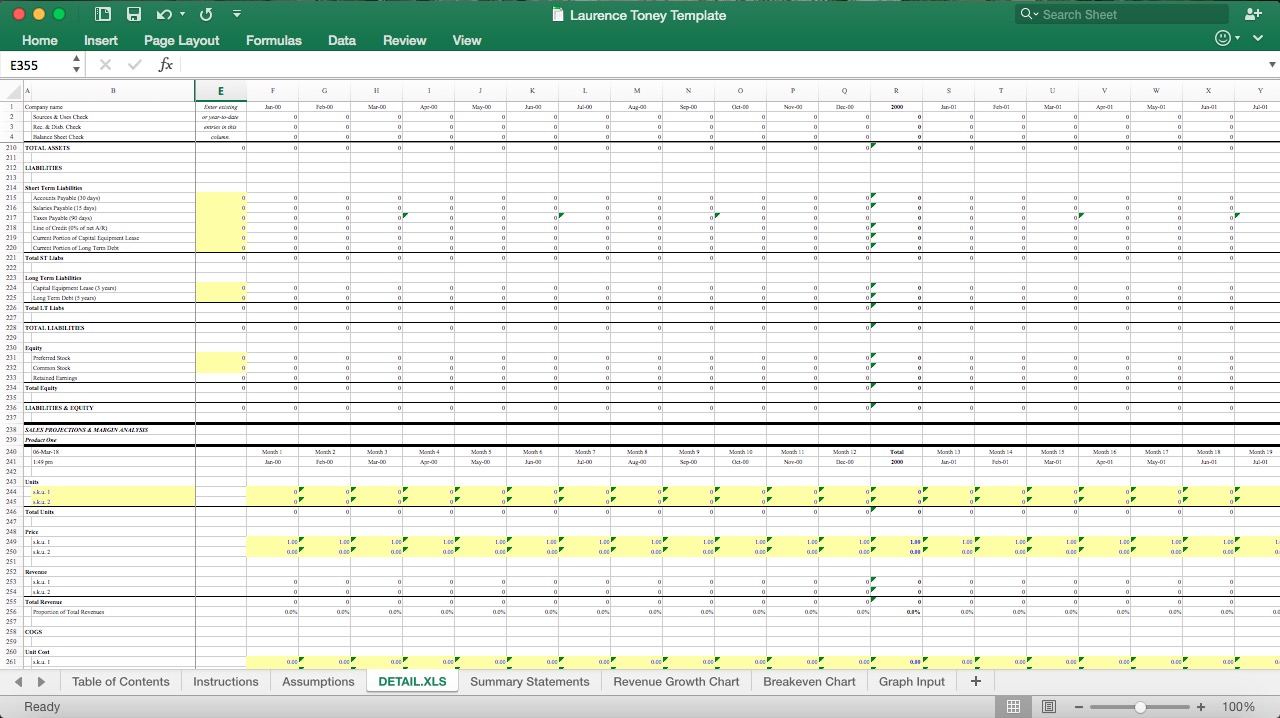
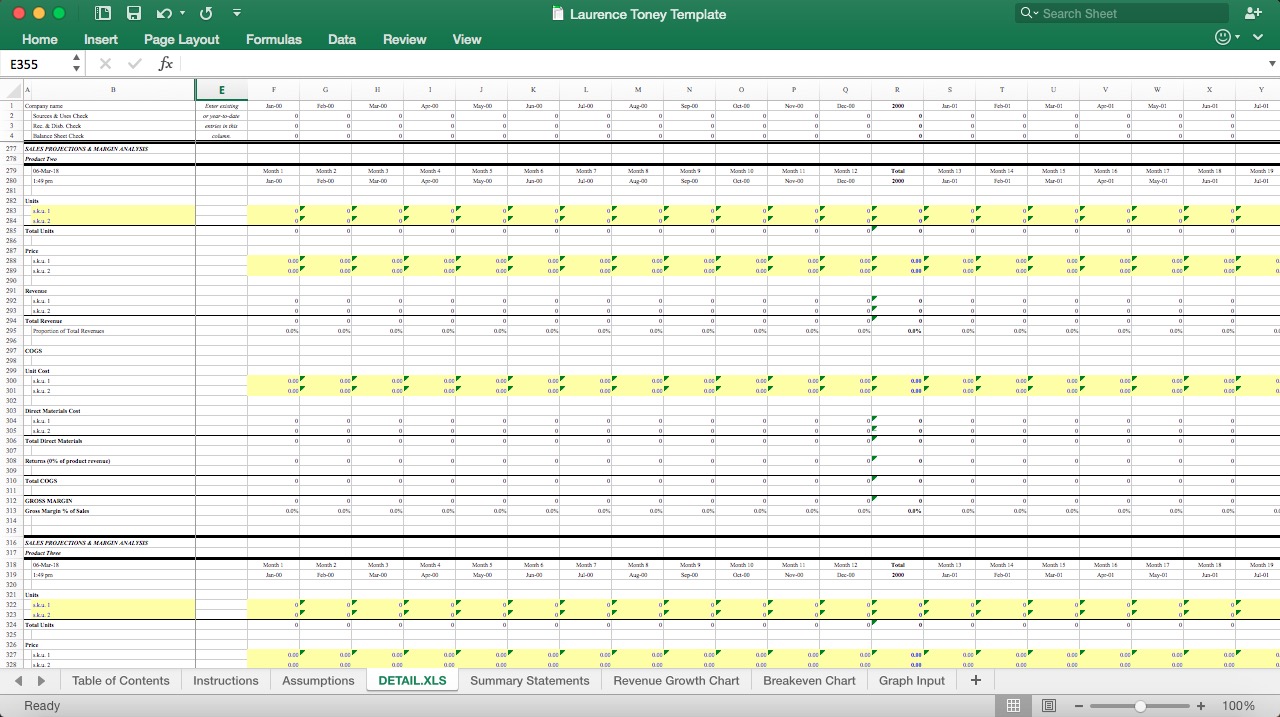
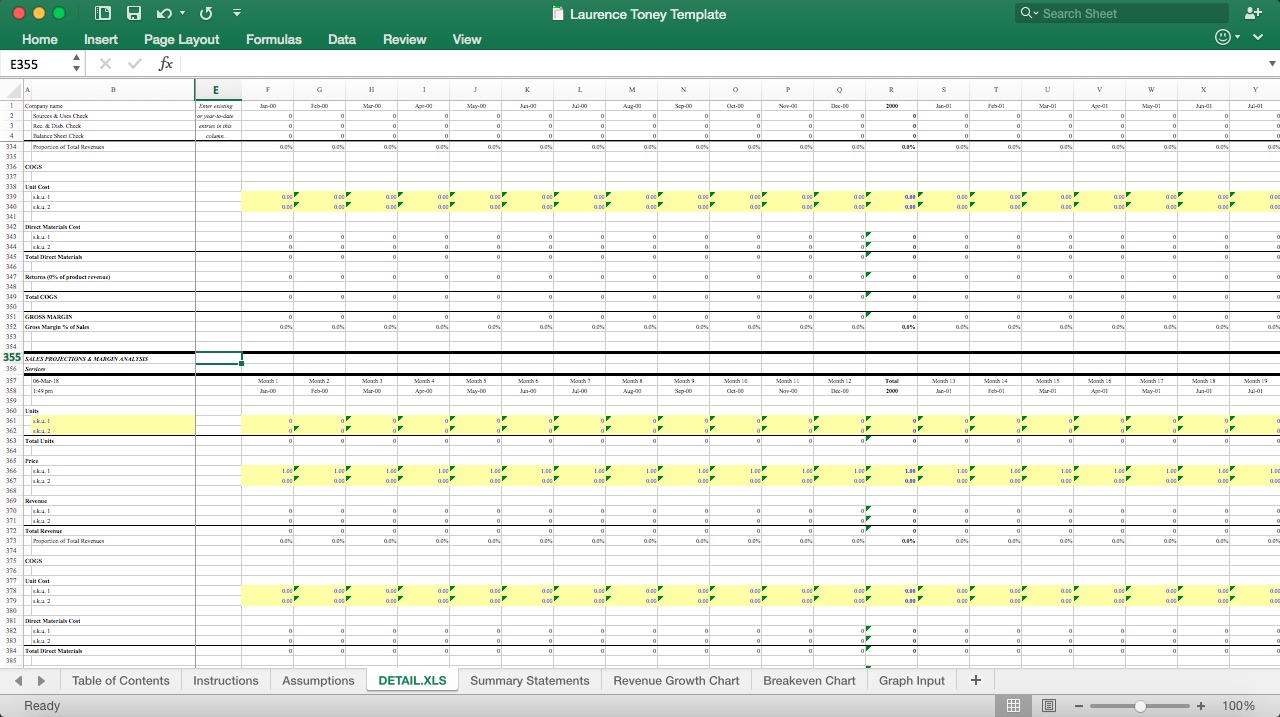
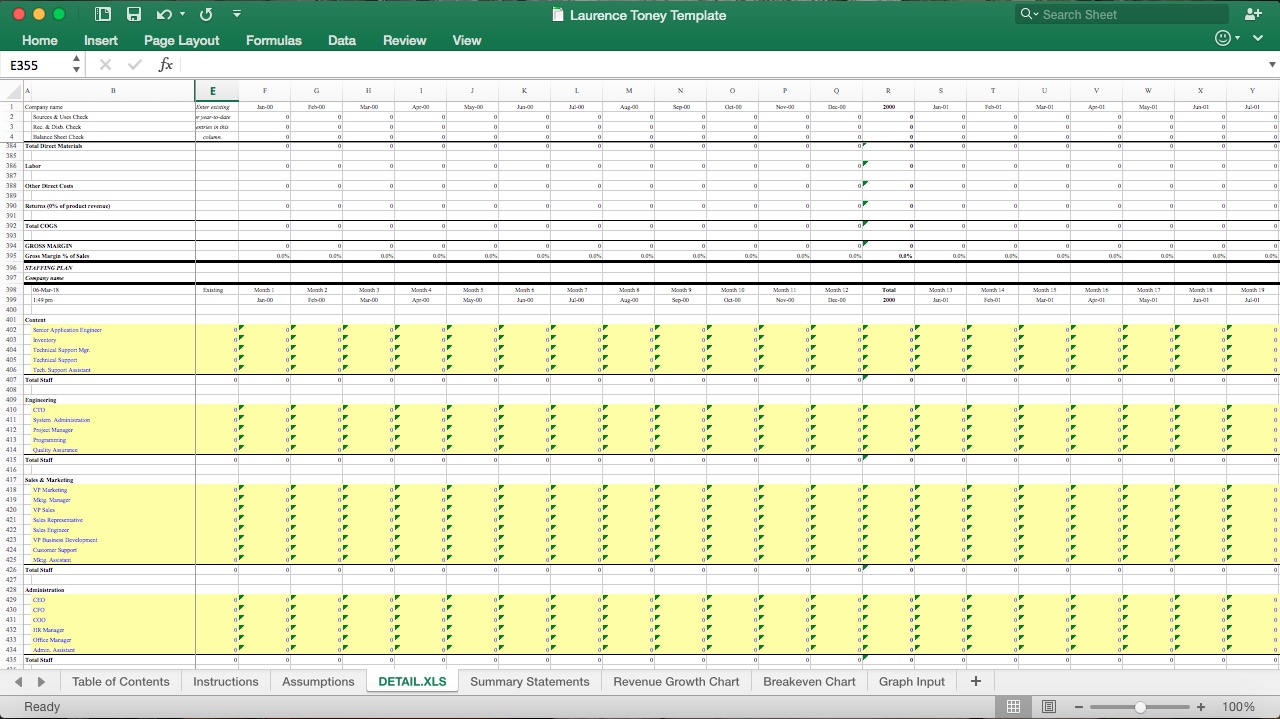
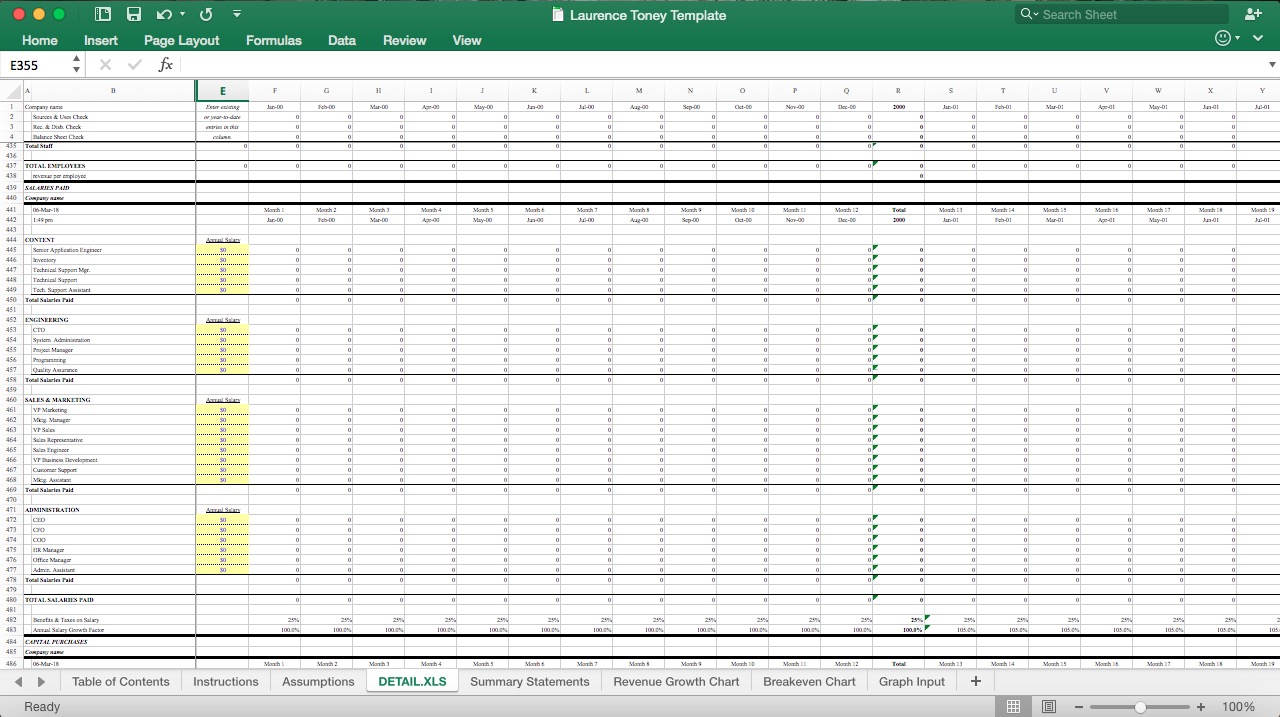
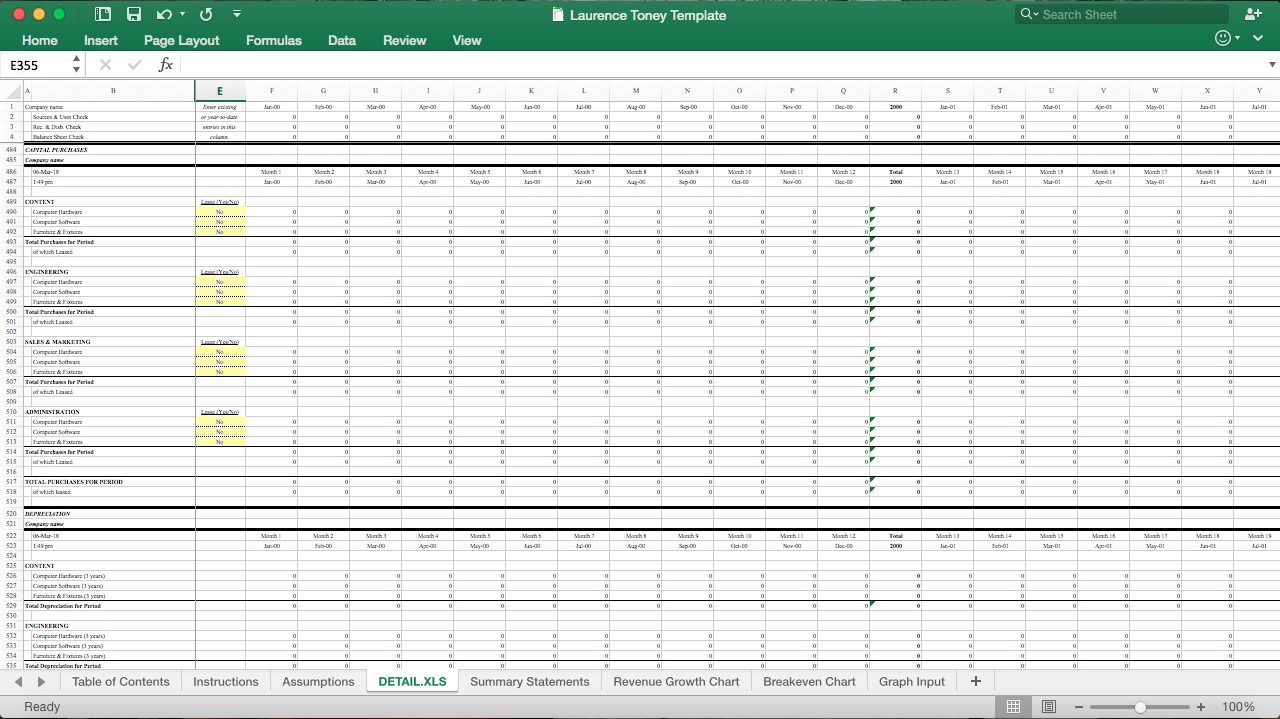
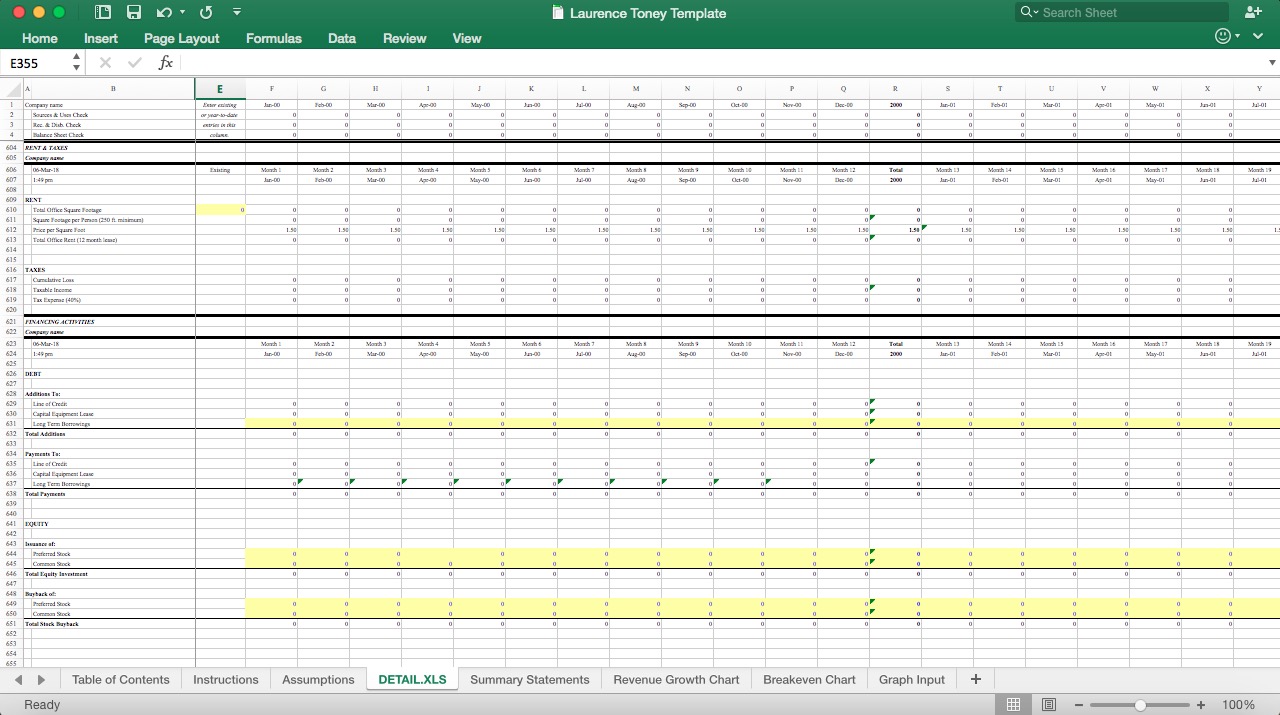
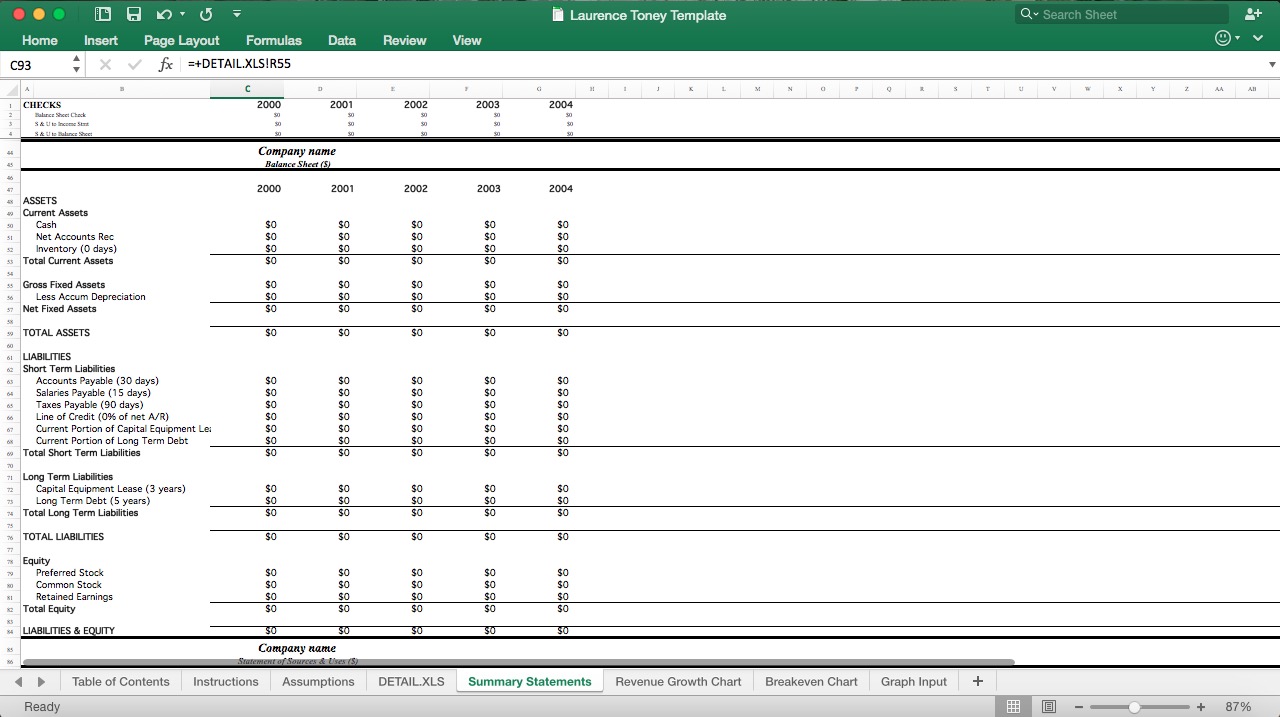
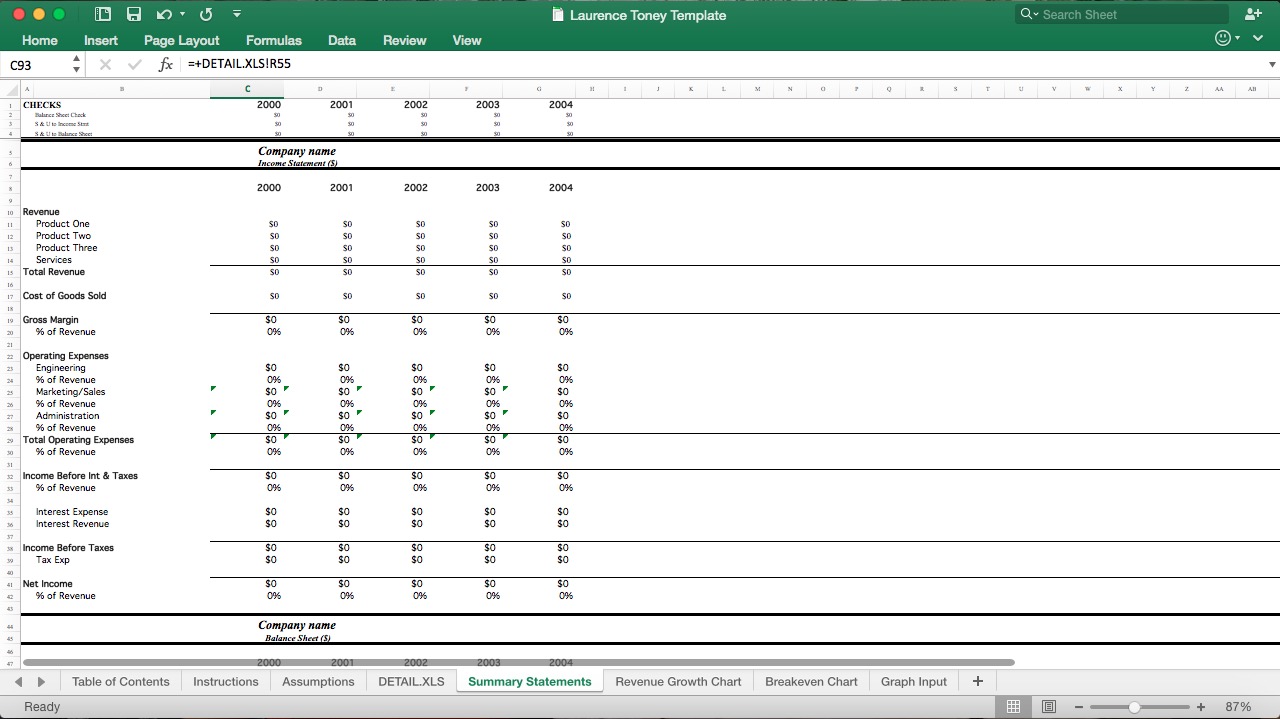
Overall Business Excel Financial Model
This financial model will give you a broad yet detailed overview of your business' financial performance.
