
Publication number: ELQ-30344-1
View all versions & Certificate

Expense Analysis Dashboard | Excel Cost Tracking, Vendor Spend & Financial KPI Template
Interactive Excel dashboard to track vendor expenses, department-wise spending, monthly cost trends, and financial KPIs for effective expense analysis and cost
Further information
1. Objectives of This Downloadable Best Practice
Track and analyze business expenses through an interactive Excel dashboard.
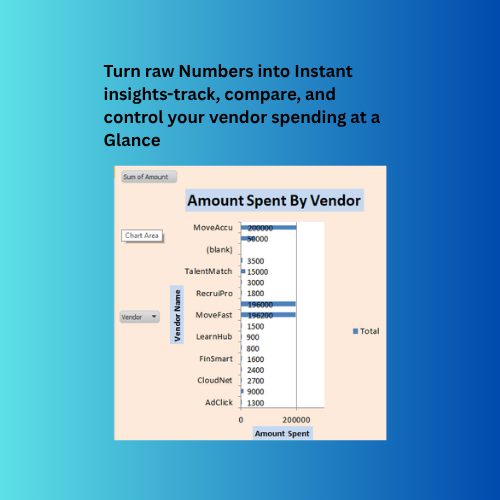
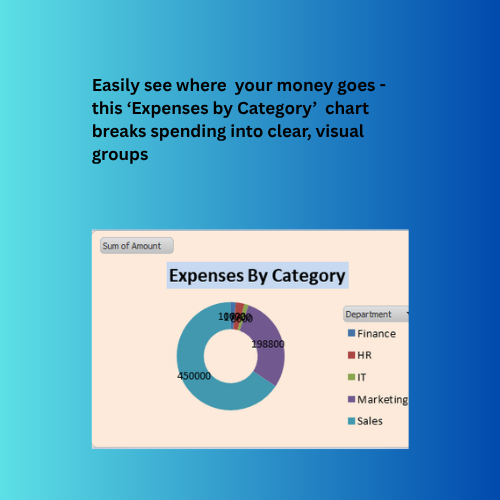
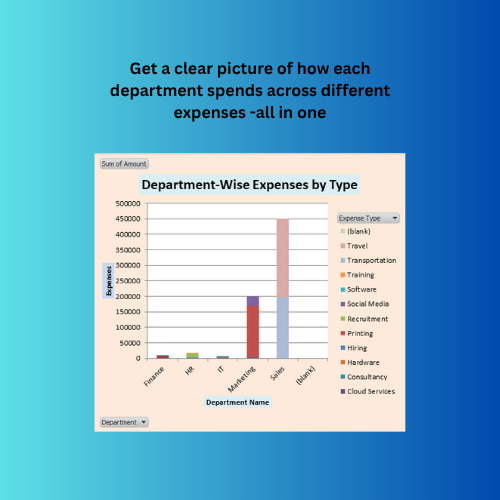
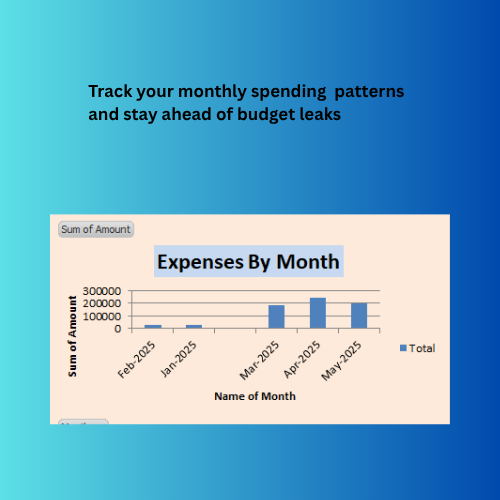
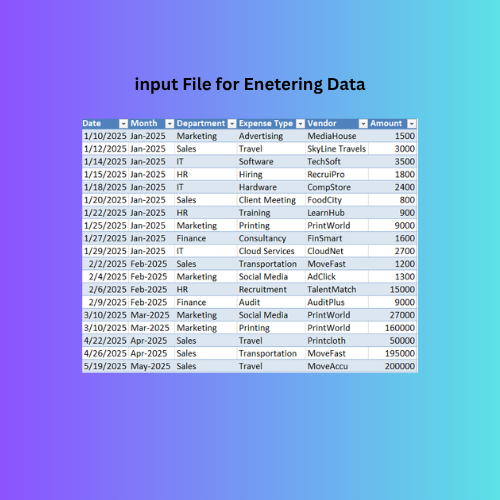
Monitor vendor-wise, department-wise, and monthly spending trends.
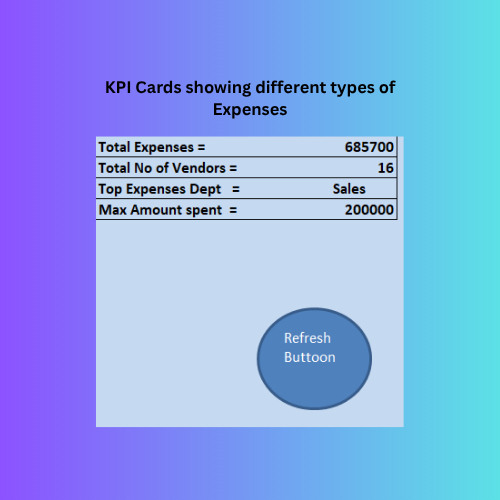
Identify the top expense vendor and department for better cost control.
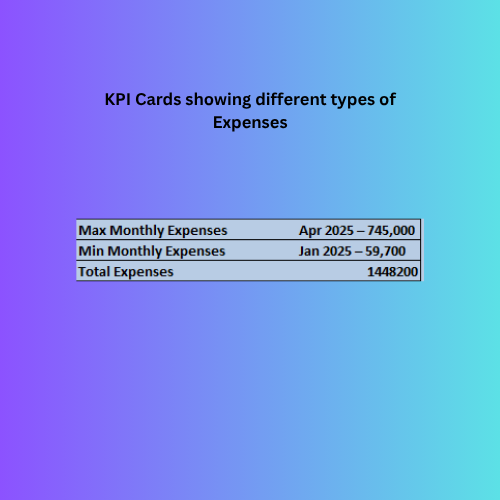
Compare maximum and minimum monthly expenses to analyze financial patterns.
Support budget planning and cost optimization through KPI-based reporting.
Provide quick financial insights using KPI cards such as total vendors, total expenses, and top spend areas.
Improve decision-making with clear charts, pivot tables, and automated calculations.
Reduce manual reporting time by using dynamic formulas and refresh-enabled summaries.
2. Conditions for Which This Downloadable Best Practice Applies Best
Small and medium businesses managing operational expenses in Excel.
Finance teams preparing monthly expense and cost reports.
Organizations needing vendor spend analysis and department-wise cost monitoring.
Users looking for an affordable, easy-to-use Excel-based expense tracking solution.
Consultants, accountants, and analysts creating financial performance reports.
Businesses that rely on manual Excel reporting instead of ERP systems.
3. Conditions for Which This Downloadable Best Practice Does Not Apply Best
Large organizations using ERP, SAP, Oracle, or cloud finance systems.
Businesses requiring real-time multi-user reporting and live database connections.
Companies needing advanced invoice processing, tax automation, or auditing workflows.
Users who require mobile app access or web-based dashboards instead of Excel.
Organizations with highly complex enterprise-level financial systems.
