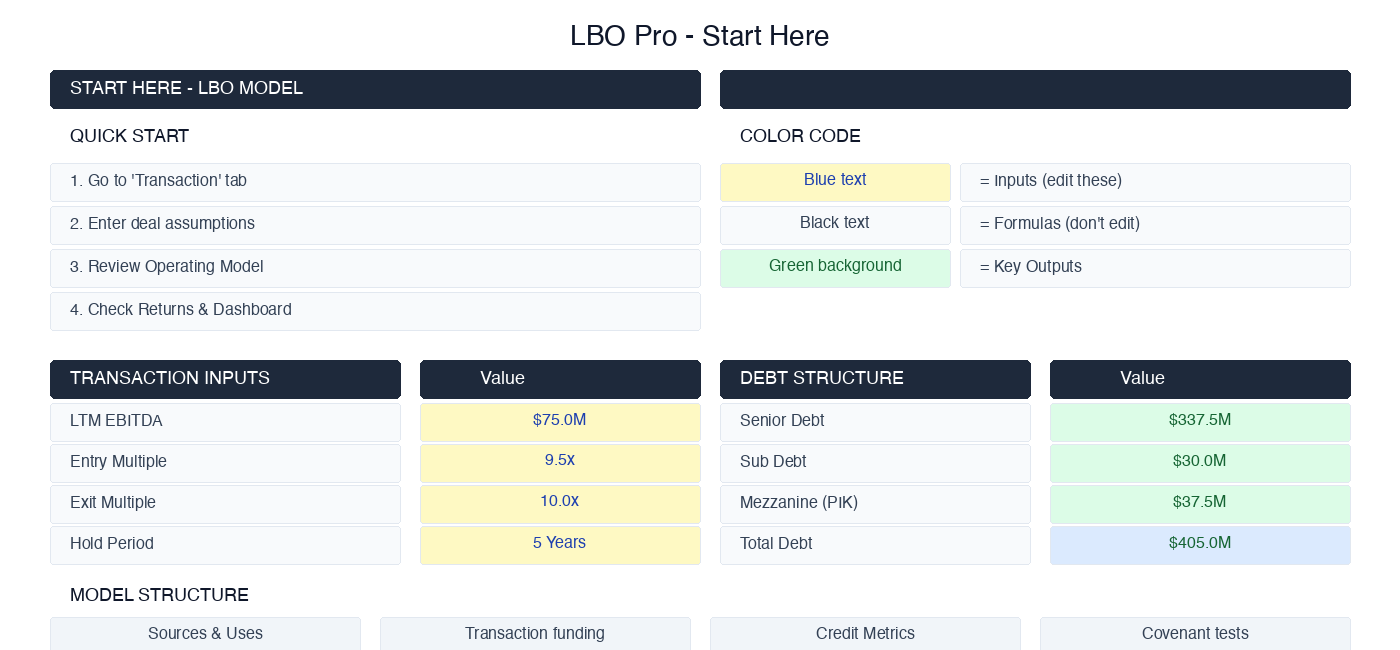
LBO Model Template - 3 Debt Tranches, Covenant Tests & 3 Sensitivity Grids
Originally published: 07/08/2026 12:58
Publication number: ELQ-20280-1
View all versions & Certificate
certified

LBO Model Template - 3 Debt Tranches, Covenant Tests & 3 Sensitivity Grids

5-year LBO in Excel: senior, sub and mezzanine tranches with PIK, per-year covenant PASS/BREACH tests, IRR/MOIC bridge, three 2-way sensitivity grids.

Description
What this model does
FinModelAI LBO Pro is a 12-tab leveraged buyout model in Excel, built on 404 live formulas and 7 charts. It takes a target from LTM EBITDA and an entry multiple through a funded capital structure, a five-year operating and debt schedule, a covenant test and an exit, and reports IRR, MOIC and cash-on-cash at both deal and sponsor level. No macros, no VBA, no add-ins.

Sources & Uses that actually balance
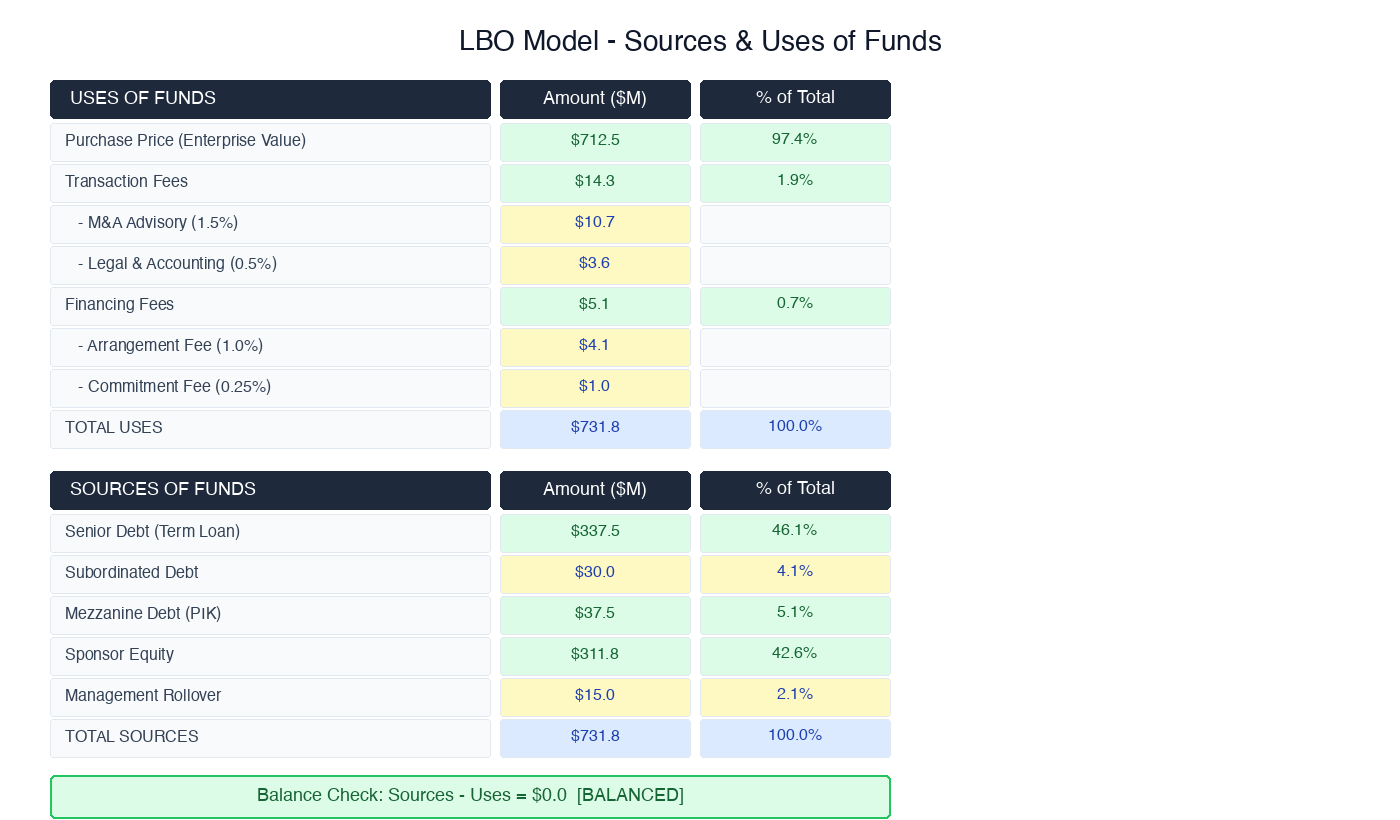
Uses cover purchase price, M&A advisory and legal fees, arrangement fee and commitment fee, each computed from its own rate assumption rather than typed in. Sources cover senior term loan, subordinated debt, mezzanine, sponsor equity and management rollover, each as a percentage of the total. A dedicated balance check line reports Sources minus Uses so the funding cannot silently drift out of balance while you change assumptions.

Three debt tranches, not one
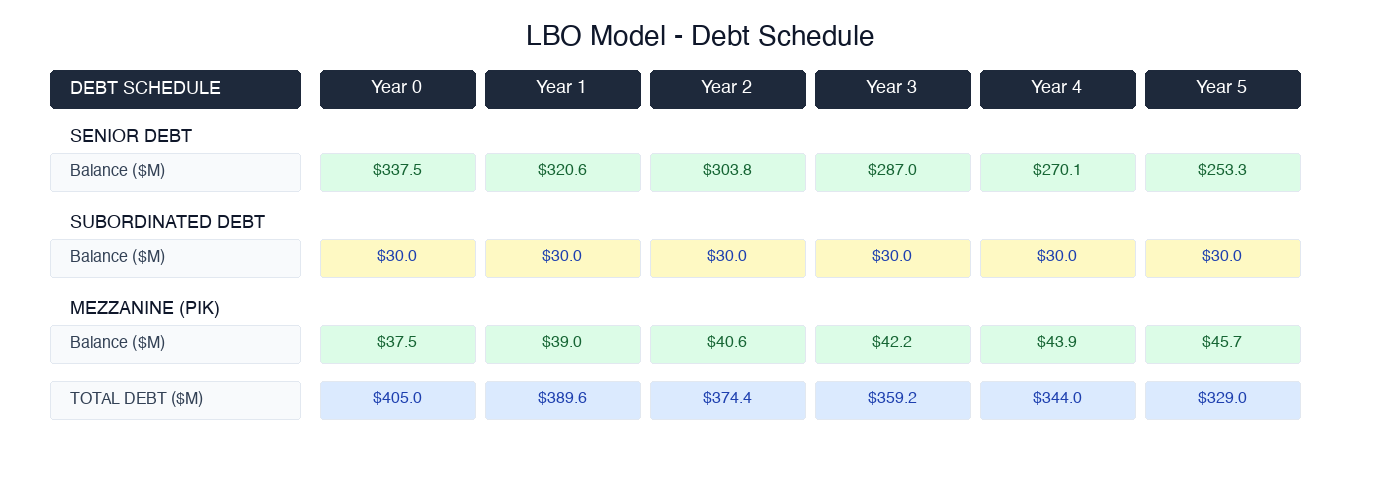
Senior term loan sized off a debt / EBITDA multiple, subordinated debt at its own coupon, and mezzanine with both a cash interest rate and a separate PIK rate that accretes. The Debt Schedule tab carries 106 formulas across the amortisation, interest and closing-balance rows for the full five-year hold. Management rollover is modelled explicitly and its share of total equity is reported.

Covenant testing, year by year
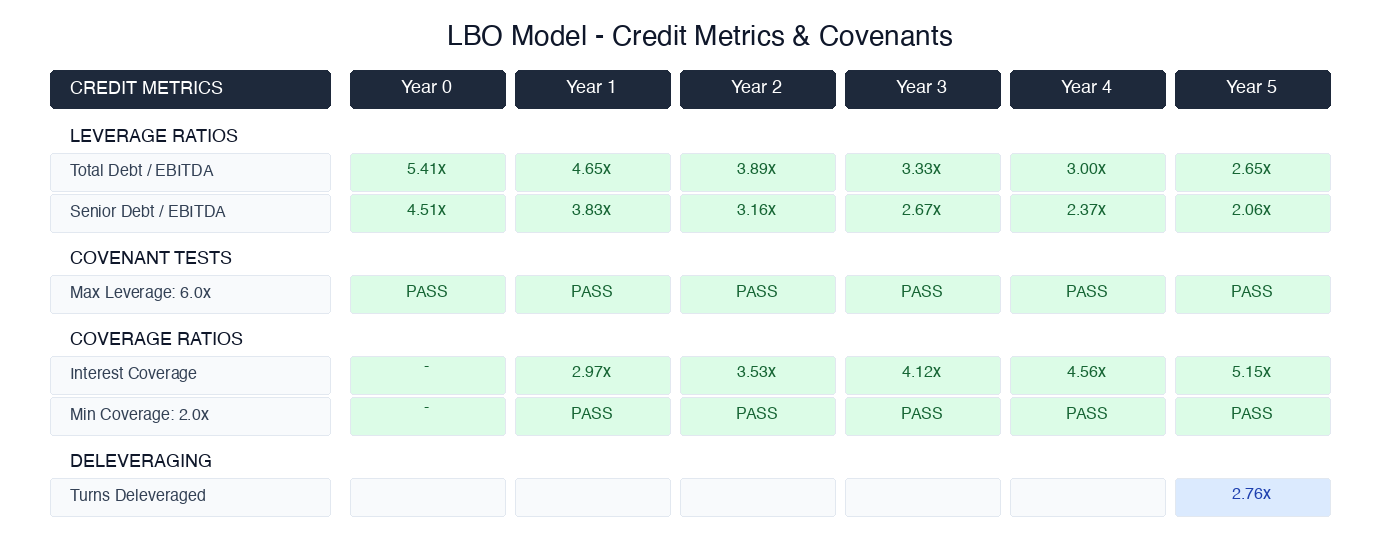
The Credit Metrics tab computes total debt / EBITDA, senior debt / EBITDA and net debt / EBITDA, then interest coverage, fixed charge coverage and debt service coverage for years 0 through 5. Two covenants are then tested against thresholds you set - a maximum total leverage and a minimum interest coverage - and each year returns PASS or BREACH. A deleveraging summary reports entry leverage, exit leverage and the number of turns paid down. This is the tab that tells you whether the structure is financeable before you present it.

Returns decomposed, not just reported
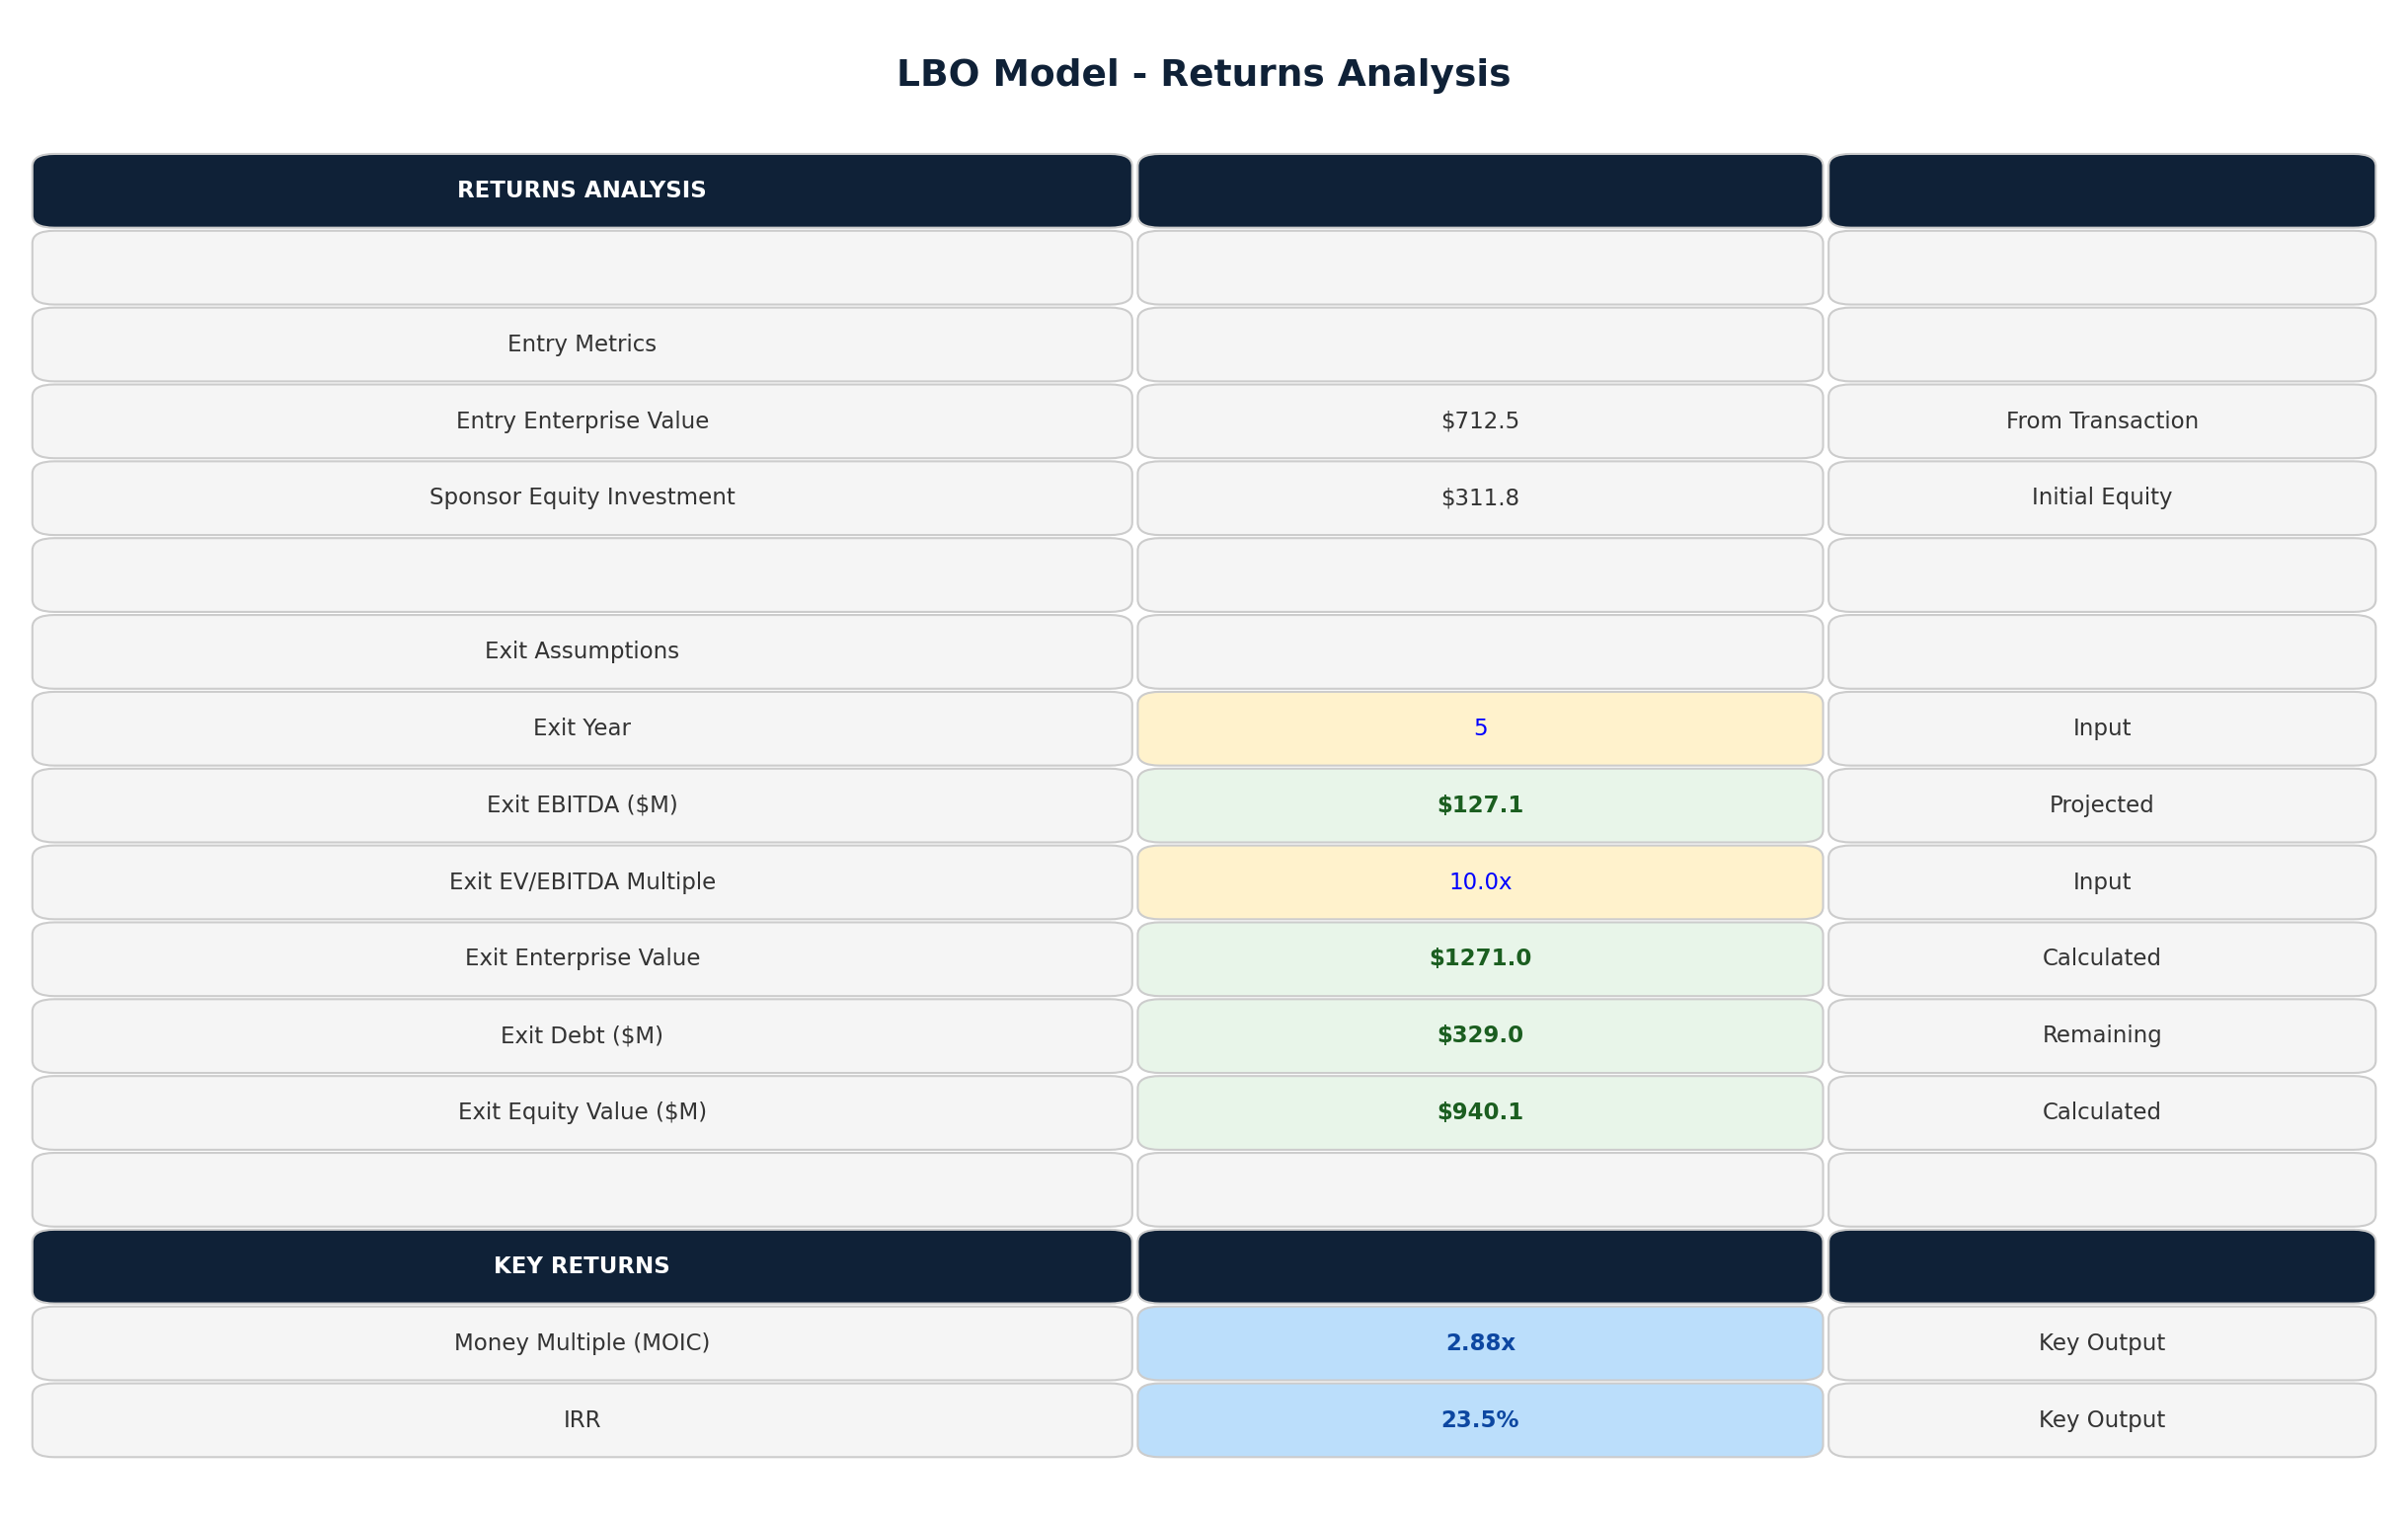
The Returns tab gives MOIC, IRR and cash-on-cash, plus a value creation bridge that splits exit equity into entry equity, EBITDA growth, multiple expansion and debt paydown. Sponsor-level returns are computed separately from deal-level returns, so management rollover dilution is visible in the sponsor MOIC and IRR rather than buried in a blended number.

Three 2-way sensitivity grids

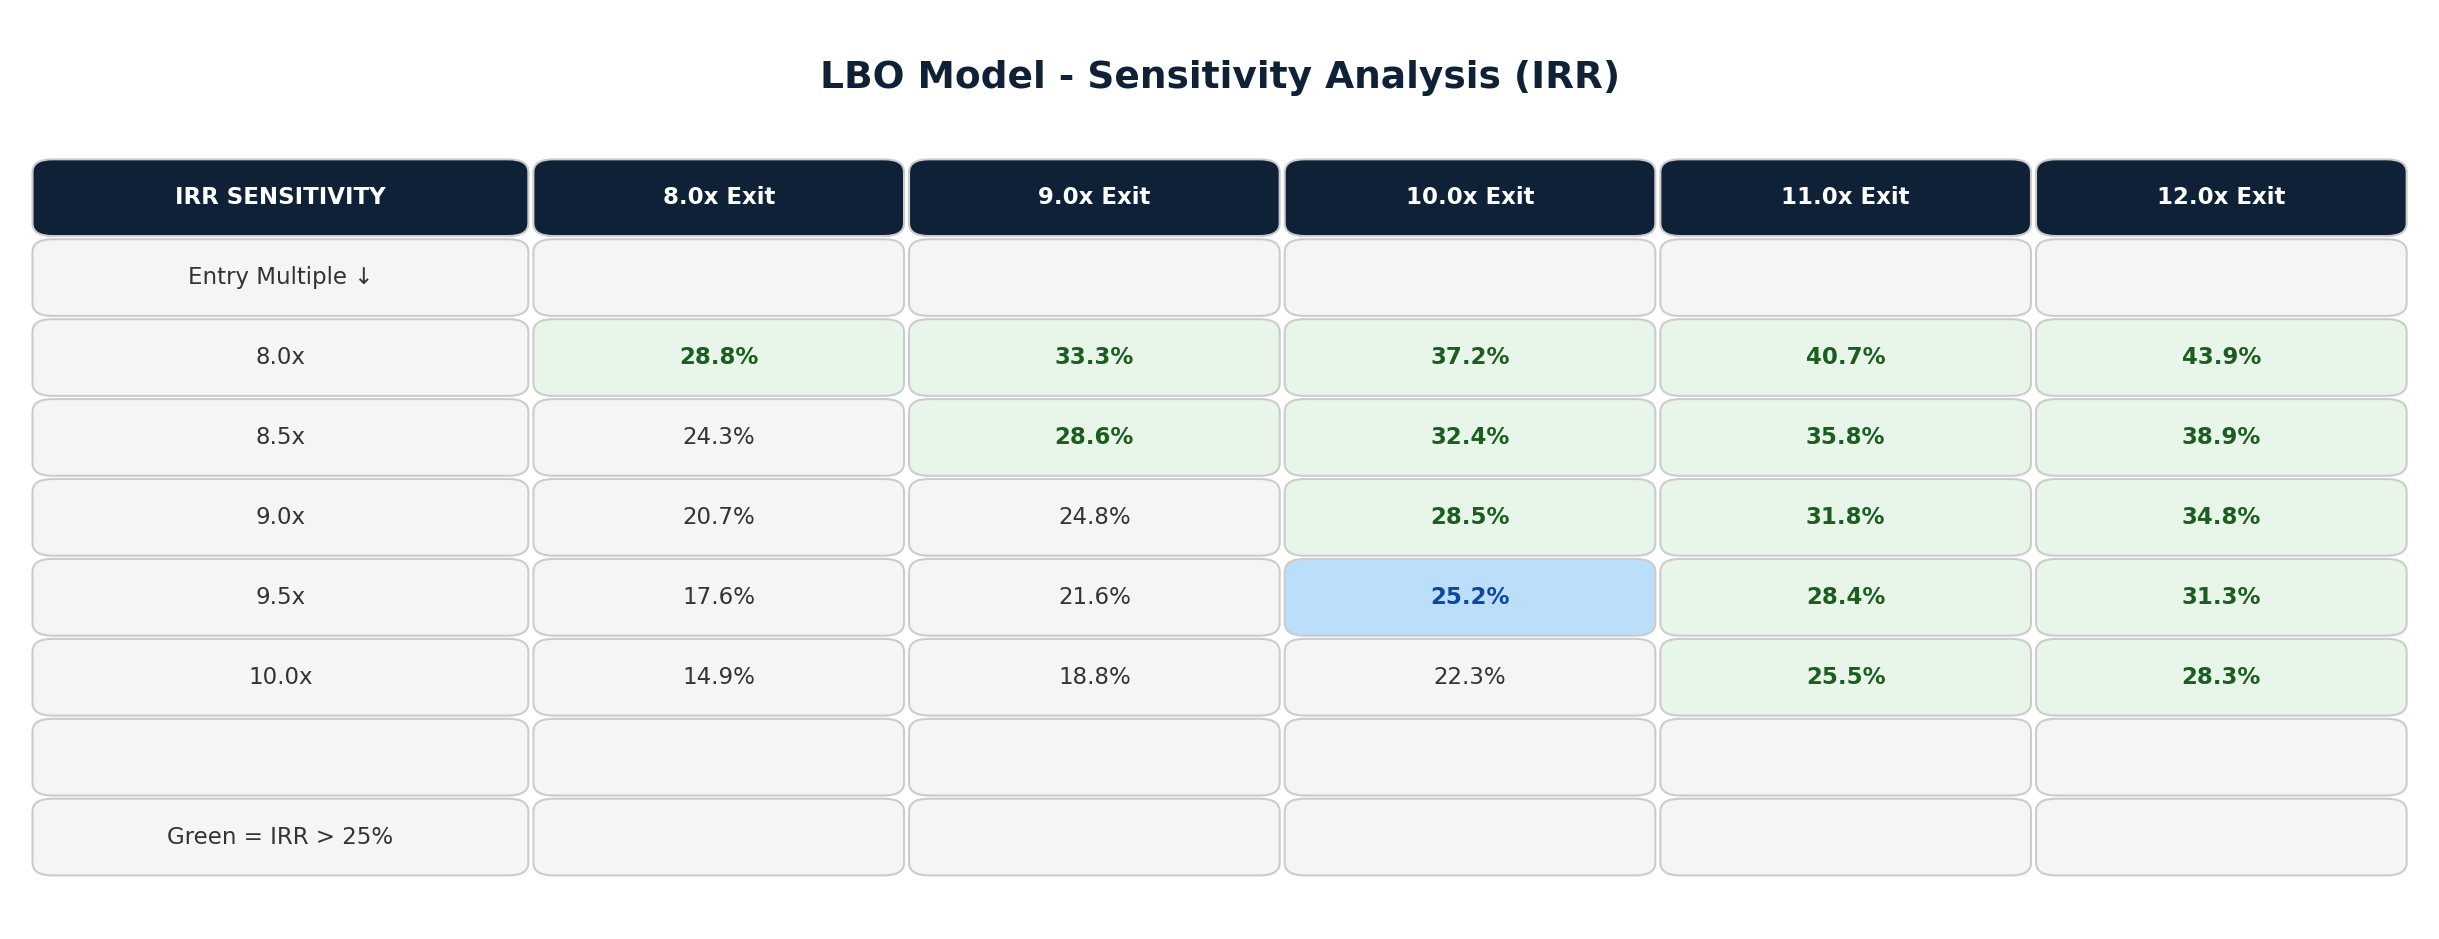
IRR across entry multiple (8.0x to 10.0x) crossed with exit multiple (8.0x to 12.0x). MOIC across revenue CAGR (4% to 12%) crossed with exit EBITDA margin (20% to 28%). IRR across senior leverage (4.0x to 6.0x debt / EBITDA) crossed with exit multiple. Each grid is a 5 by 5 recomputation, colour-banded so the financeable region is readable at a glance.

The 12 tabs
START HERE · Sources & Uses · Assumptions · Transaction · Operating Model · Debt Schedule · Credit Metrics · Returns · Sensitivity · Dashboard · Documentation · Scenarios

Benchmarks and scenario reference
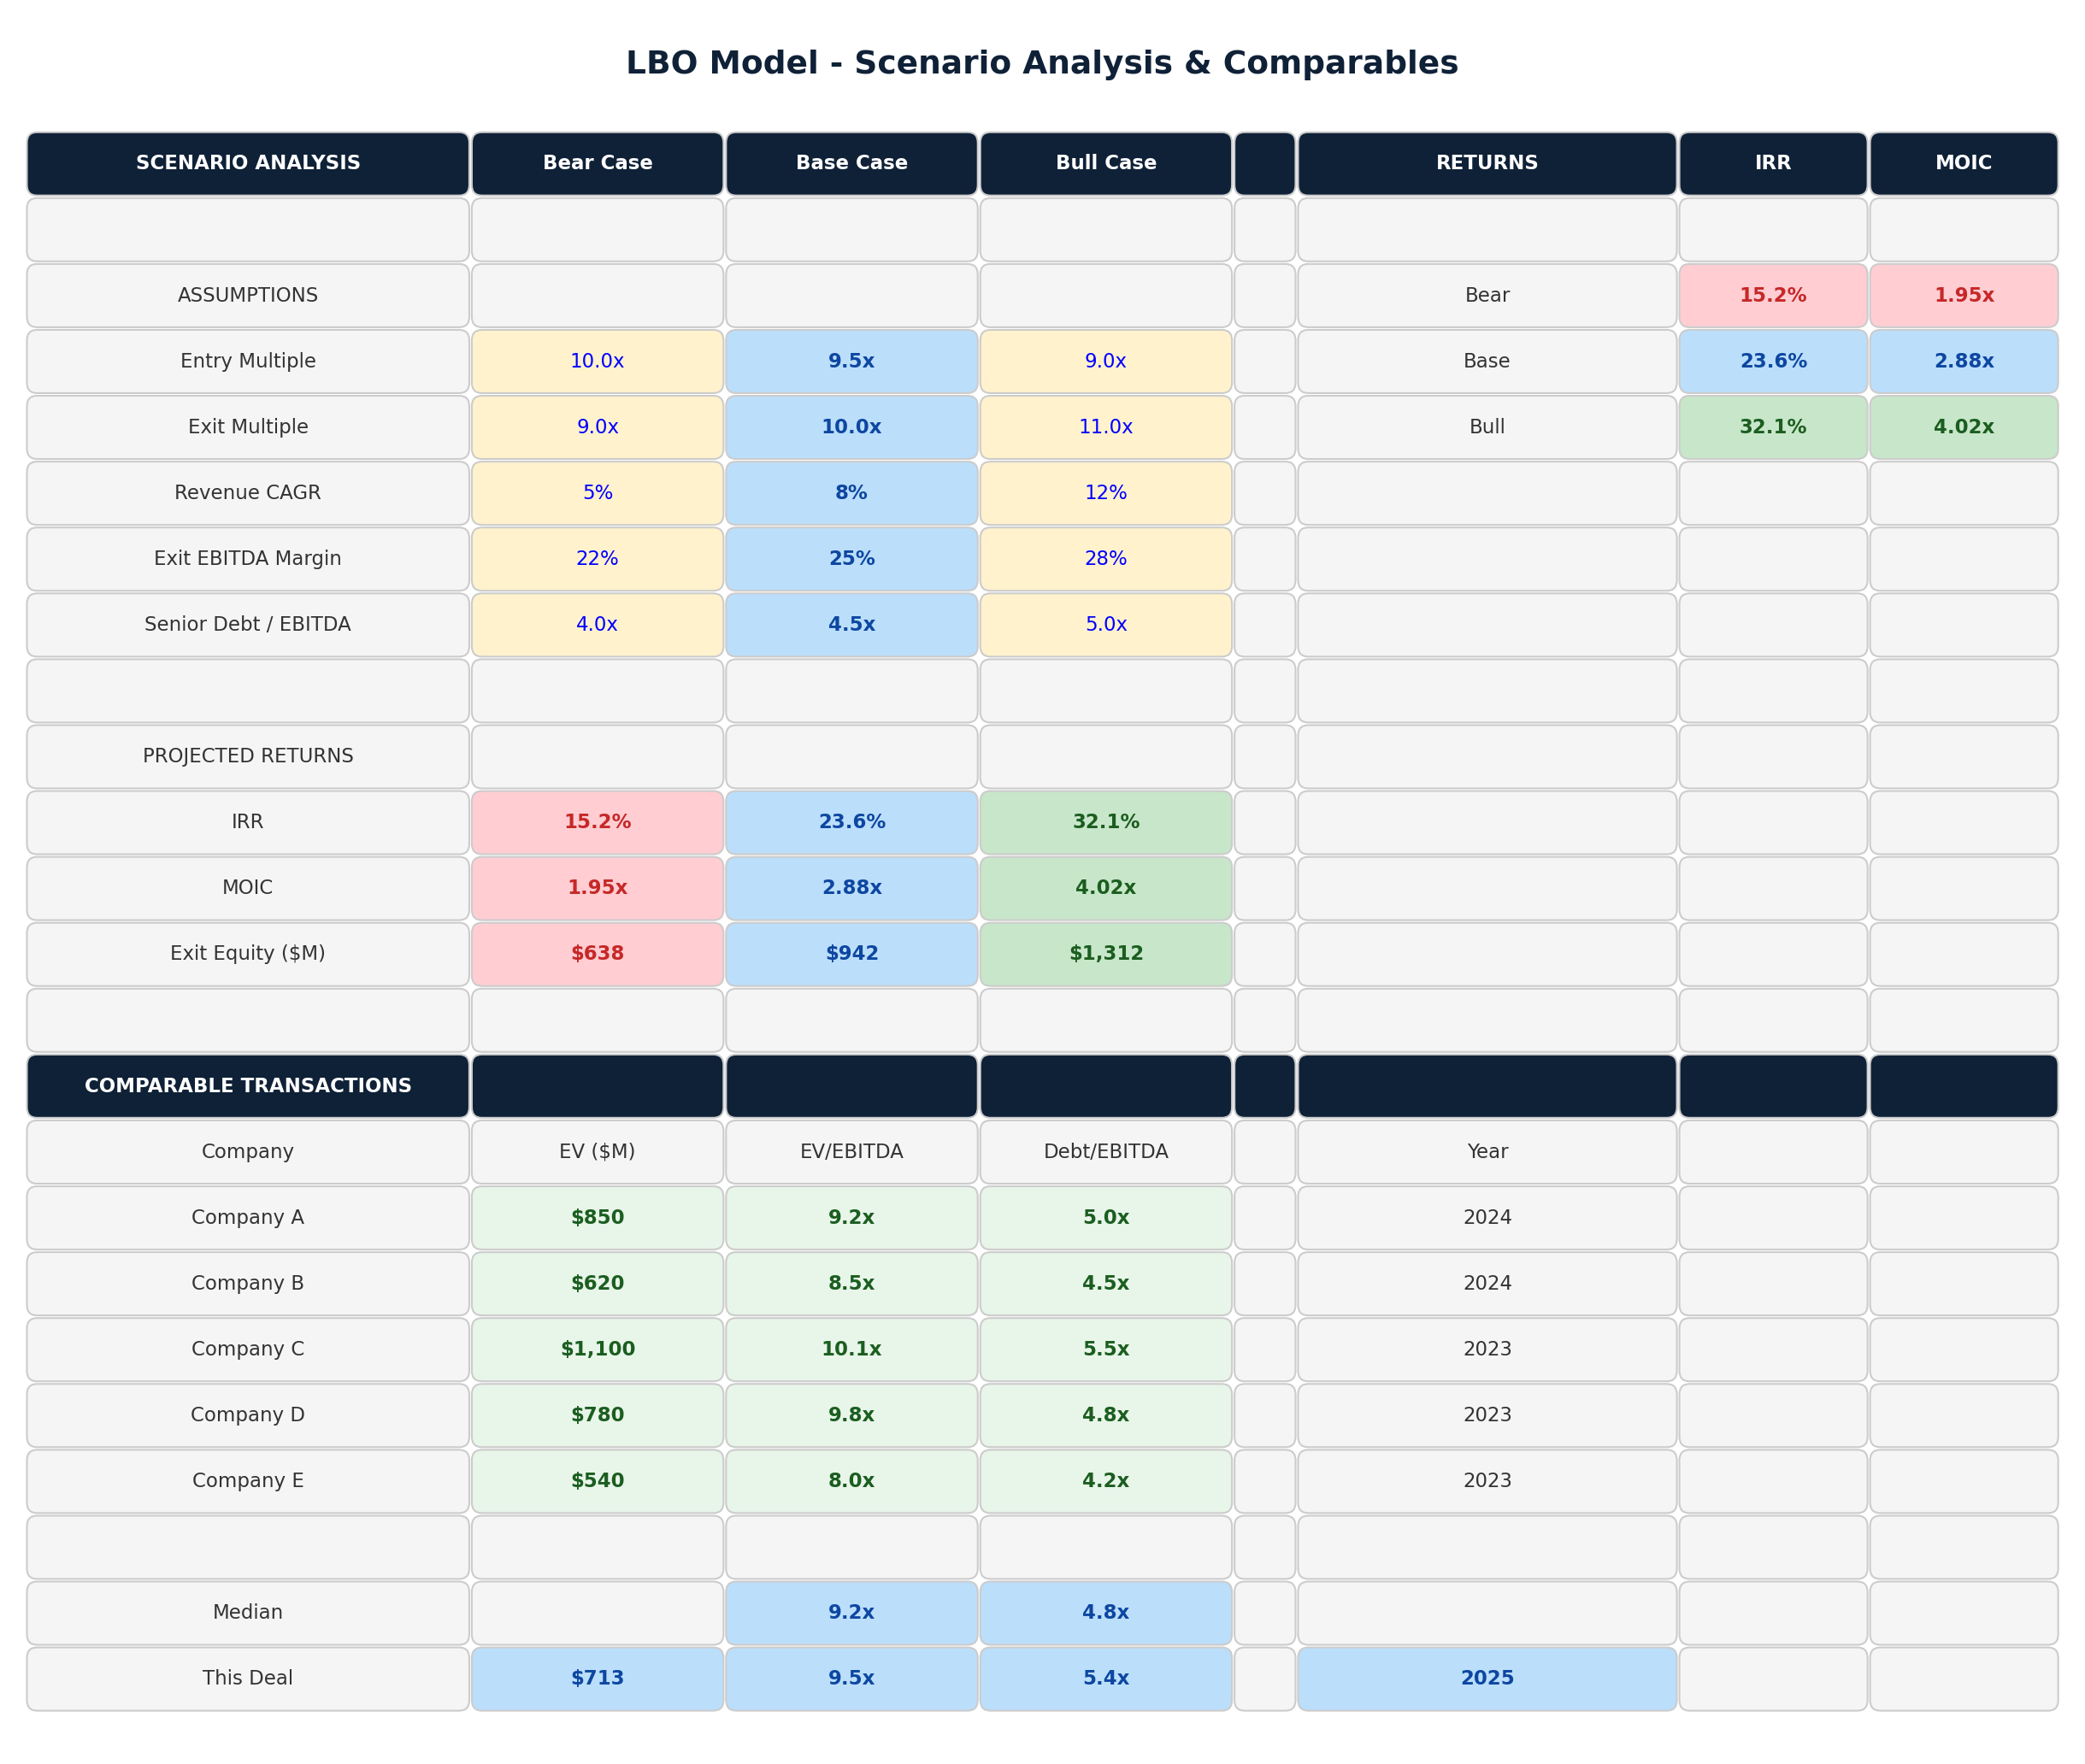
The Assumptions tab carries four periods of historical financials with computed CAGRs, next to an industry benchmark strip showing 25th percentile, median and 75th percentile for entry multiple, leverage, senior rate, EBITDA margin and revenue growth, with your deal positioned against each. The Scenarios tab holds a Bear / Base / Bull comparison and a comparable-transactions table. Both are reference tables populated with illustrative values for you to overwrite with your own deal - they are not live-linked to the model, and this is stated so you know exactly what you are getting.

Conventions
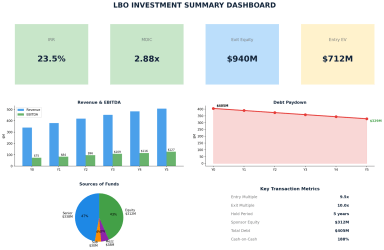
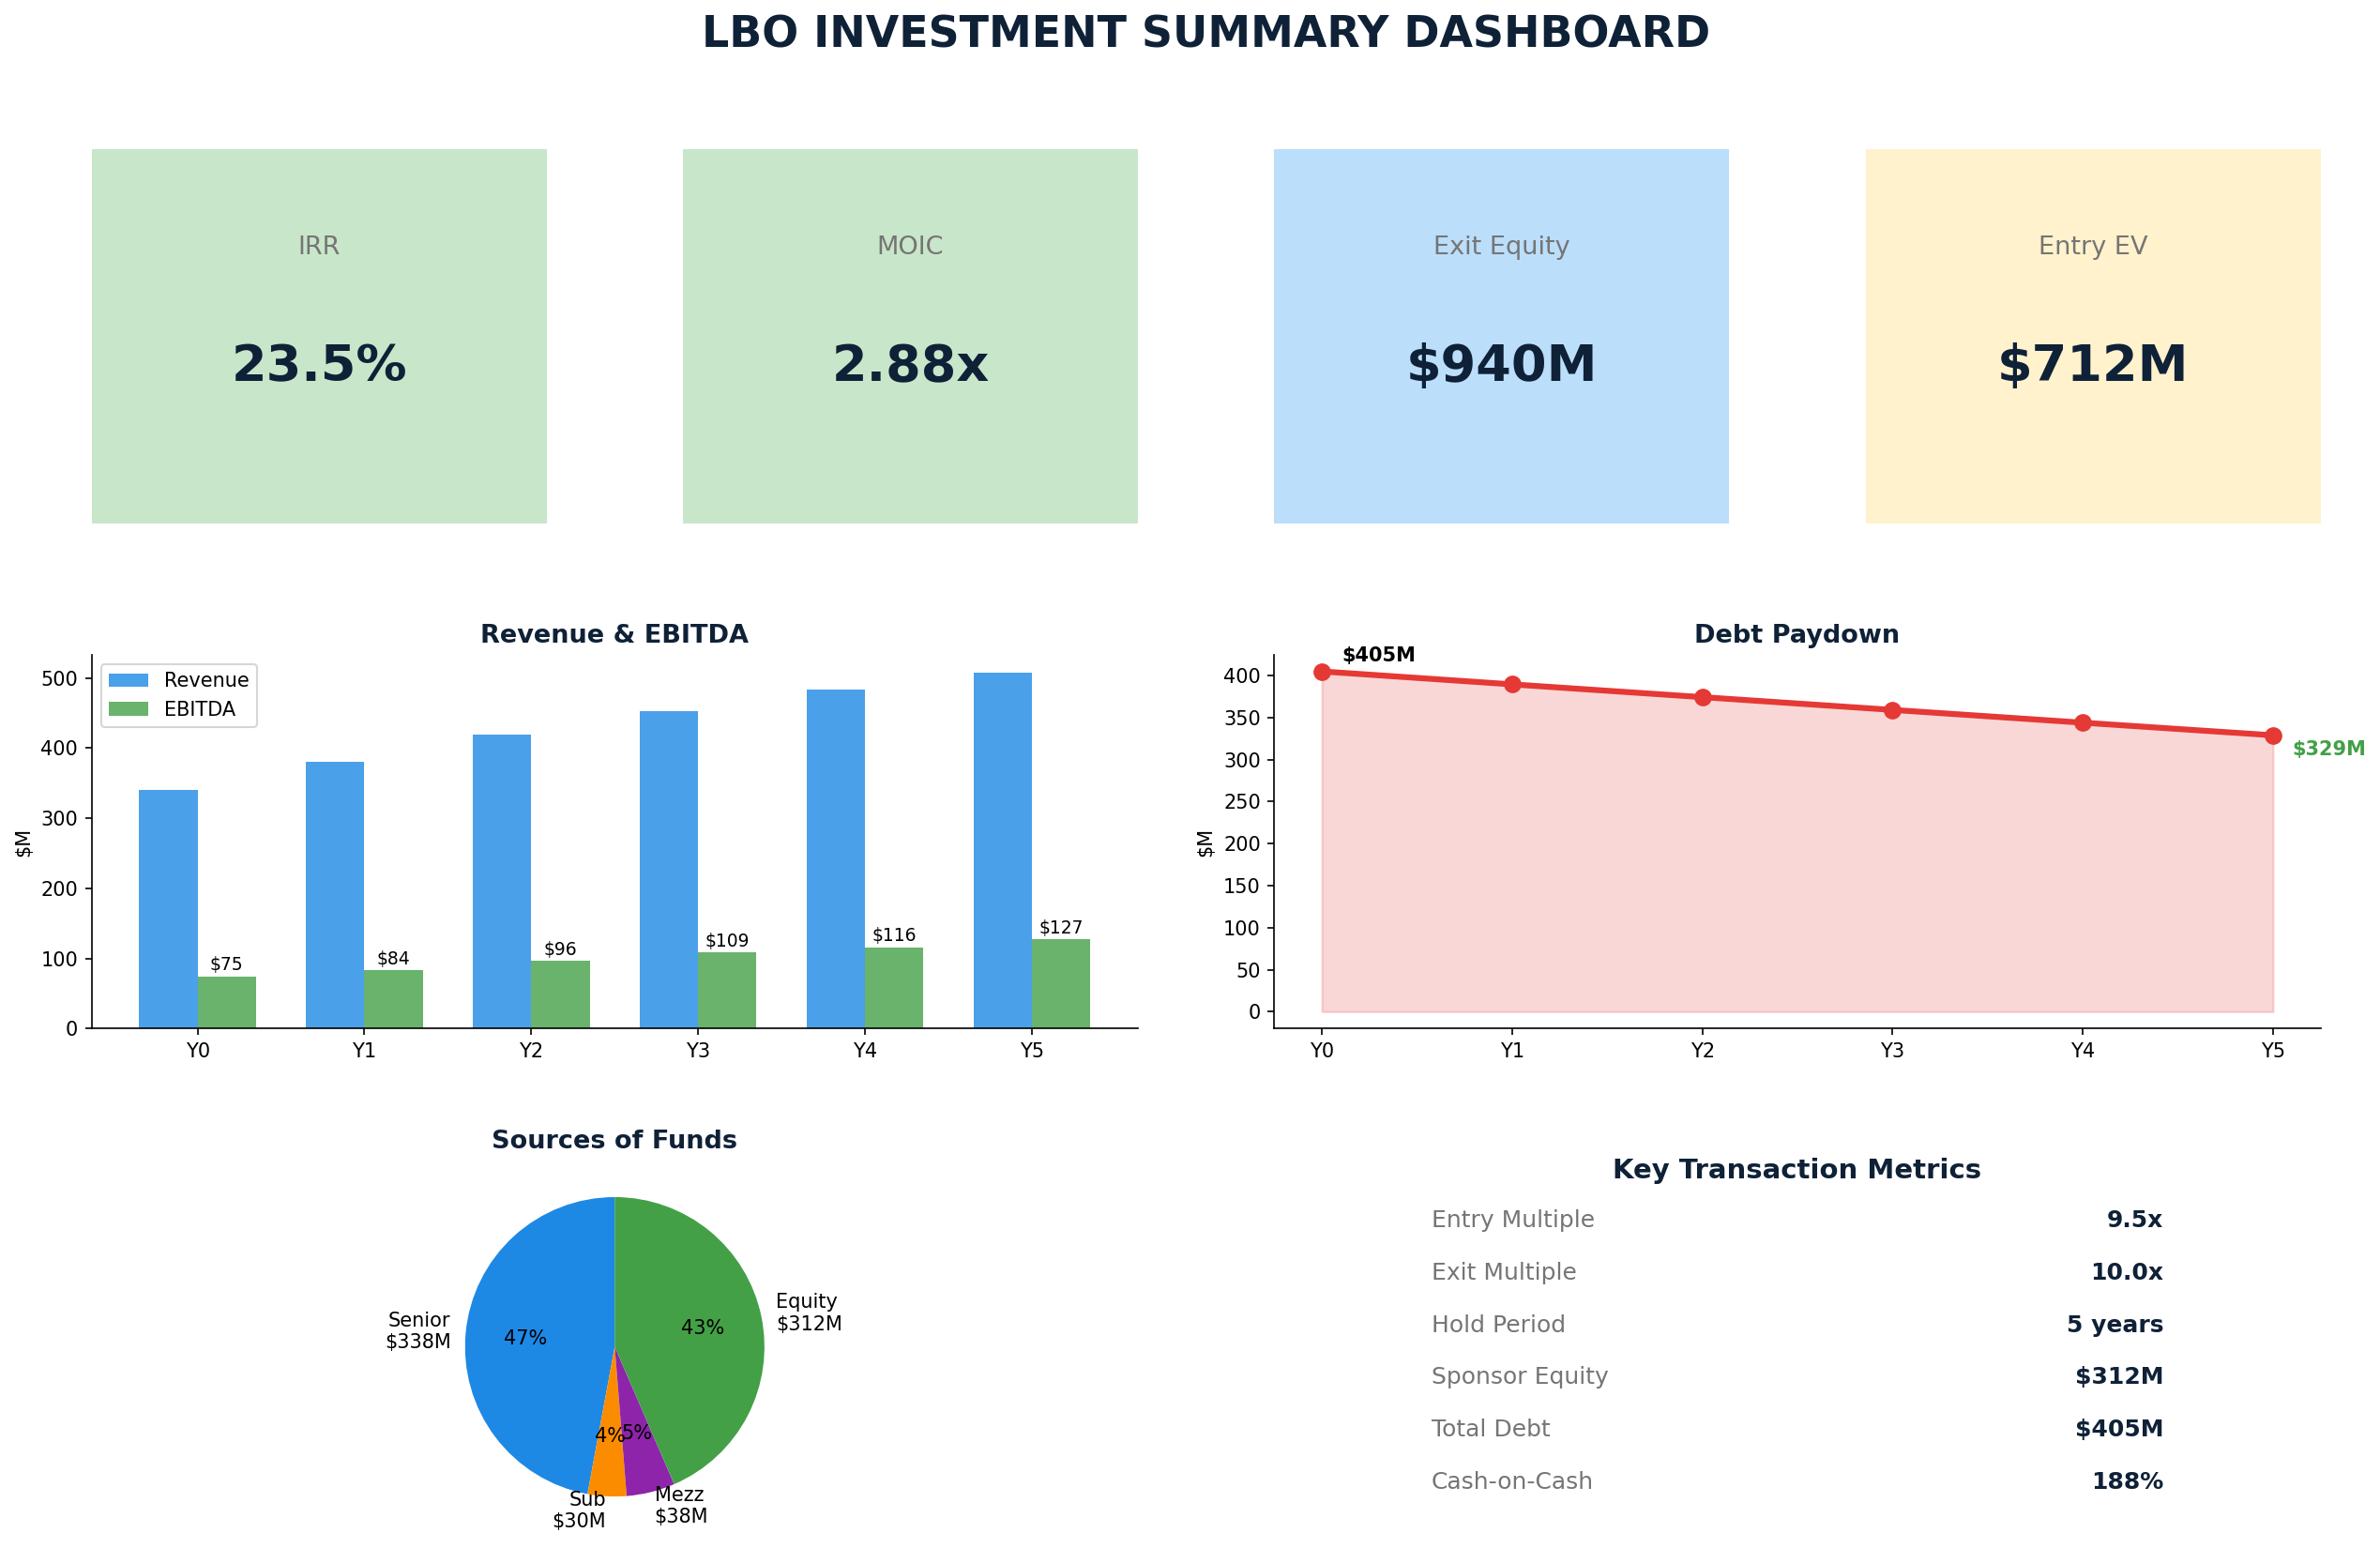
Consistent colour coding throughout: blue text on yellow fill marks the input cells you edit, black marks formulas, green marks cross-sheet links, green fill marks key outputs. Sample deal data is pre-filled so every tab is populated the moment you open the file, and the Dashboard renders six charts summarising the transaction, the deleveraging path and the return profile.

Delivery
Instant download of the Excel workbook plus a README covering quick start, a tab-by-tab guide, the colour code and compatibility notes. Designed and tested for Microsoft Excel on Windows and Mac.

This Best Practice includes
1 Excel workbook (.xlsx, 12 tabs, 404 live formulas, 7 charts) + 1 README guide (tab-by-tab walkthrough, quick start, colour code, compatibility notes).

Acquire business license for $79.00

Add to cart

Add to bookmarks

Discuss

Further information

Underwrite a leveraged buyout end to end in Excel: size the capital structure, balance sources against uses, amortise three debt tranches over a five-year hold, test the credit covenants year by year, and decompose the sponsor return into EBITDA growth, multiple expansion and debt paydown.

You are underwriting or teaching a leveraged buyout and need the debt side modelled properly, not simplified to a single term loan. You need to show a credit committee or a lender that leverage and coverage covenants hold in every year of the hold period. You want the return attributed to its three sources rather than reported as a single IRR. You want a paper-LBO structure you can populate with your own deal in an afternoon. You work in Excel and cannot use macros or add-ins.

You need a full three-statement build with a balance sheet and a cash flow statement: this model projects revenue, EBITDA and free cash flow, not the complete financial statements. You need a revolver with a cash sweep waterfall, multiple closing dates, an equity-rollover waterfall with preferred tiers, or a dividend recapitalisation. You need a DCF valuation rather than a buyout return. The scenario comparison and comparable-transactions tabs are reference tables with illustrative values you overwrite with your own, not live-linked calculations.


0.0 / 5 (0 votes)

please wait...