Publication number: ELQ-87009-1
View all versions & Certificate

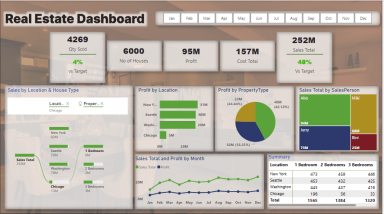
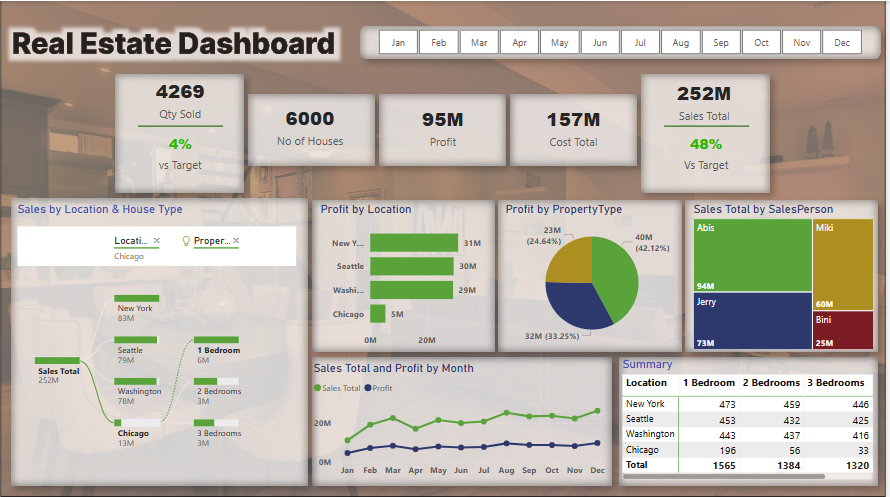
Real Estate Power BI Dashboard
The Real Estate Dashboard provides a comprehensive overview of key metrics in the real estate sector, including quantity sold, profit, and sales performance
Further information
- Track Performance: Provide a real-time overview of key sales metrics, including the number of houses sold, profit, and cost totals.
- Analyze Trends: Enable users to monitor sales and profit trends over time by location, house type, and sales personnel.
- Compare to Targets: Allow easy comparison of actual sales performance against targets to track progress.
- Make Data-Driven Decisions: Support managers in making informed decisions regarding resource allocation, sales focus, and investment based on location and property type performance.
- Salesperson Performance: Monitor individual salesperson performance to optimize team management and incentivize productivity.
This Real Estate Dashboard Template applies best under the following conditions:
1. Real Estate Agencies and Sales Teams
2. Monthly or Periodic Reporting
3. Profitability Analysis for Property Investment
4. Data-Driven Decision-Making
5. Real Estate Market Analysis
This Real Estate Dashboard Template may not apply ideally under the following conditions:
1. Non-Real Estate Businesses
2. Detailed Financial Analysis
3. Single-Property or Low-Volume Sales Operations
4. Long-Term Projections or Forecasting
5. Customization Beyond Standard Parameters
6. Real-Time Data Integration
