
Originally published: 16/08/2024 11:30
Publication number: ELQ-11840-1
View all versions & Certificate
Publication number: ELQ-11840-1
View all versions & Certificate

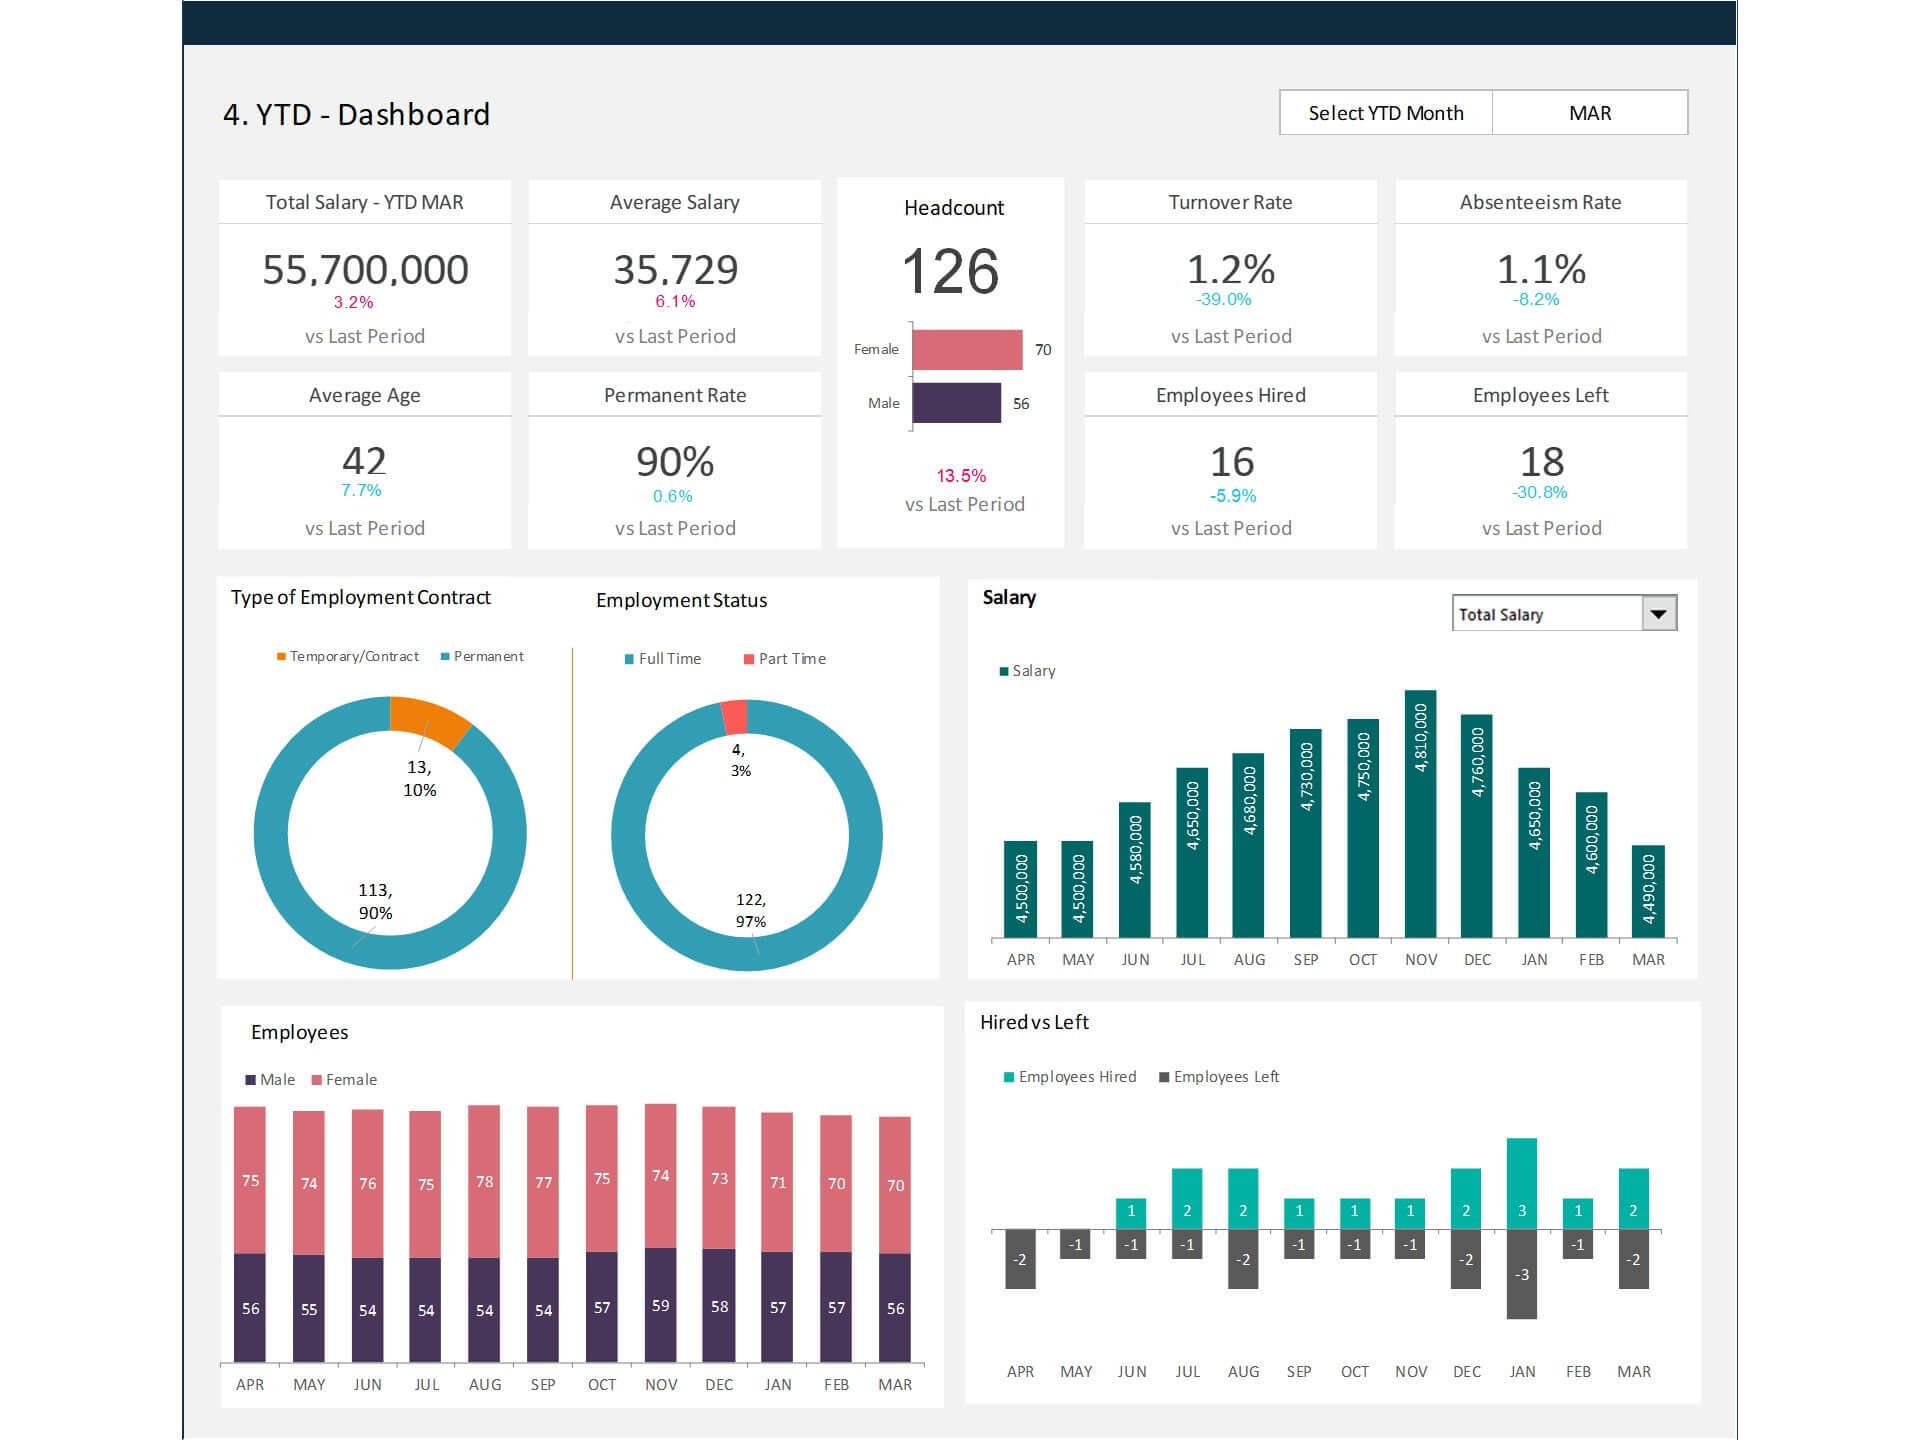
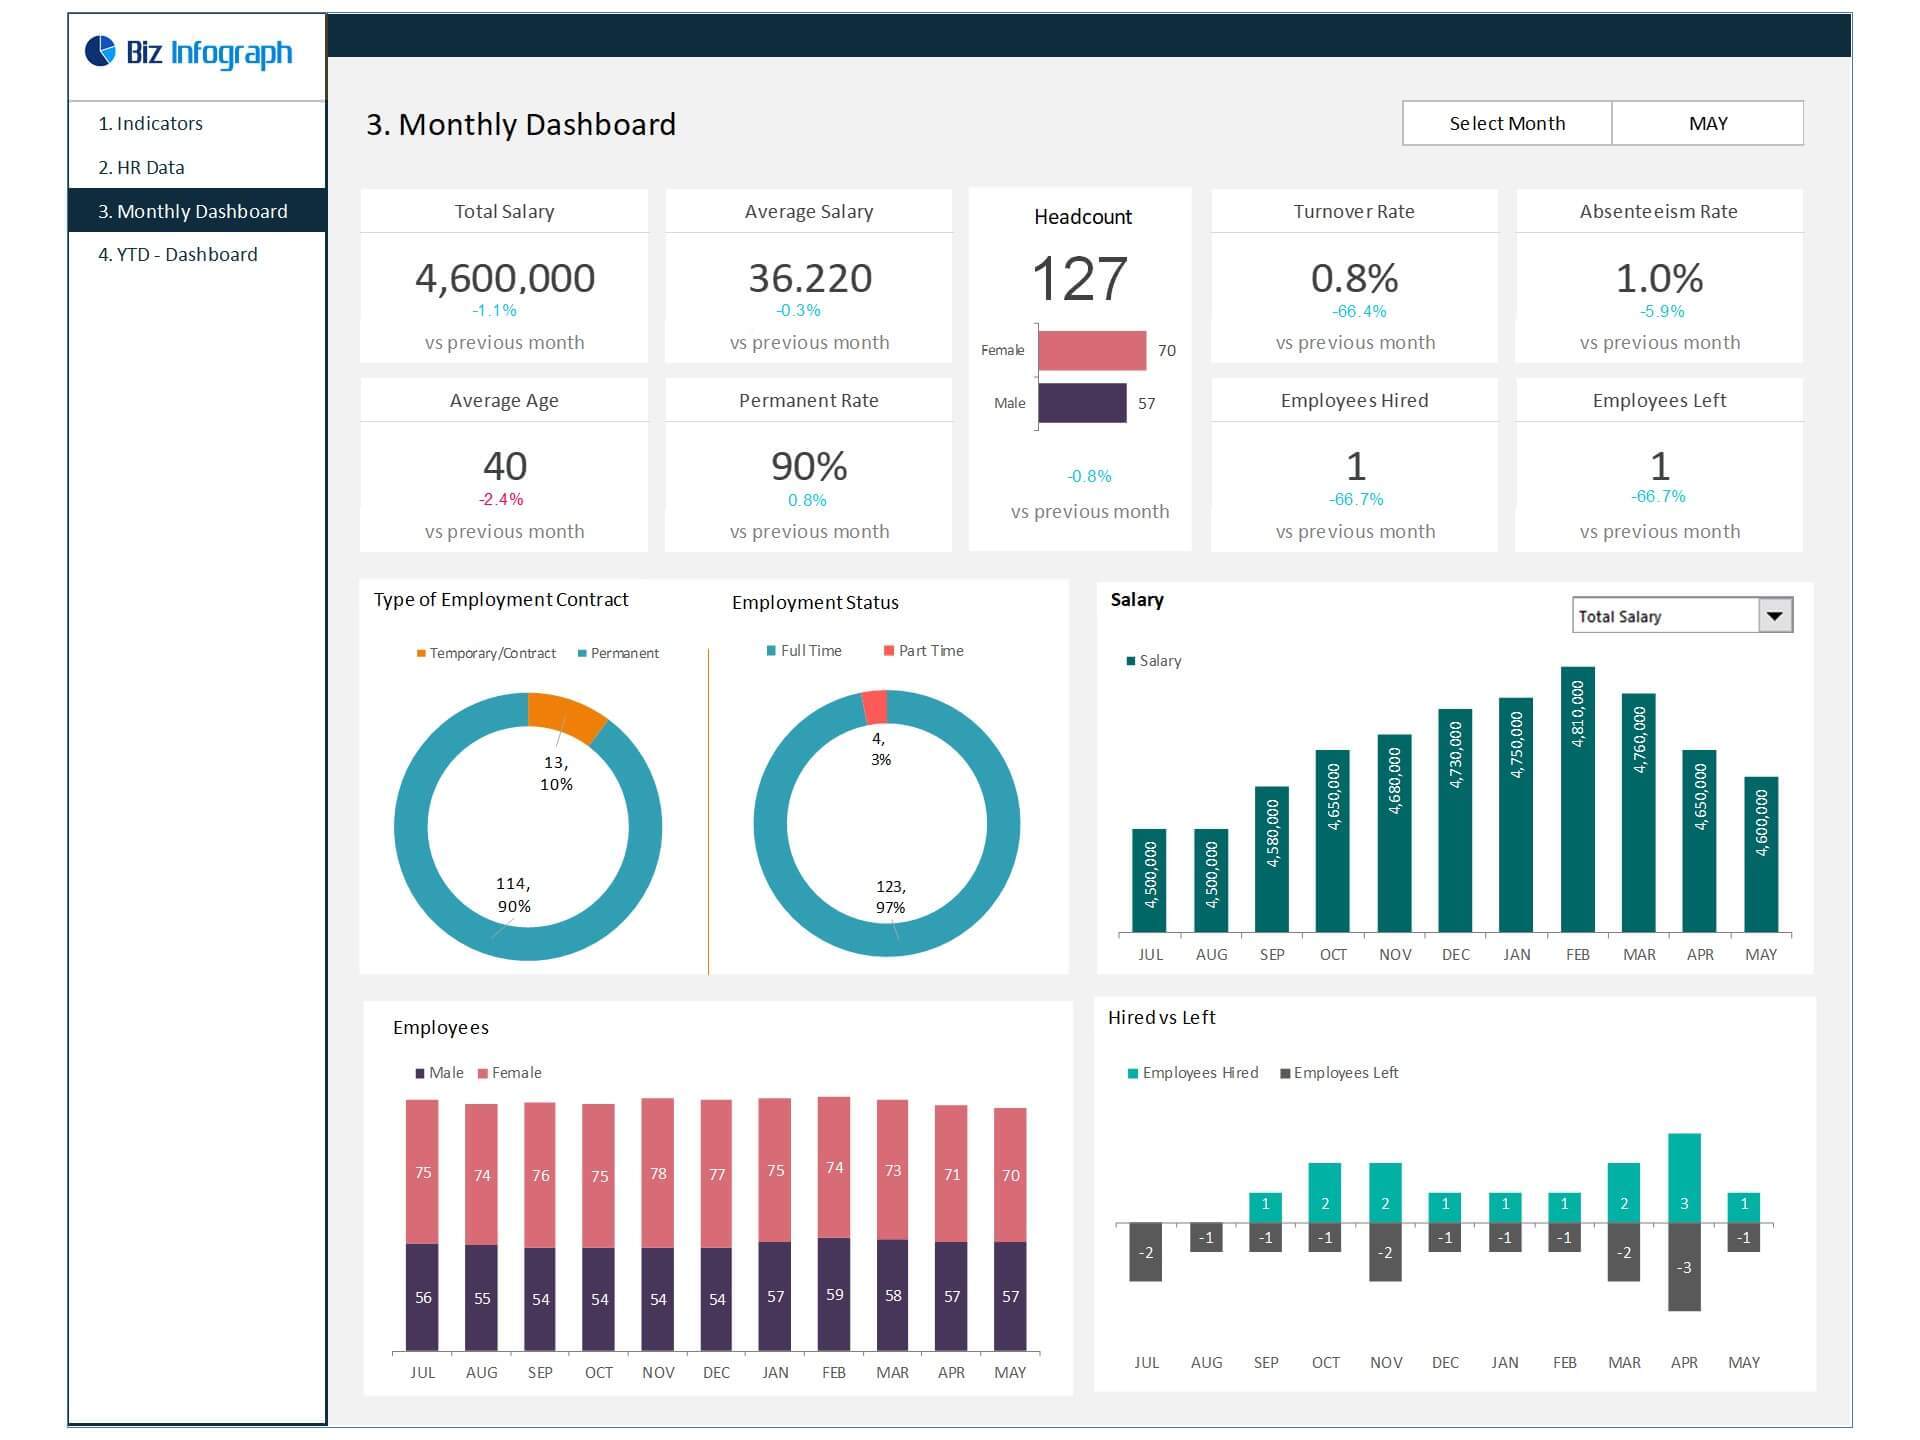
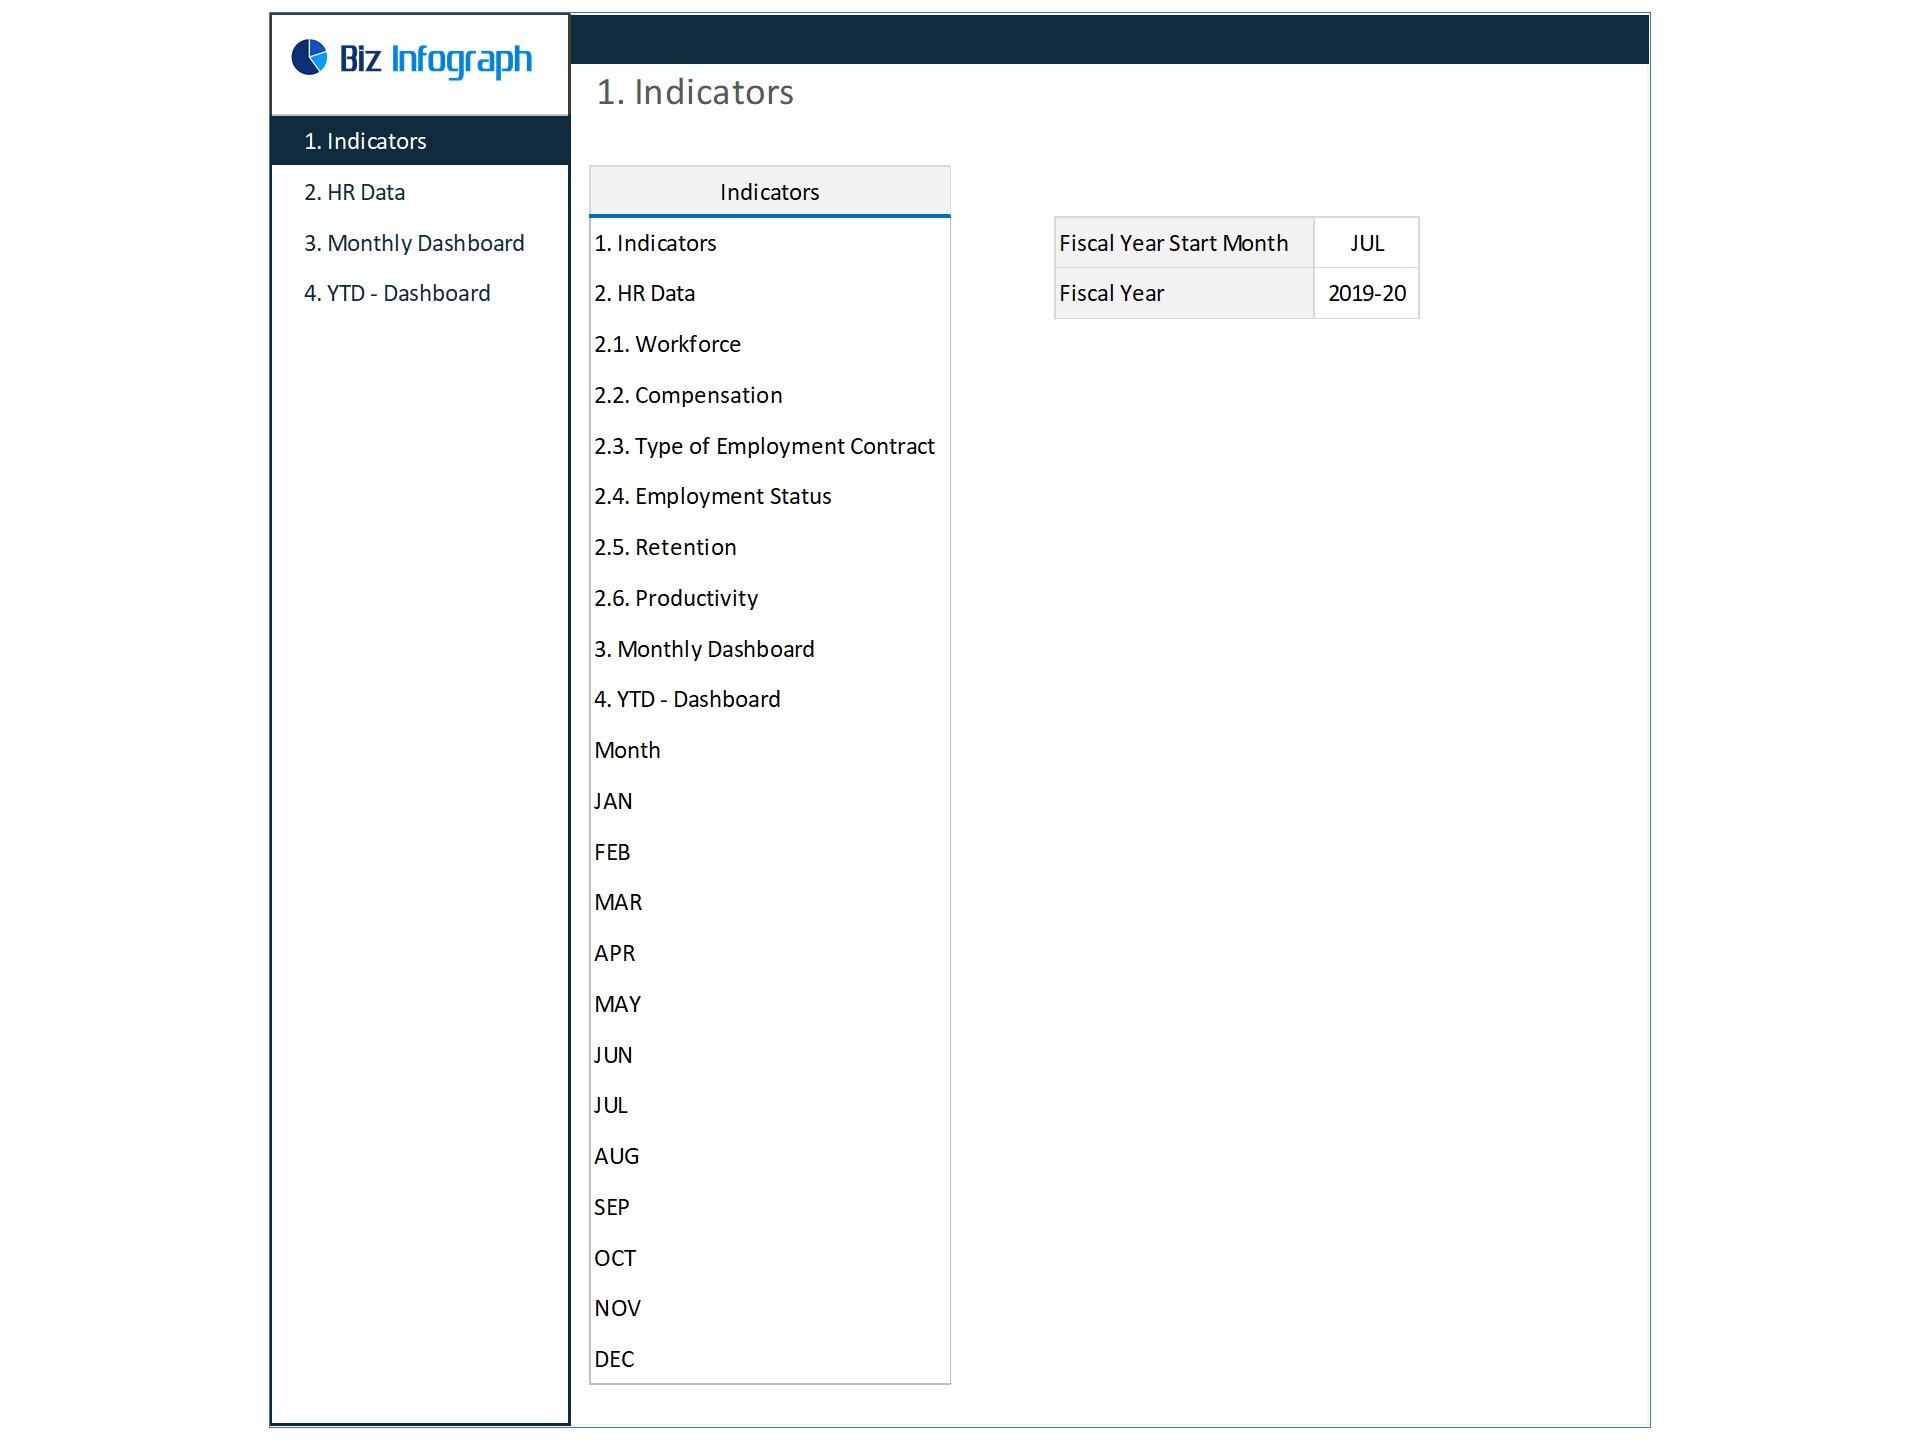
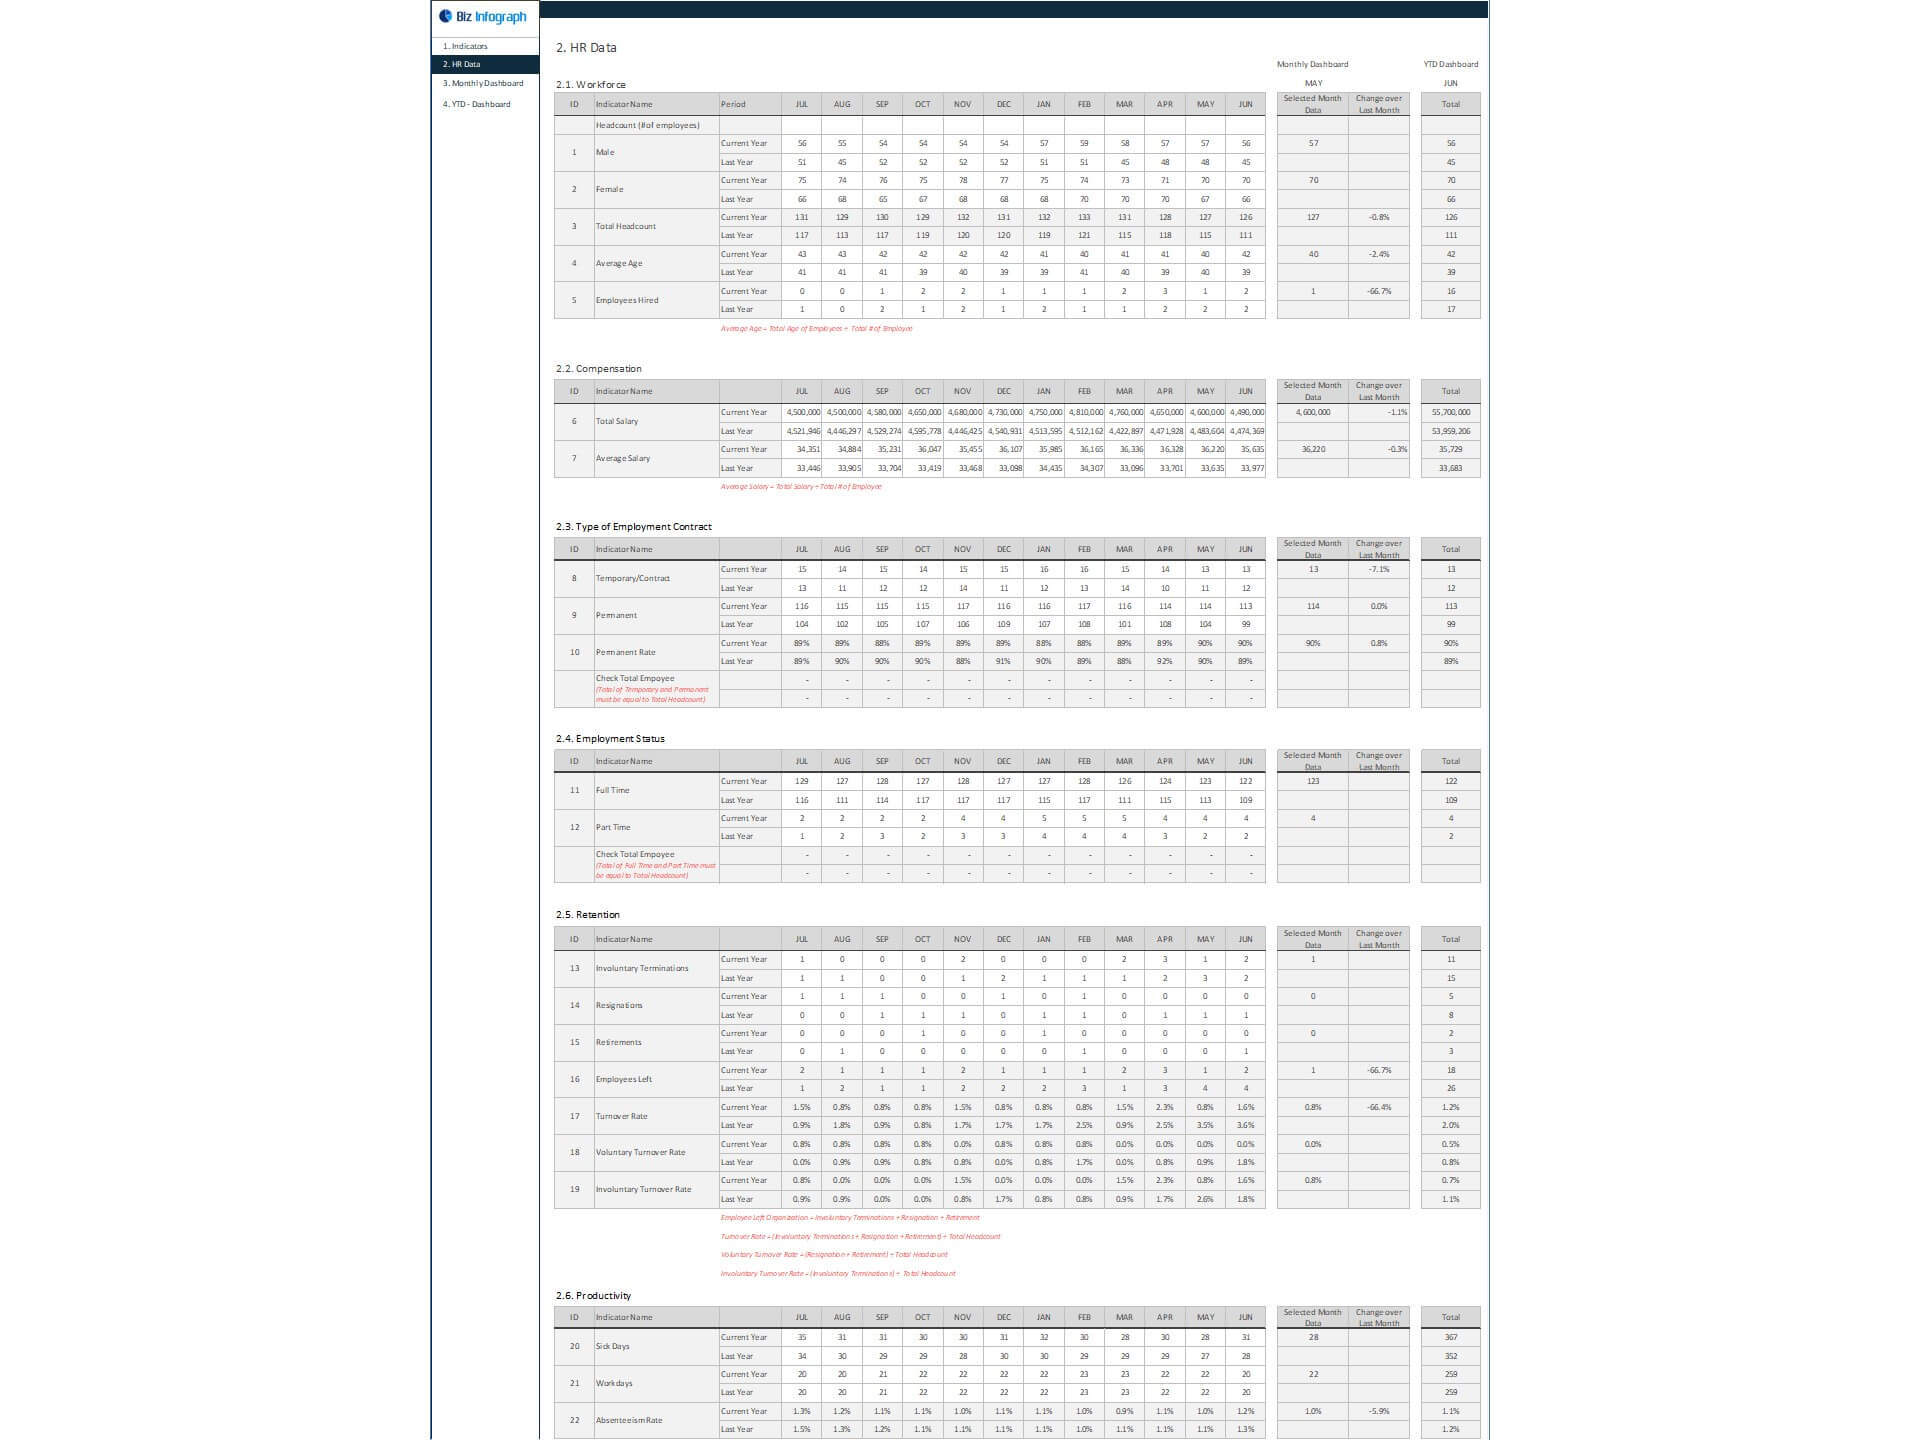
HR Metrics Dashboard - HR Dashboard
HR Dashboard Excel Template for tracking HR performance indicators and quickly analyzing business situations.

Biz Infograph is bringing clients a range of high-quality, well-designed, and easy-to-use professionally designed slides and dashboards.Follow
hr dashboardhr metrics dashboardhr google sheetshr google sheets dashboardhr templateshr excel dashboardhr excel dashboard templatehuman resource dashboardgoogle sheets dashboard
Description
HR Dashboard Excel Template and Google Sheets
HR Metrics Dashboard Template is an Excel spreadsheet (HR Metrics Dashboard Google Sheets) that is perfect for tracking the most common human resources performance indicators. This human resource dashboard template provides you and your team with a visual representation of your company's workforce and allows you to quickly analyze your business situation.
HR Dashboard Template Excel is a dynamic overview of the most important HR metrics in a single place. The HR Dashboard provides a comprehensive overview of the workforce, their performance, absence, and turnover.
Key Features
A brief guide to using the dashboard template:
HR Dashboard Excel Template and Google Sheets
HR Metrics Dashboard Template is an Excel spreadsheet (HR Metrics Dashboard Google Sheets) that is perfect for tracking the most common human resources performance indicators. This human resource dashboard template provides you and your team with a visual representation of your company's workforce and allows you to quickly analyze your business situation.
HR Dashboard Template Excel is a dynamic overview of the most important HR metrics in a single place. The HR Dashboard provides a comprehensive overview of the workforce, their performance, absence, and turnover.
Key Features
- Monitor HR KPI progress monthly
- Provide actionable insights
- Consolidate all your HR metrics in one place
- Visualize overall HR department performance
- Fully editable, easy to use, template with sample data
A brief guide to using the dashboard template:
- Open the dashboard template
- Go to ‘Indicators’ menu – choose the start month of the fiscal year (i.e. Jan, Feb, Jul, etc.)
- Go to the ‘Enter Data’ menu – remove the sample data and give your actual data in the respective cells. Formula cells are locked, and you cannot edit it without a password.
- Go to the ‘Monthly Dashboard’ menu – select the month name from the drop-down to see the monthly picture of performance indicators
- Go to ‘YTD Dashboard’ menu - select month name from the drop-down to see the year-to-date picture of performance indicators
- Each page is ready for printing – just press CTRL+P
This Best Practice includes
1 Excel File, 1 Google Sheets file, 1 Word File