
Originally published: 08/11/2021 09:34
Last version published: 02/02/2022 11:21
Publication number: ELQ-44365-3
View all versions & Certificate
Last version published: 02/02/2022 11:21
Publication number: ELQ-44365-3
View all versions & Certificate

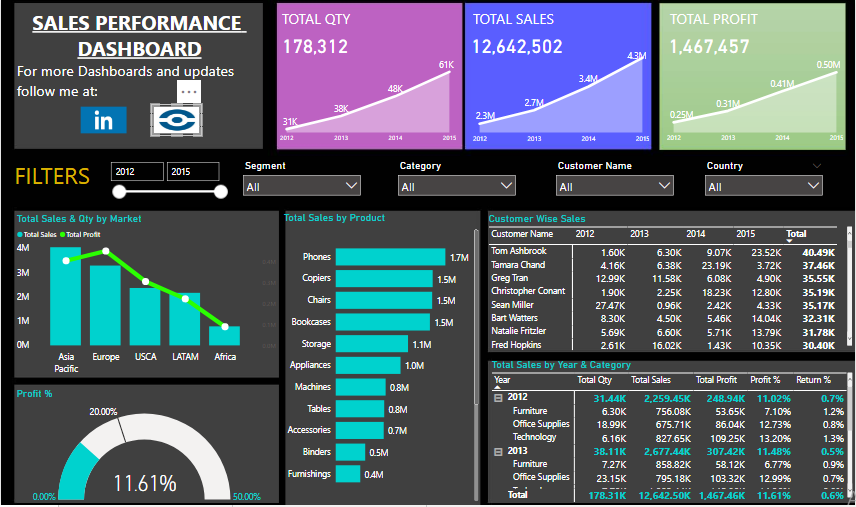
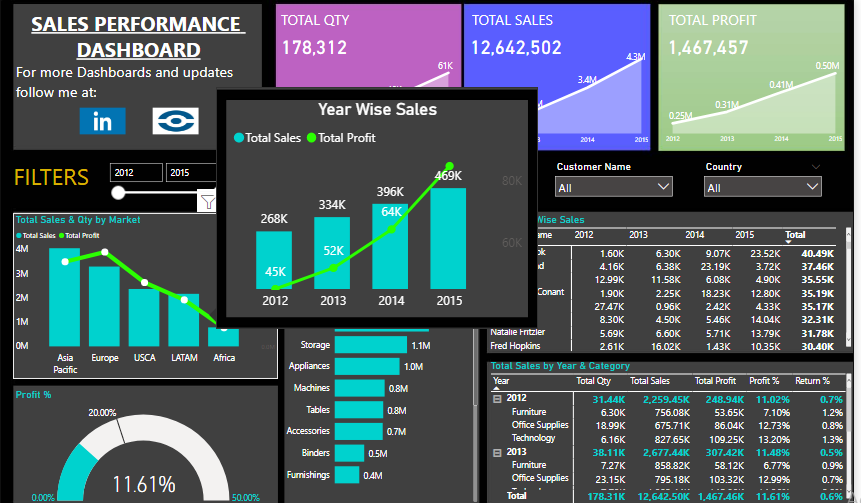
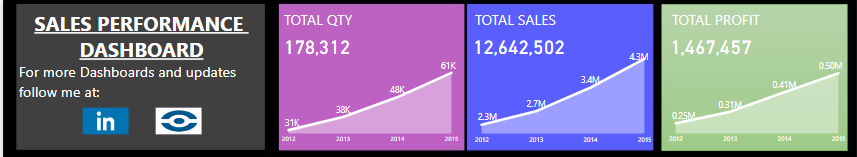
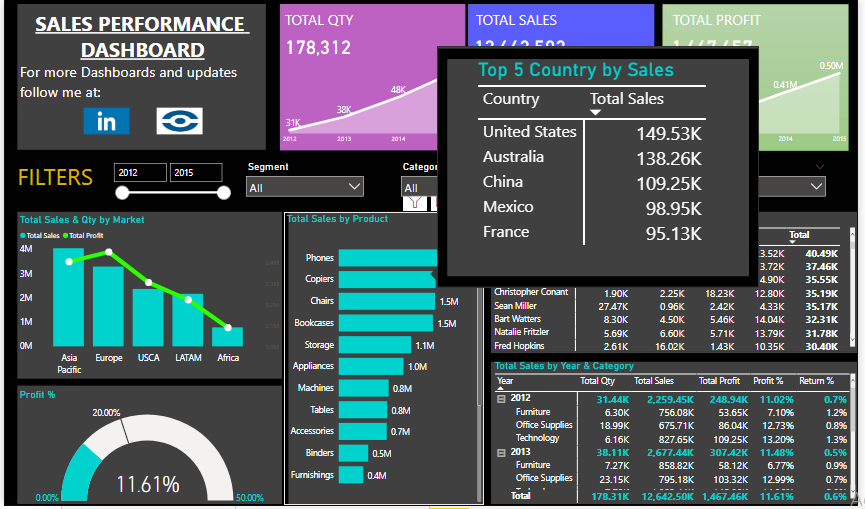
Sales Performance Dashboard in Power BI
Sales Performance Dashboard in Power BI. This dashboard Includes the main KPI's which would help in analyzing business potential.
