

Originally published: 10/01/2022 07:47
Last version published: 13/07/2023 08:08
Publication number: ELQ-50536-3
View all versions & Certificate
Last version published: 13/07/2023 08:08
Publication number: ELQ-50536-3
View all versions & Certificate

General Insurance Company Financial Projection 3 Statement Model
3 statement 5 year rolling financial projection Excel model for existing or startup general insurance company with earnings based on policy coverage period
Description
PURPOSE OF MODEL
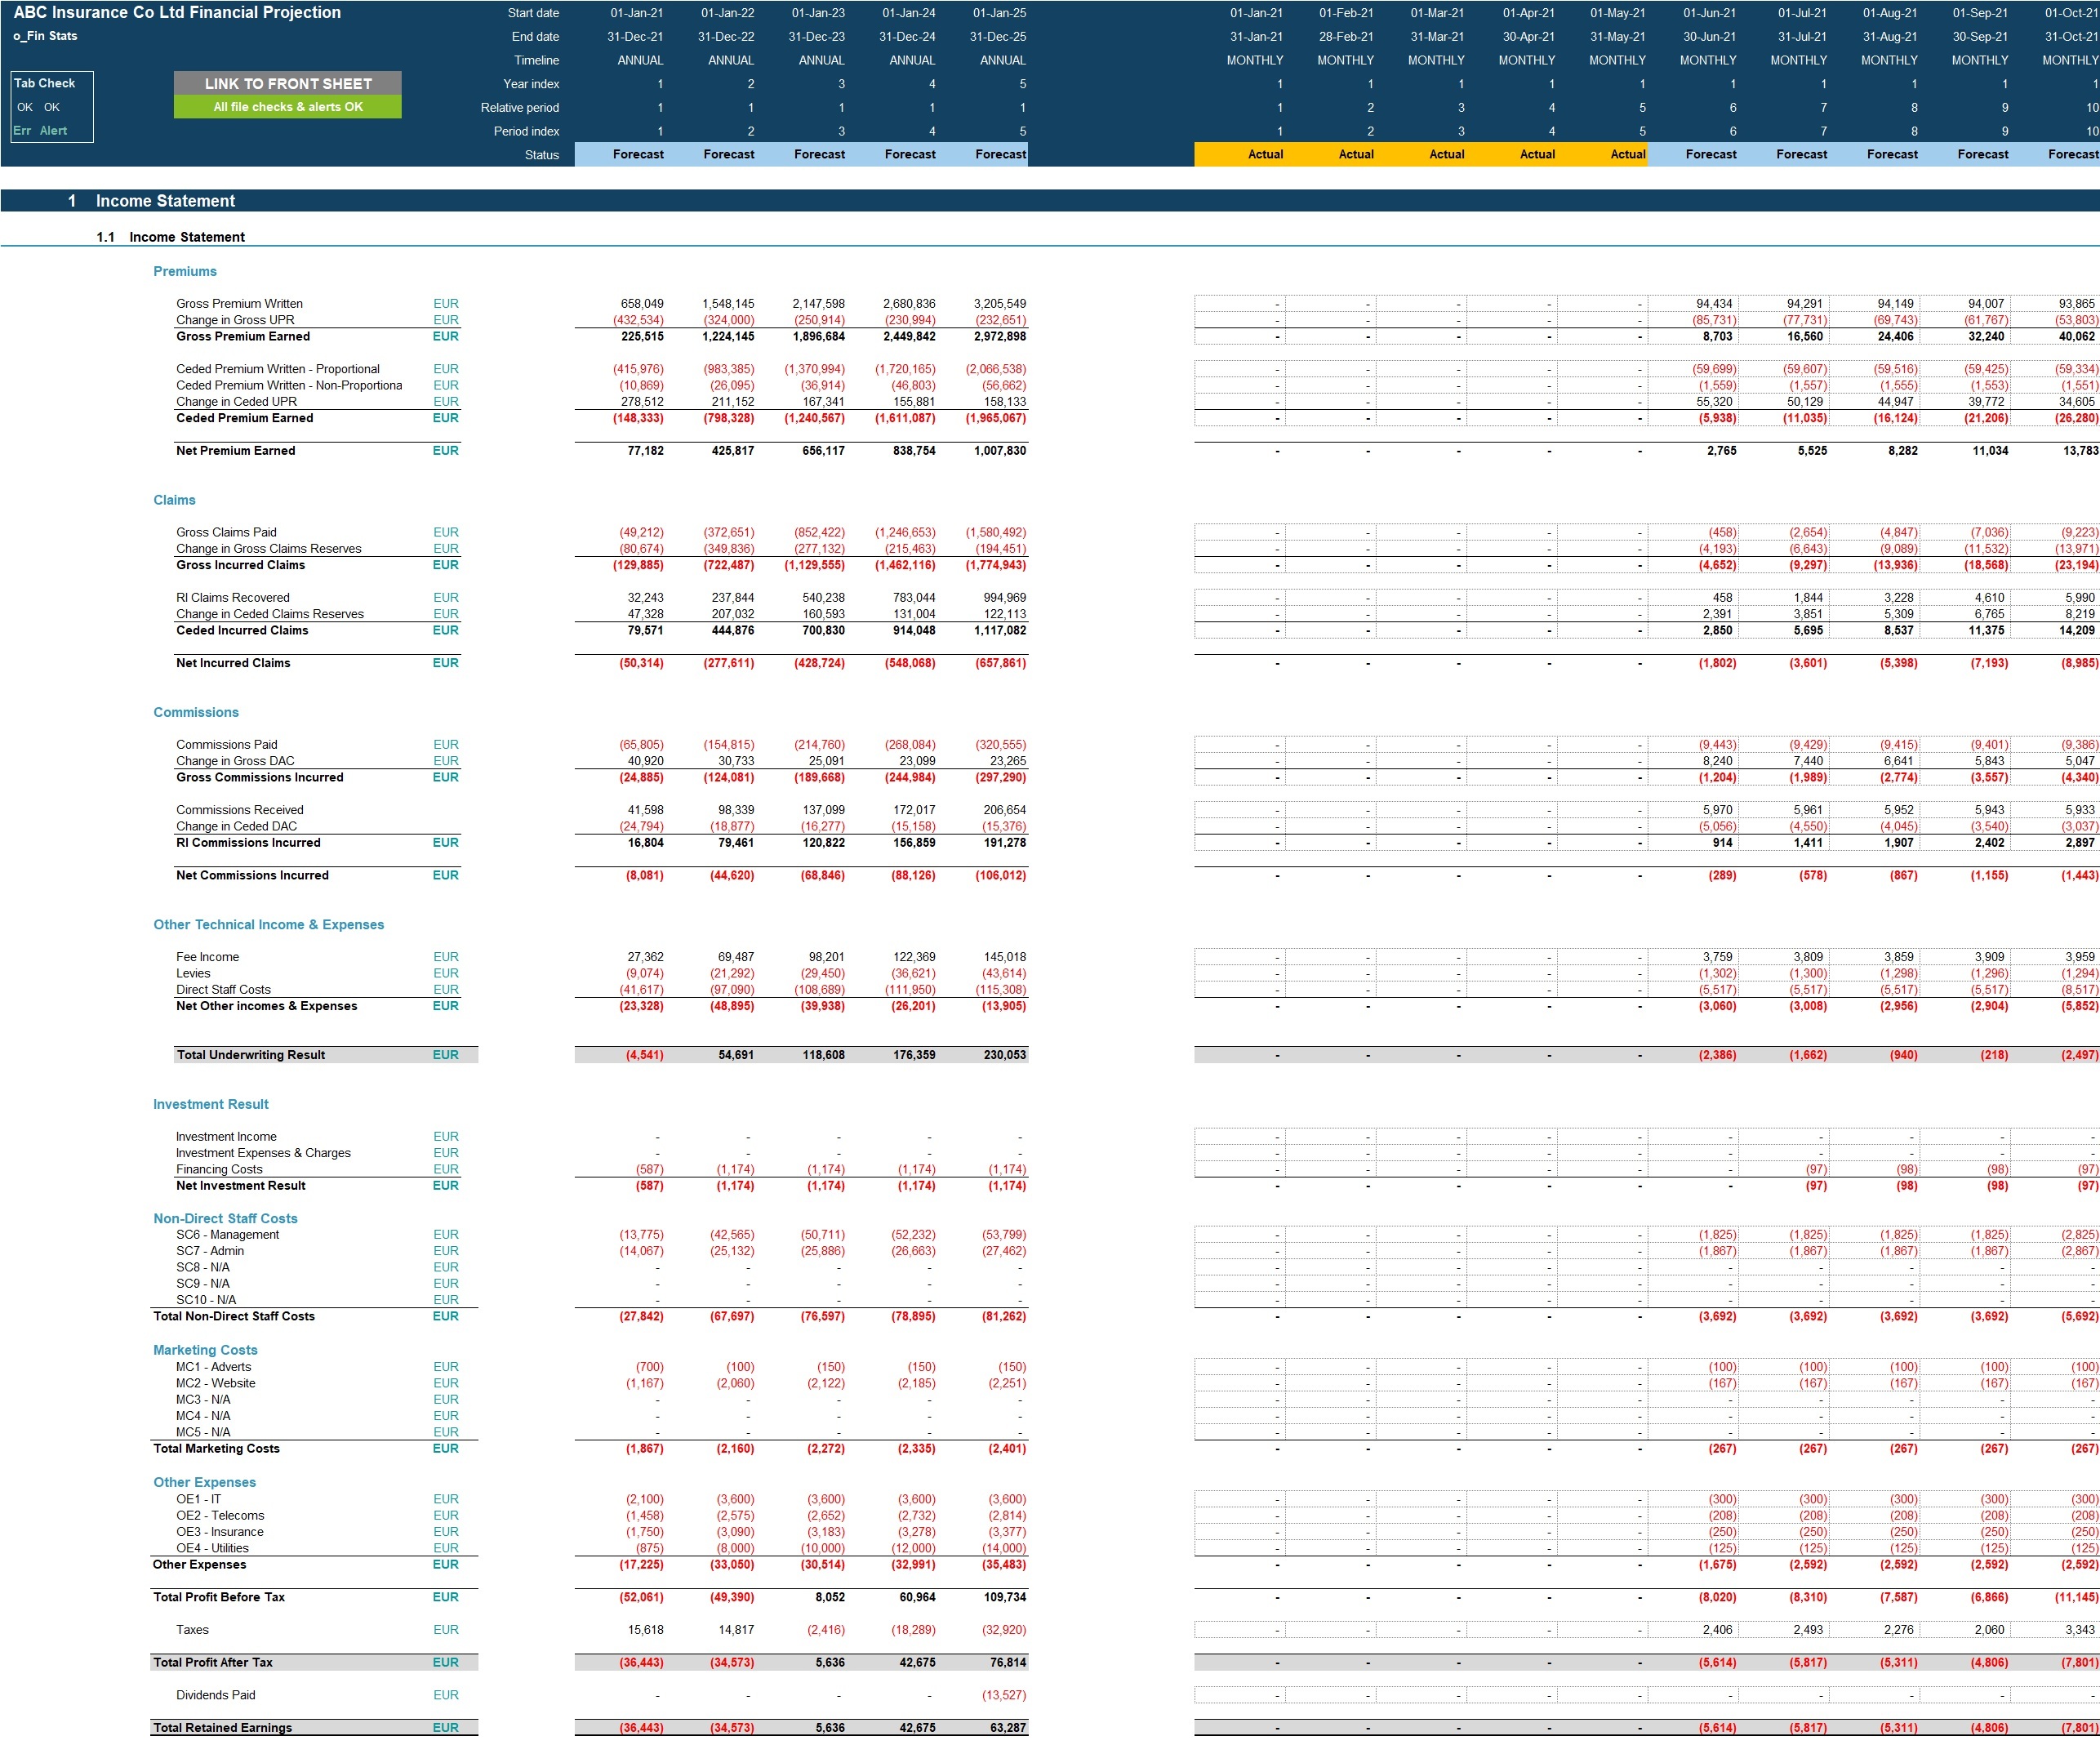
Highly versatile and user-friendly Excel model for the preparation a of 5-year rolling 3 statement (Income Statement, Balance Sheet and Cash flow Statement) financial projection with a monthly timeline for a startup or existing general (non-life) insurance business generating underwriting income and fee revenue from the underwriting of insurance policies.
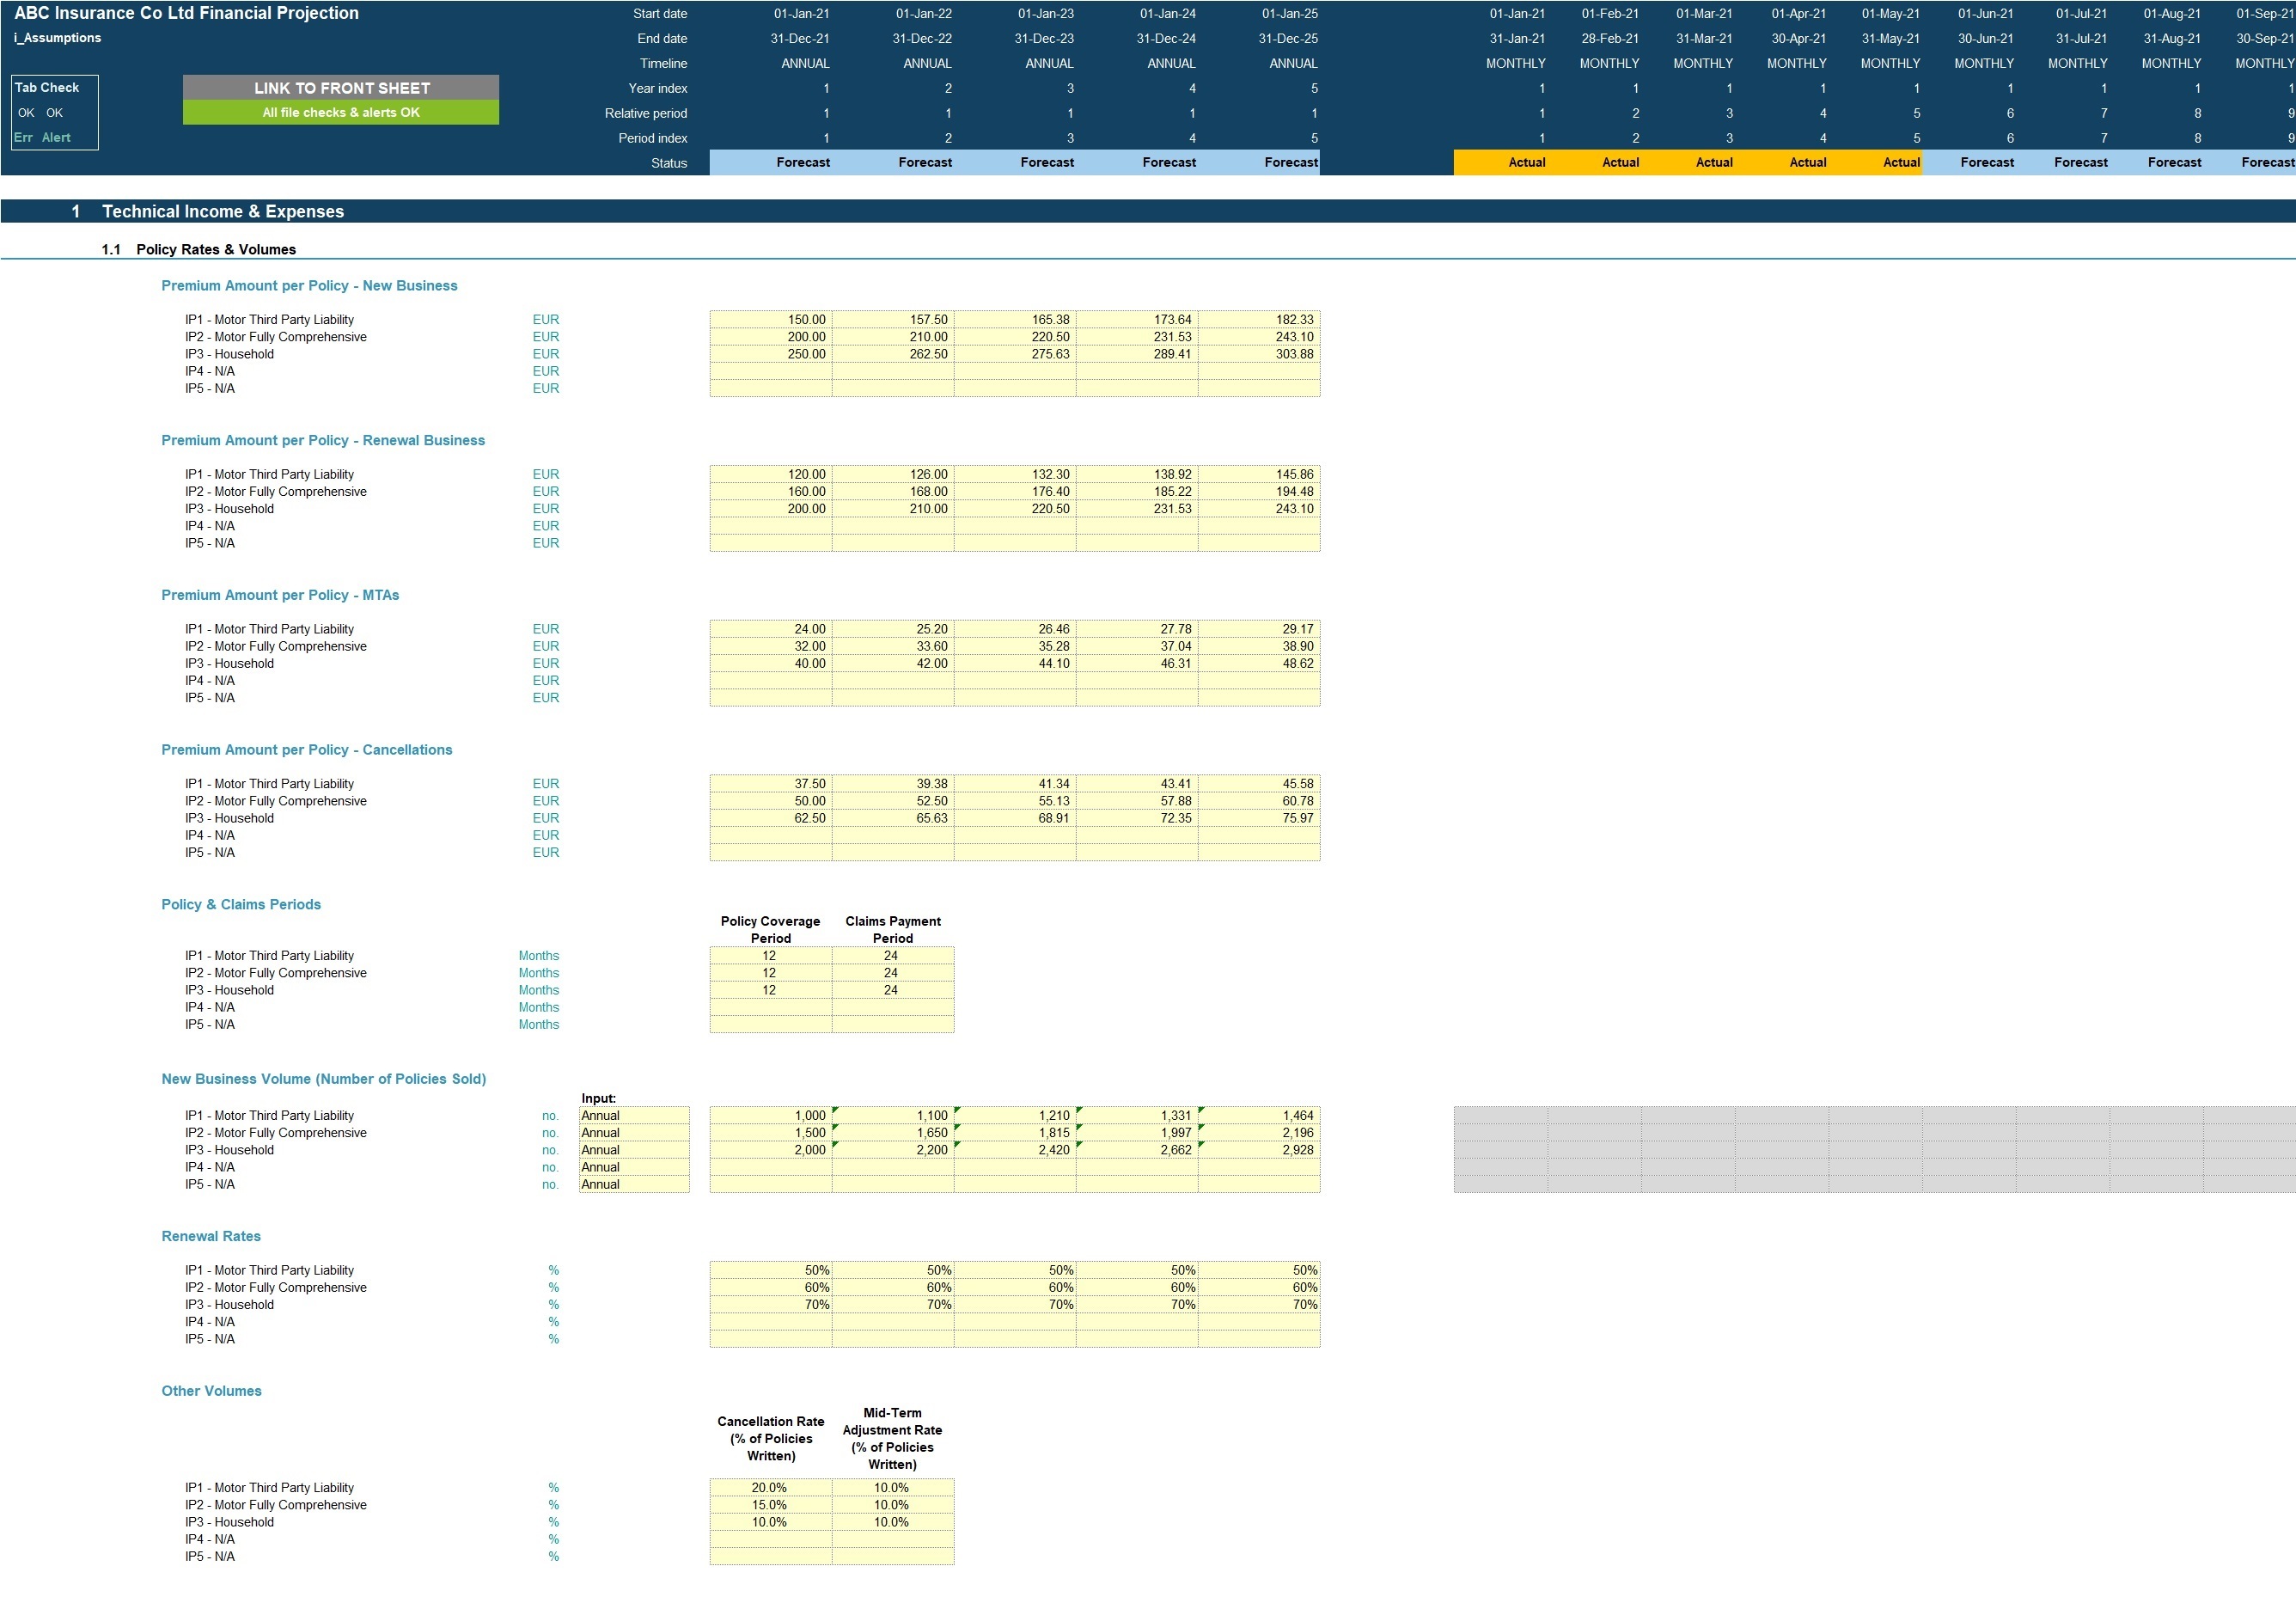
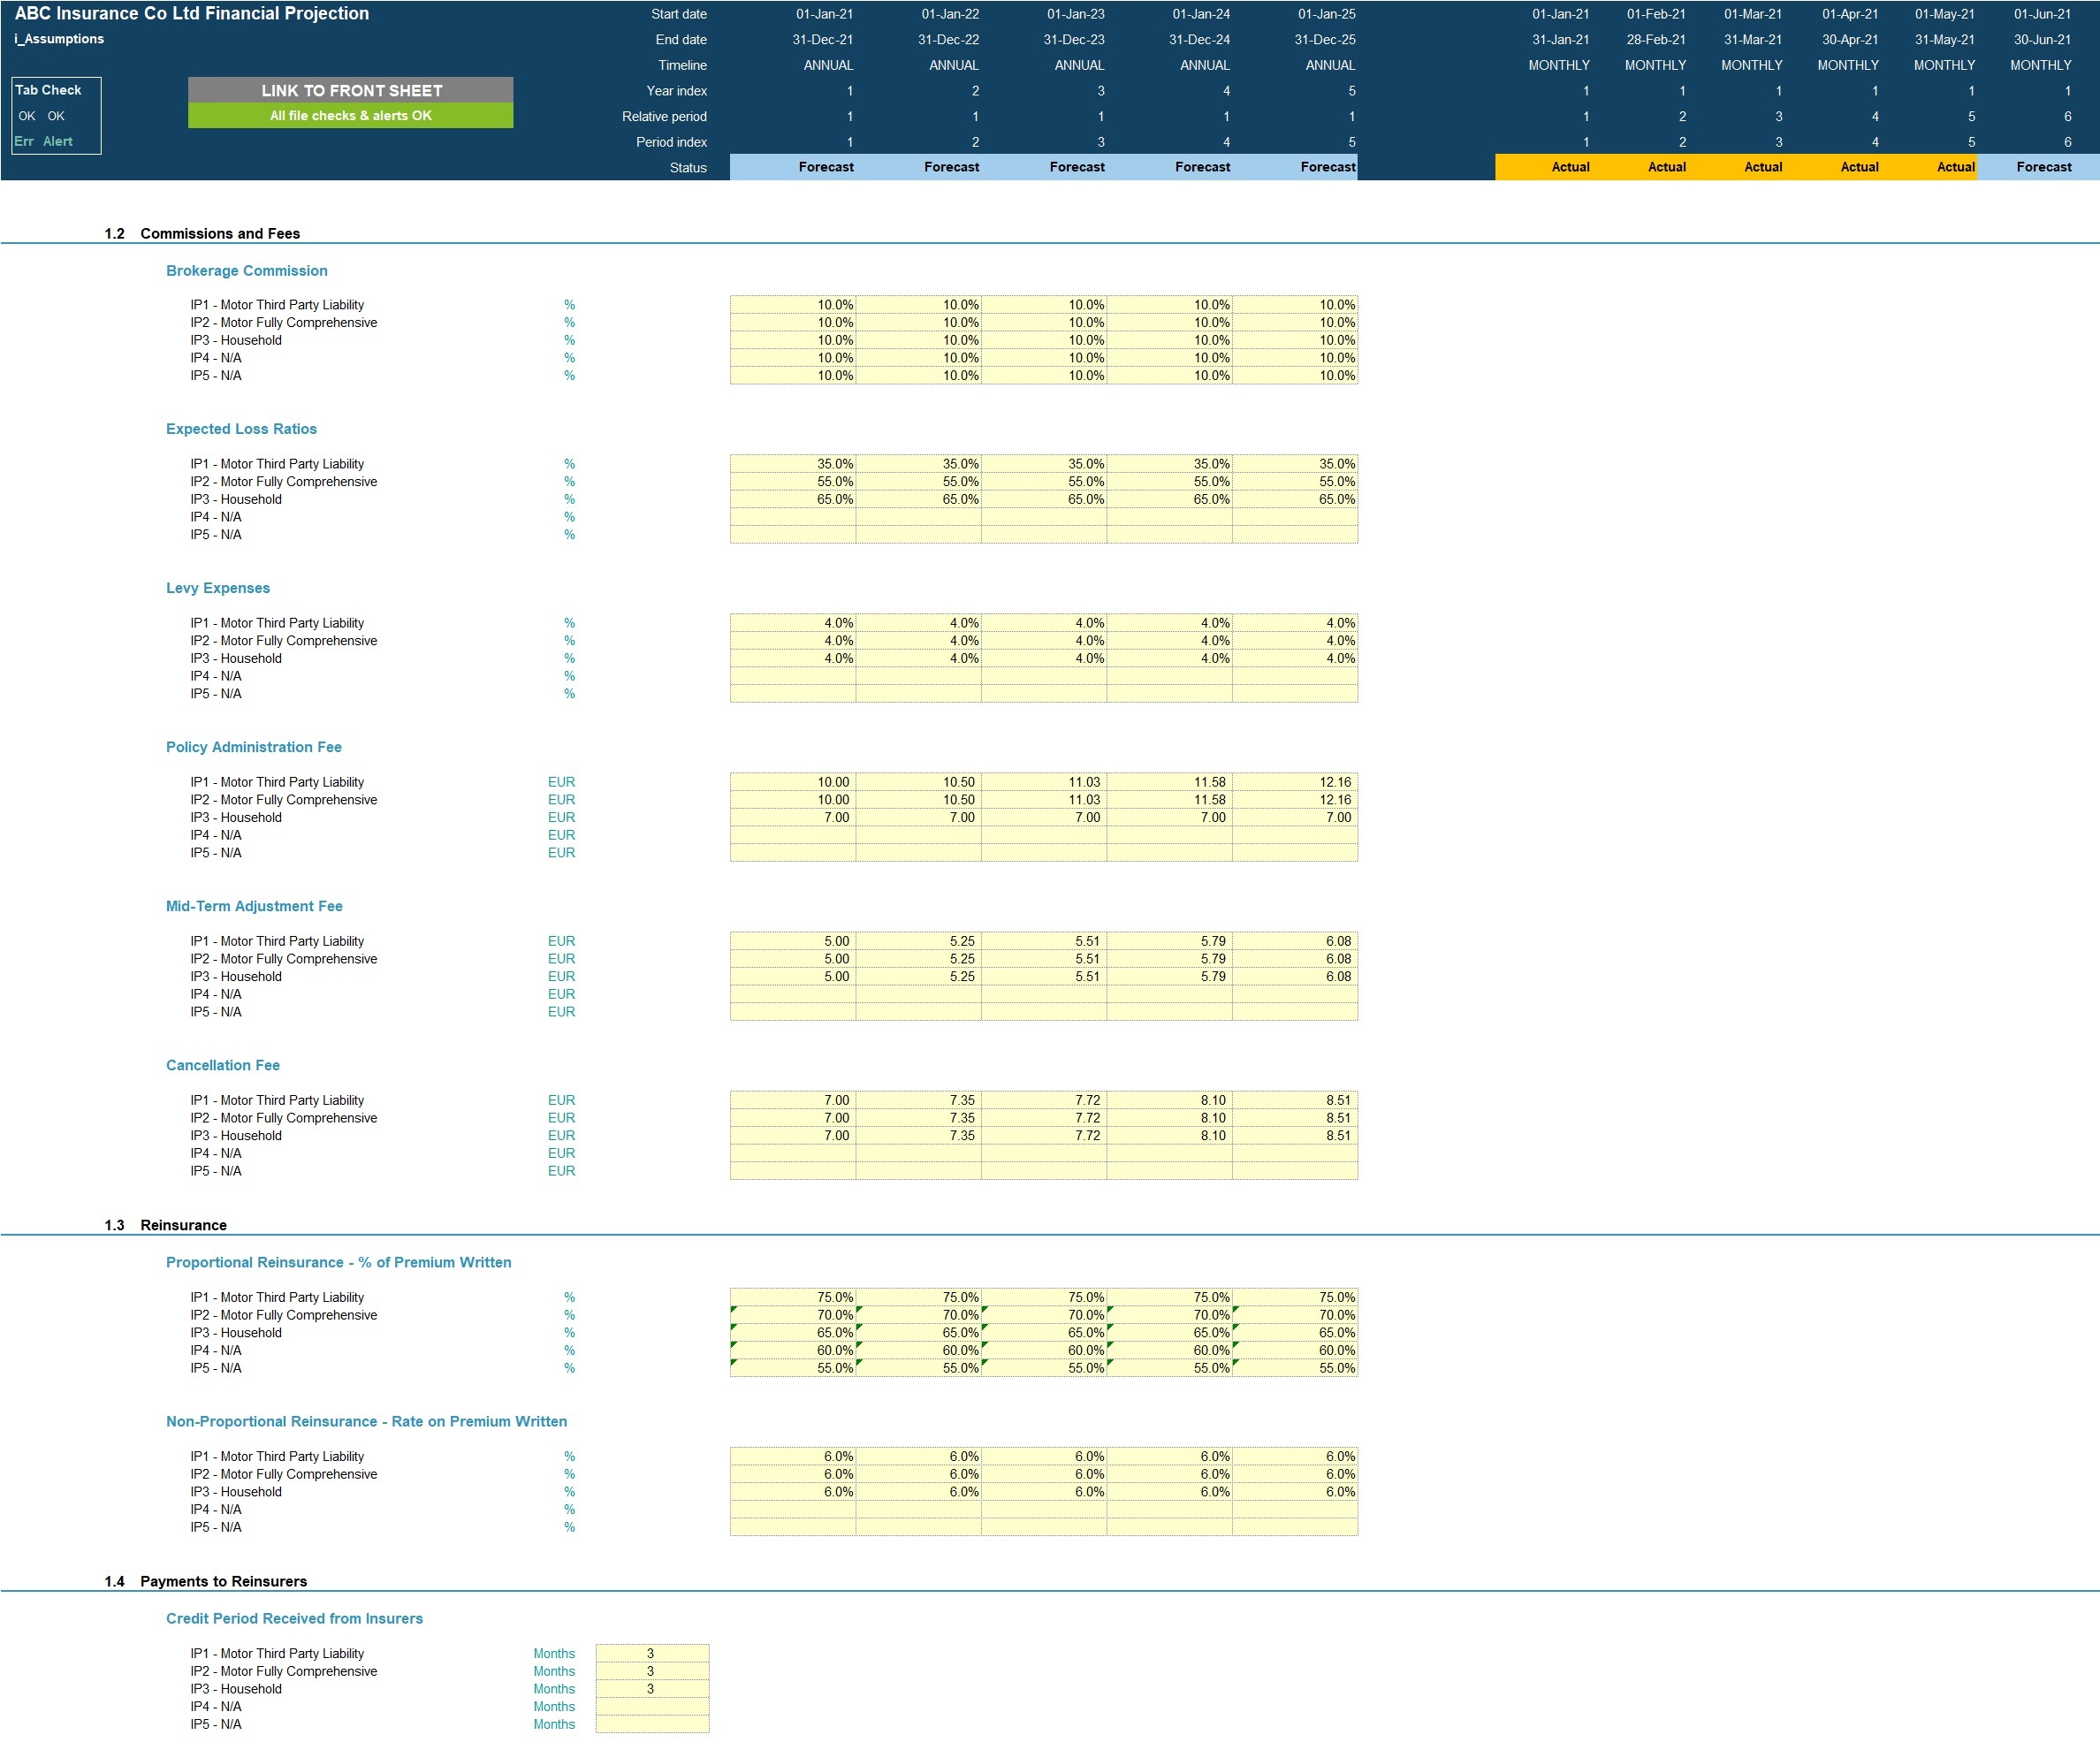
The model allows the user to model up to 10 different insurance products (can be extended) including new business, renewals, cancellations and mid-term adjustments (MTAs) for each product with separate commissions, levies, loss ratios and reinsurance rates for each product and earnings based on policy coverage period.
Apart from underwriting income and expenses, the model allows the user to model staff costs, marketing costs, other administrative costs, fixed assets, financial investments, corporate tax, borrowings, equity additions and dividend distributions and includes a discounted cash flow valuation with adjustment for capital requirements.
The model follows good practice financial modelling principles and includes instructions, line-item explanations, checks and input validations.
KEY OUTPUTS
The key outputs include:
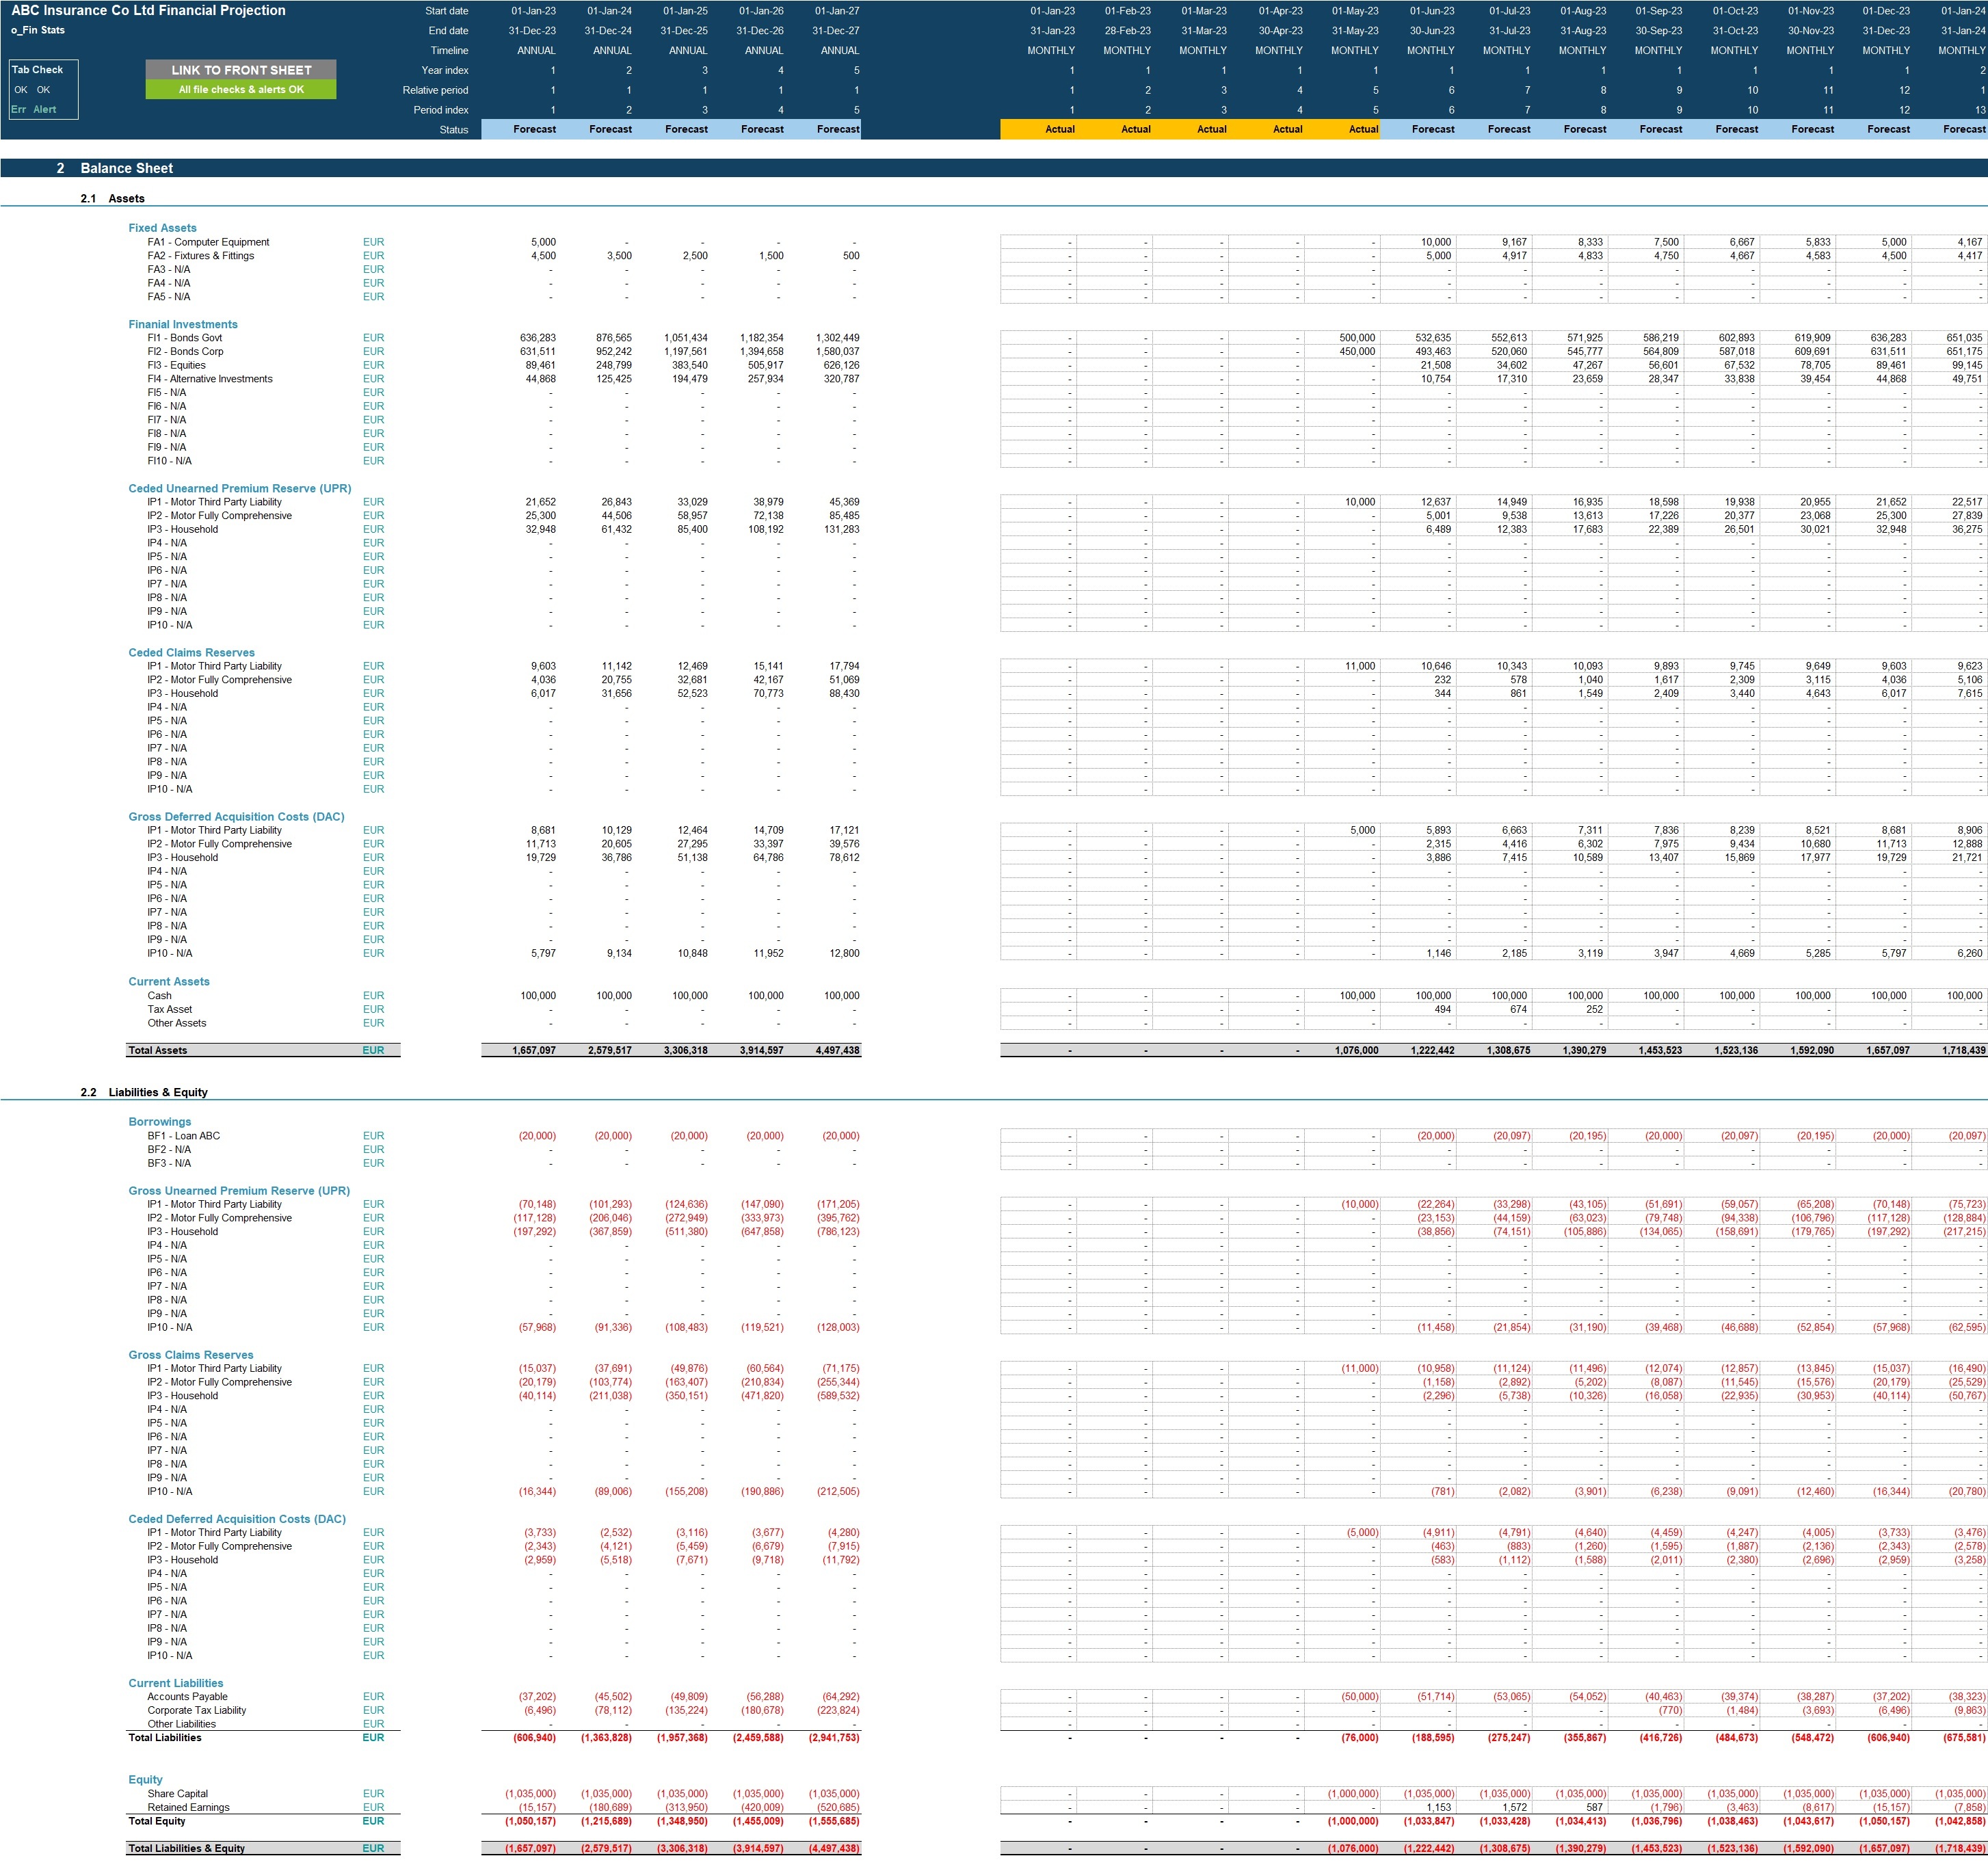
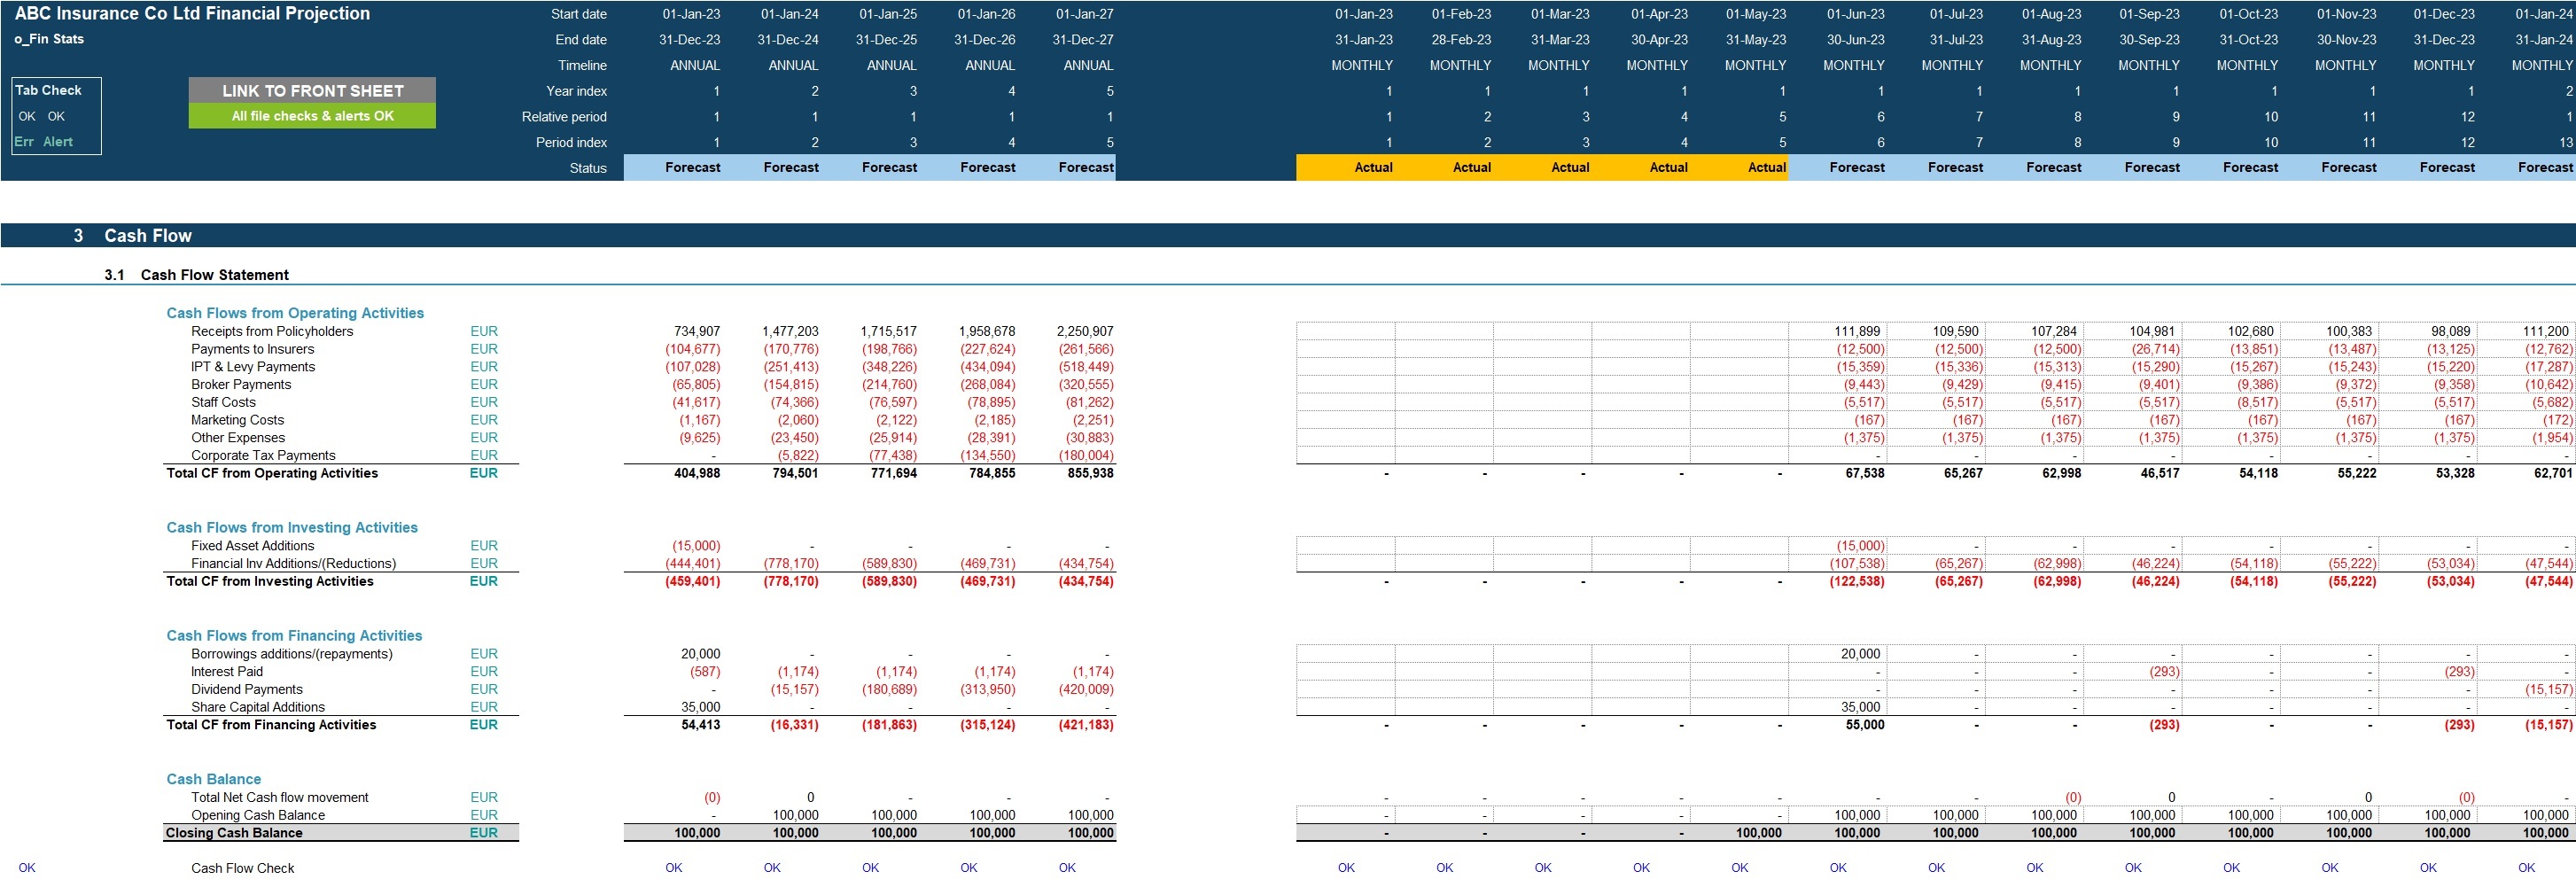
- Projected full financial statements (Income Statement, Balance Sheet and Cash flow Statement) presented on a monthly basis across 5 years and summarised on an annual basis.
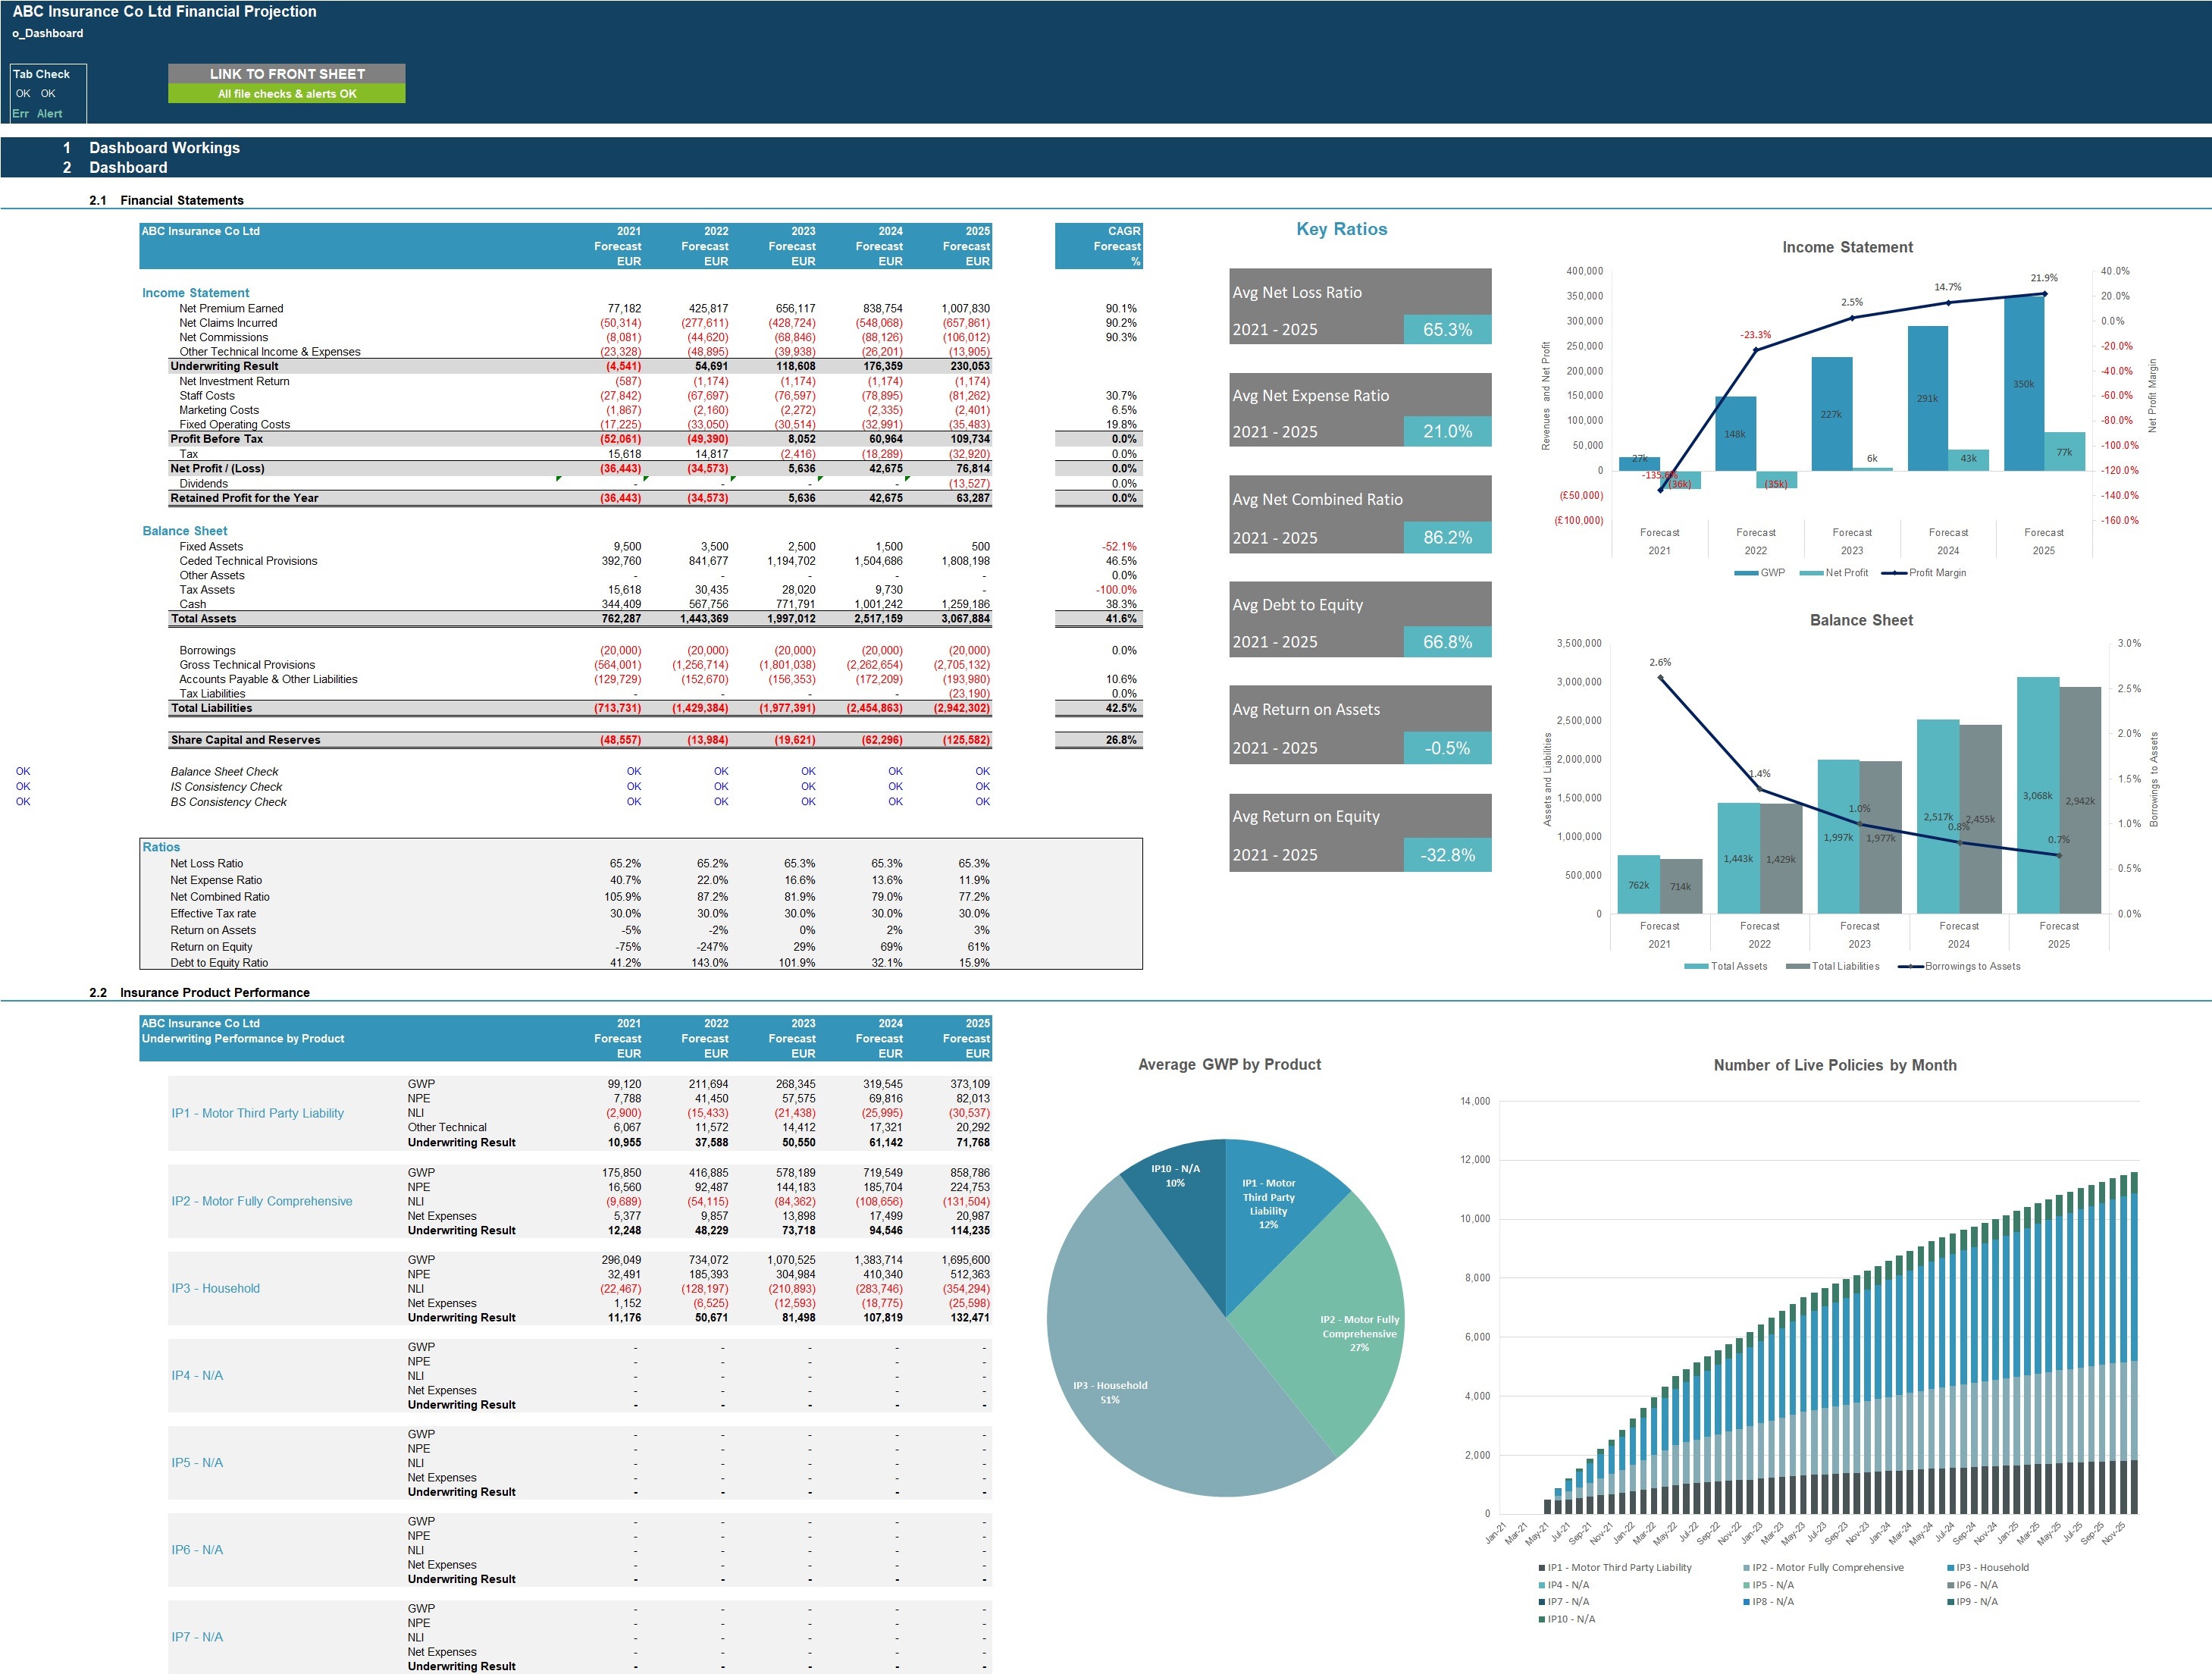
- Dashboard with:
o Summarised projected Income Statement and Balance Sheet;
o Compounded Annual Growth rate (CAGR) for each summarised income statement and Balance Sheet line item;
o List of key ratios including loss ratio, expense ratio, combined ratio, average return on assets and equity and average debt to equity ratio;
o Bar charts summarising income statement and Balance Sheet projections;
o Chart presenting underwriting result by product, average product mix and total live policies per month.
KEY INPUTS
Inputs are split into Income Statement and Balance Sheet Inputs. Most inputs include user-friendly line item explanations and input validations to help users understand what the input is for and populate correctly.
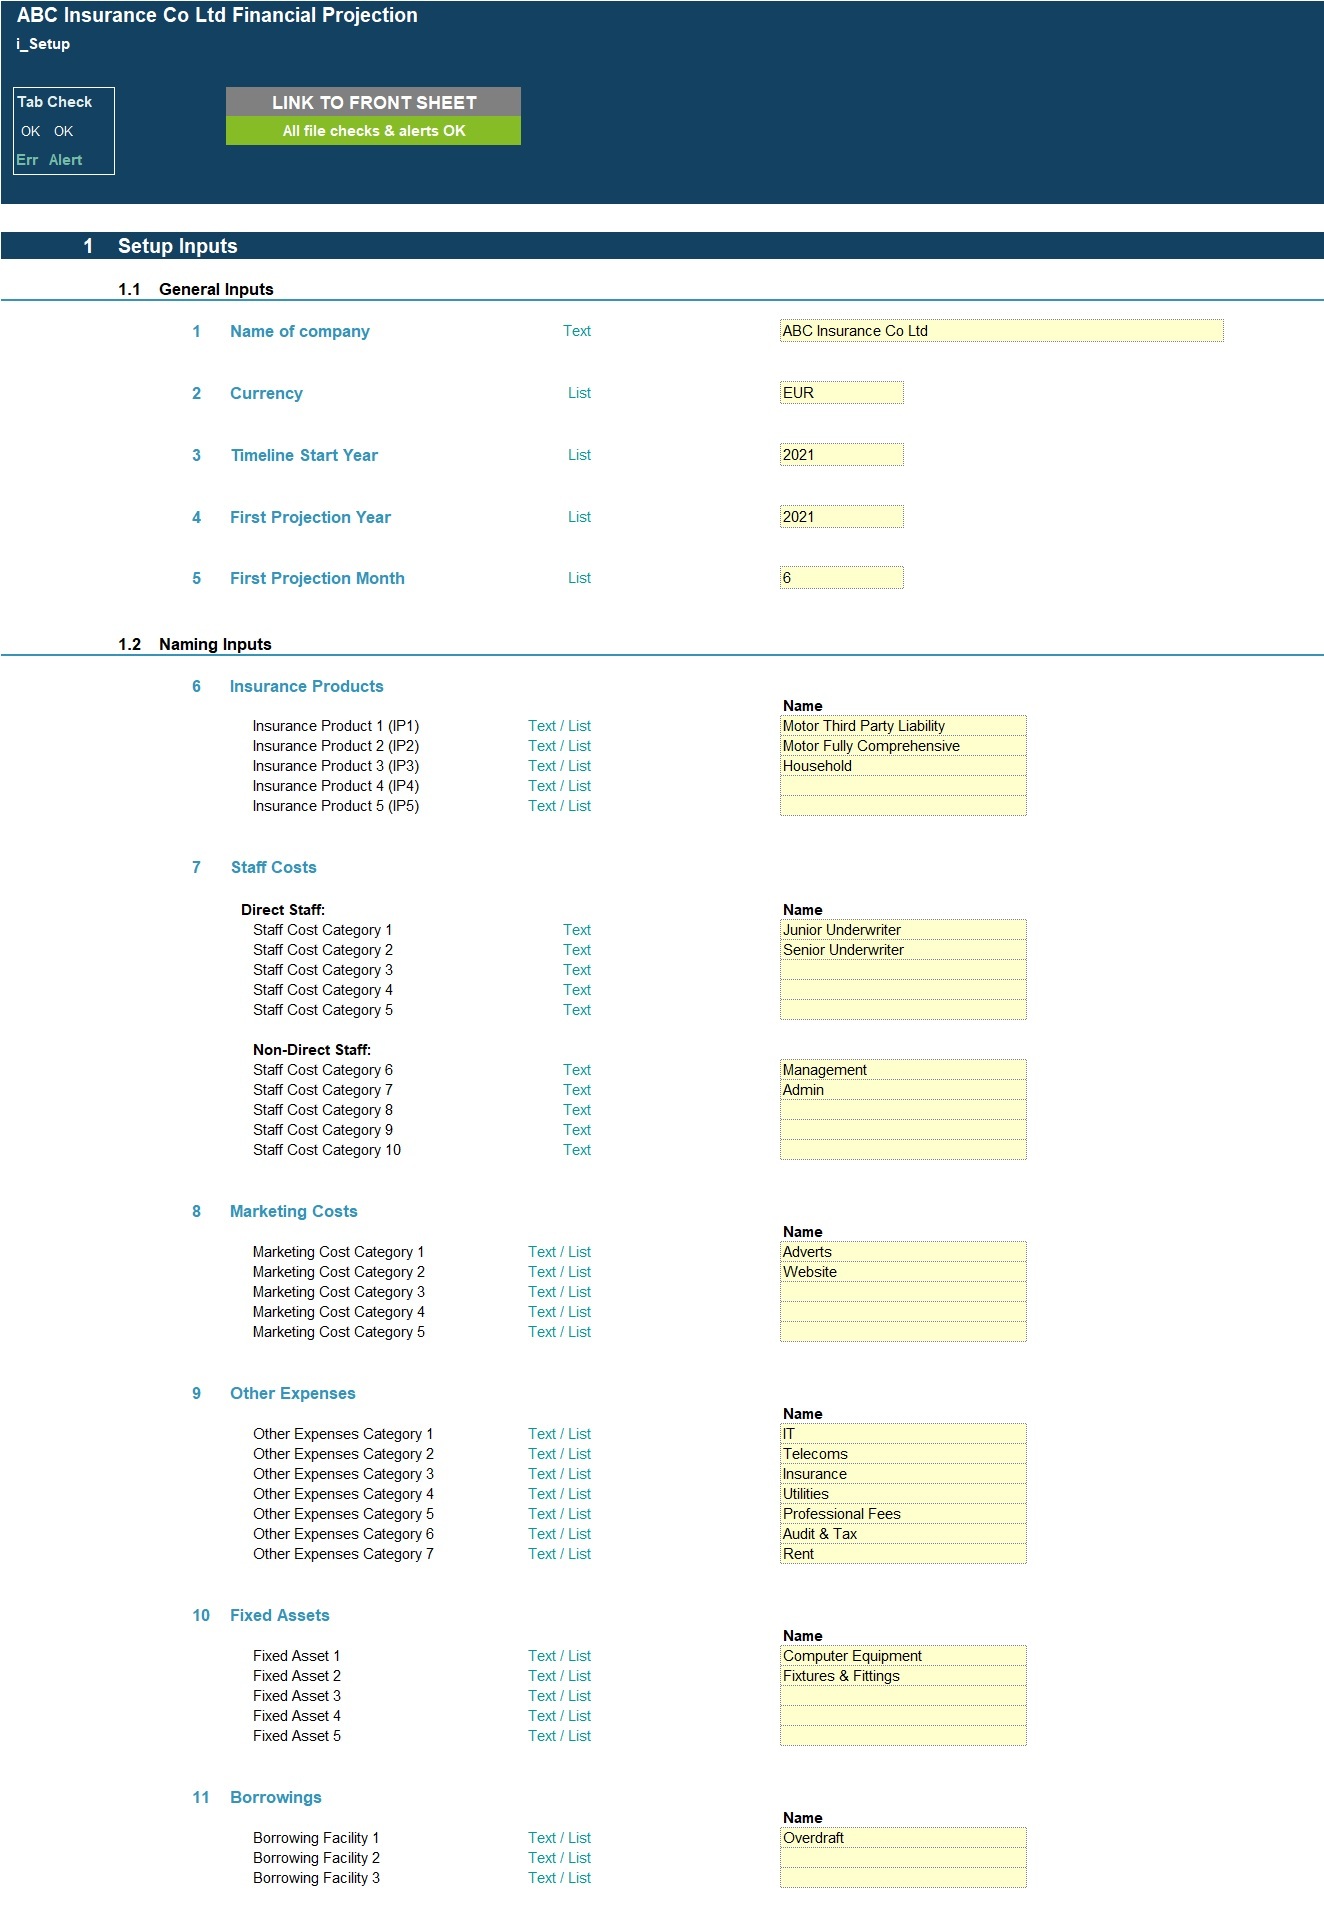
Setup Inputs:
- Name of business;
- Currency;
- First projection year and month;
- Naming for insurance products, staff cost categories, marketing cost categories, other expense categories, fixed asset categories and borrowings;
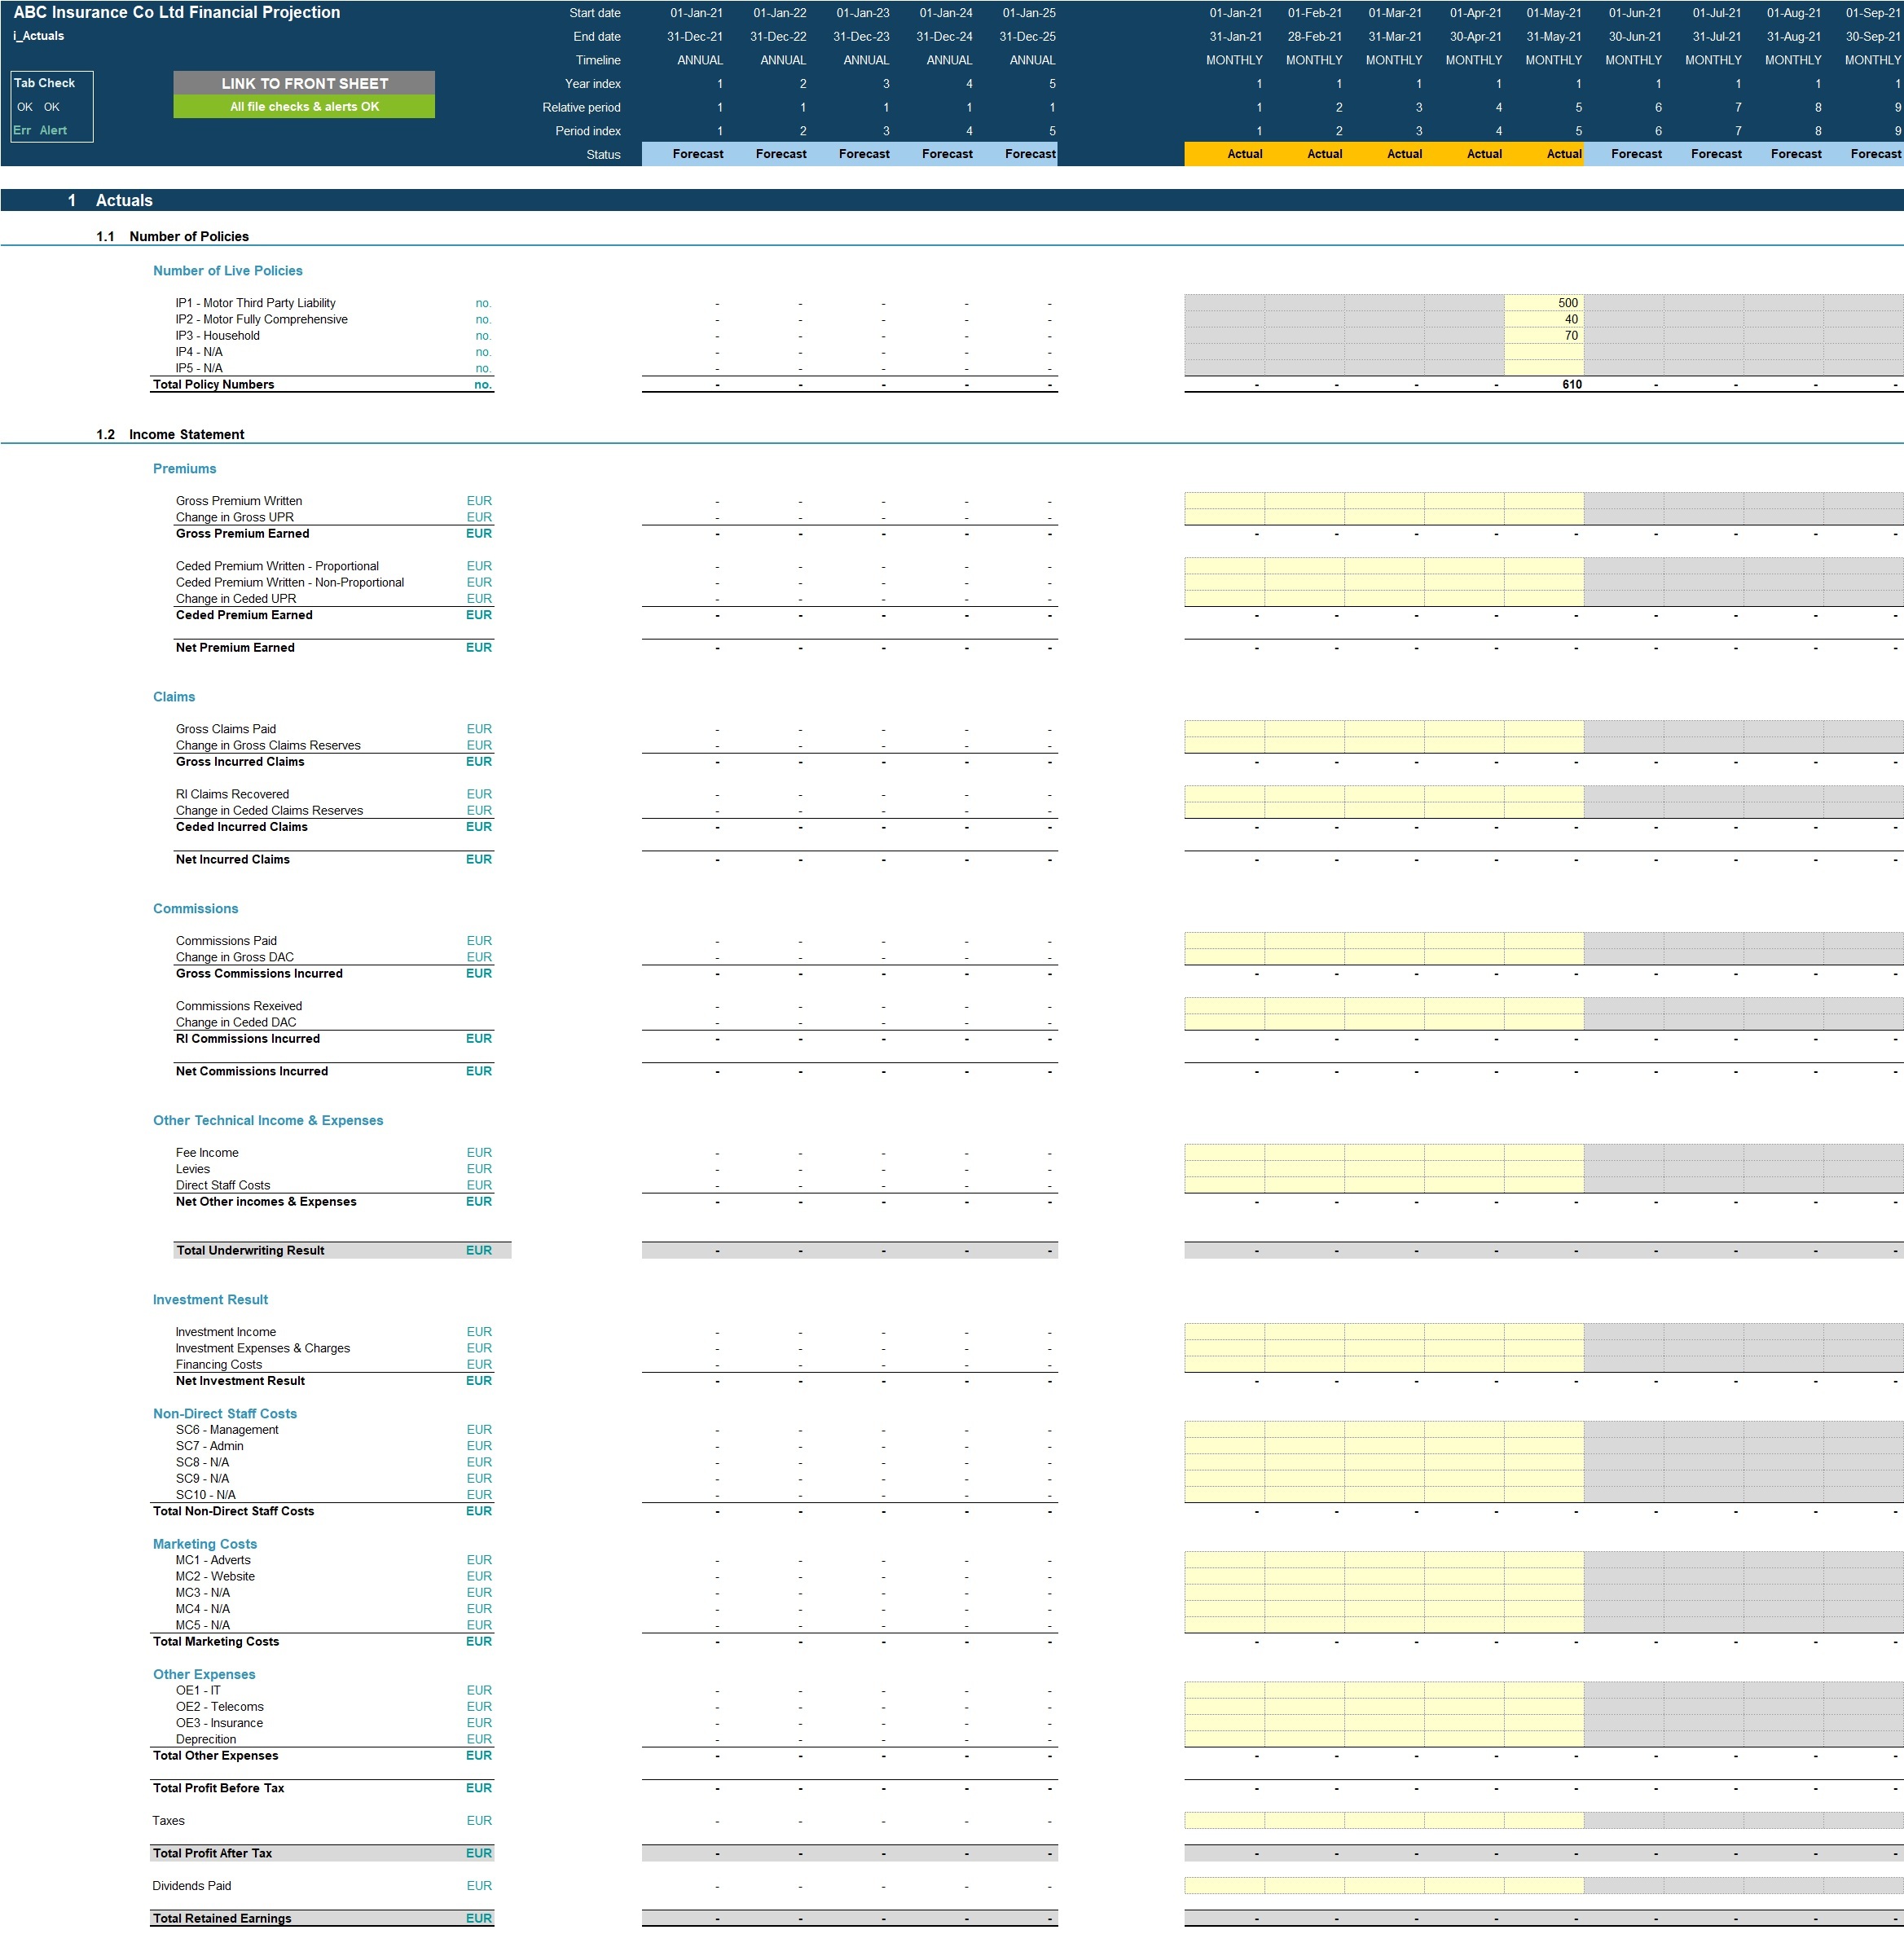
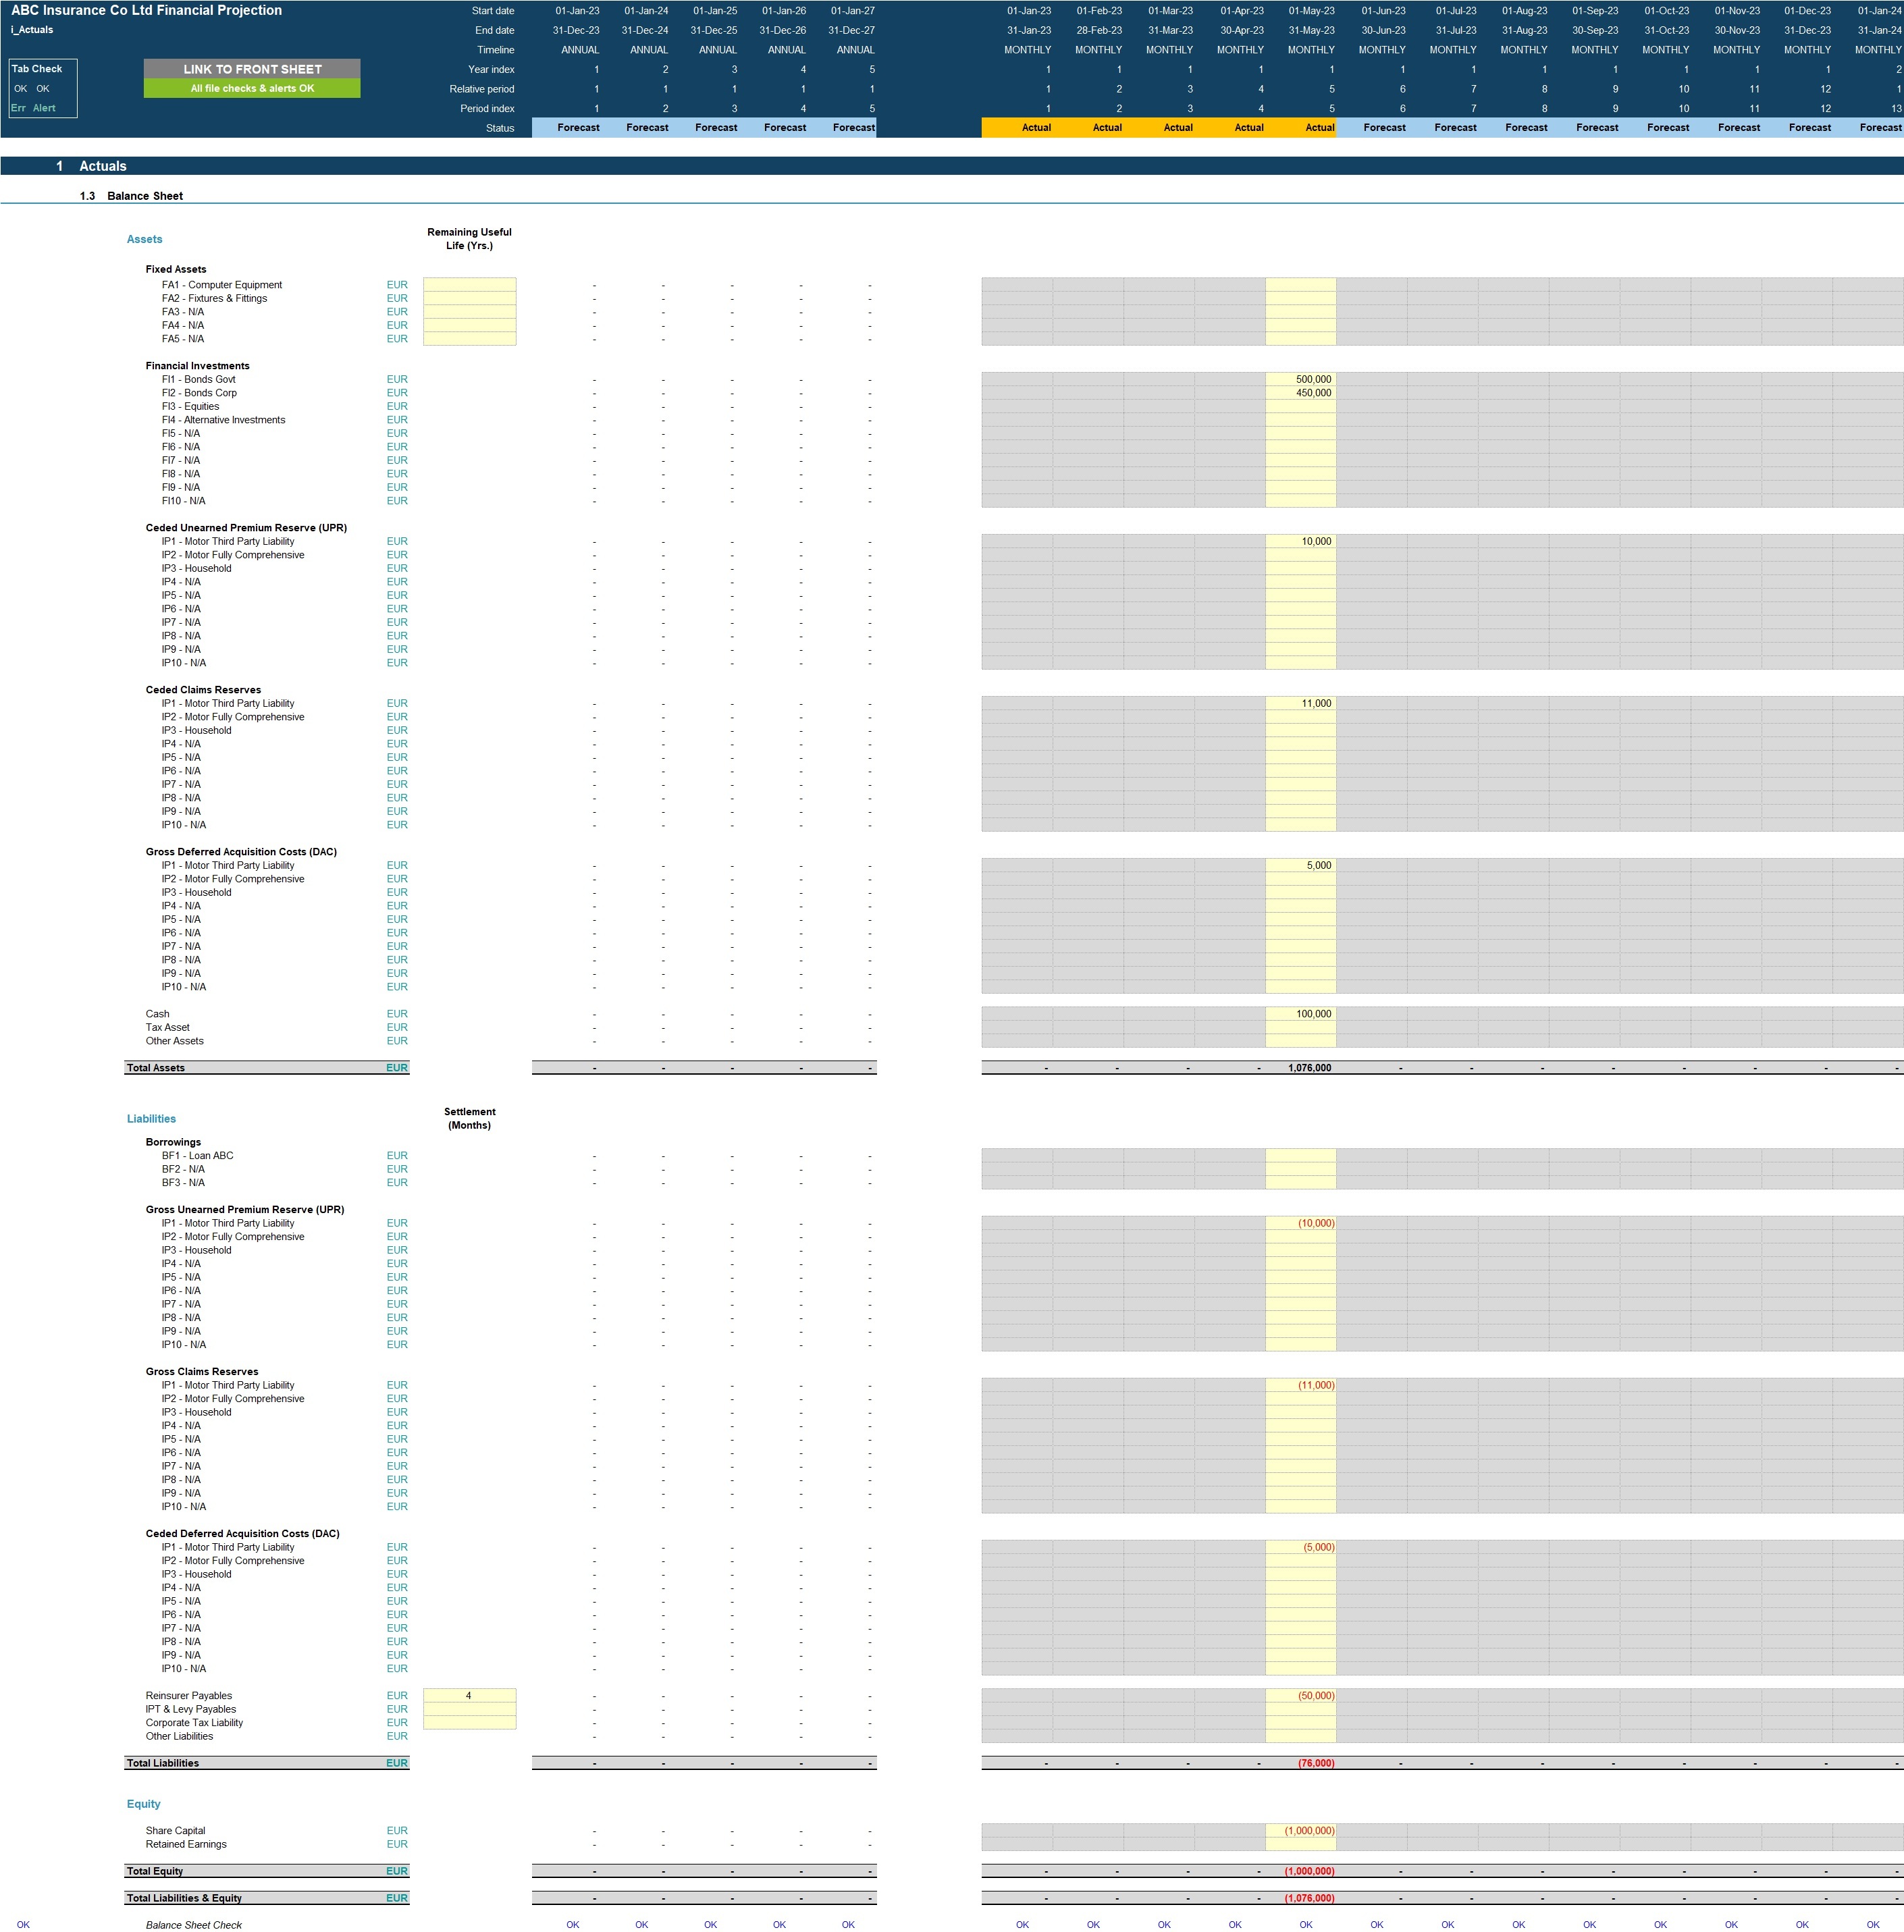
Actuals Inputs:
- Number of live policies (for existing businesses);
- Opening balance sheet (for existing businesses);
- Income Statement actuals (for trend analysis);
Projection Inputs:
- Underwriting Result:
o Premium rate per product (with separate inputs for new business, renewals, MTAs and cancellations)
o Average policy coverage period
o Average claims payment period
o New business volume
o Renewal rates
o Cancellations rates (% of number of polices written)
o MTA rates ((% of number of polices written)
o Commission rates
o Expected loss ratios
o Levy rates
o Reinsurance percentages (separate for proportional and non-proportional)
o Fee rates (with separate inputs for policy administration, MTAs and cancellations)
o Settlement periods
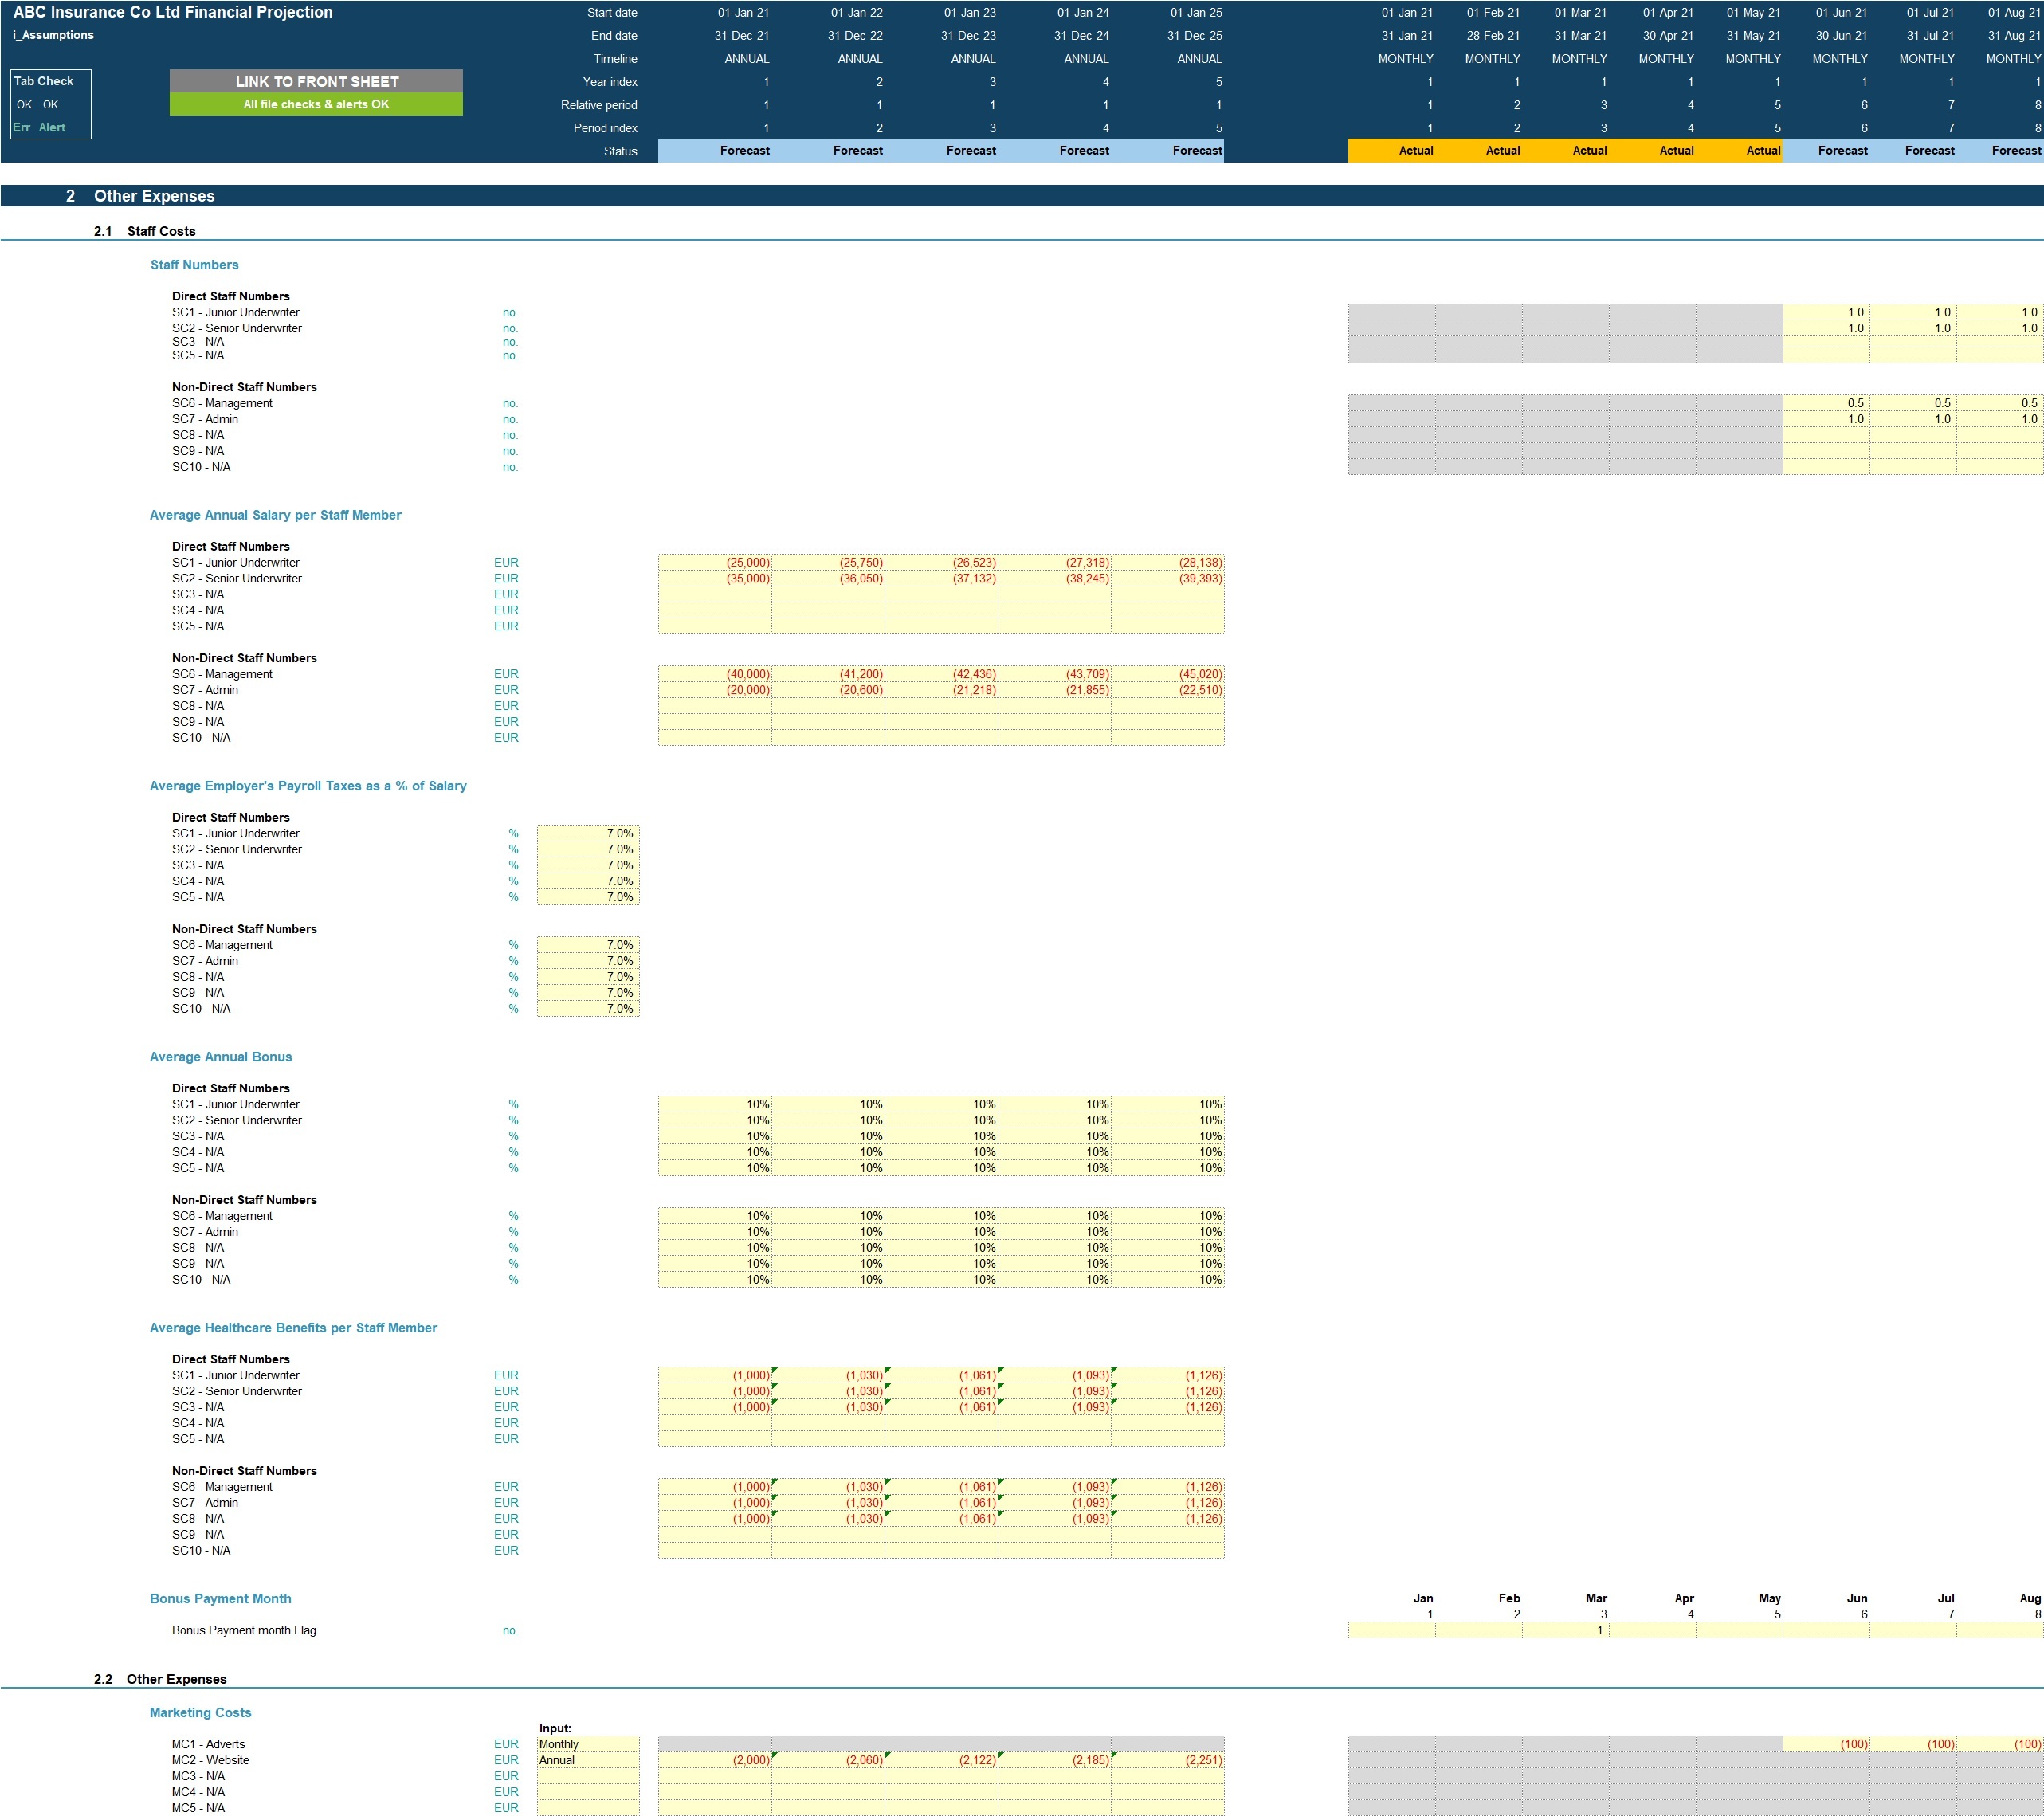
- Staff Costs including:
o Staff numbers;
o Average Annual cost per staff member;
o Average employer’s payroll taxes as % of salary;
o Average annual bonus;
o Average healthcare benefits per staff member;
- Other cost inputs including
o Direct expenses;
o Marketing costs;
o Staff costs;
o Other costs.
- Insurance premium tax and corporate tax inputs including rate and payment periods;
- Target solvency capital requirements;
- Fixed Assets including addition amounts and useful life;
- Financial investments including asset allocation, return percentages and target cash balance;
- Borrowings including addition/redemption amounts and interest rate;
- Share Capital additions.
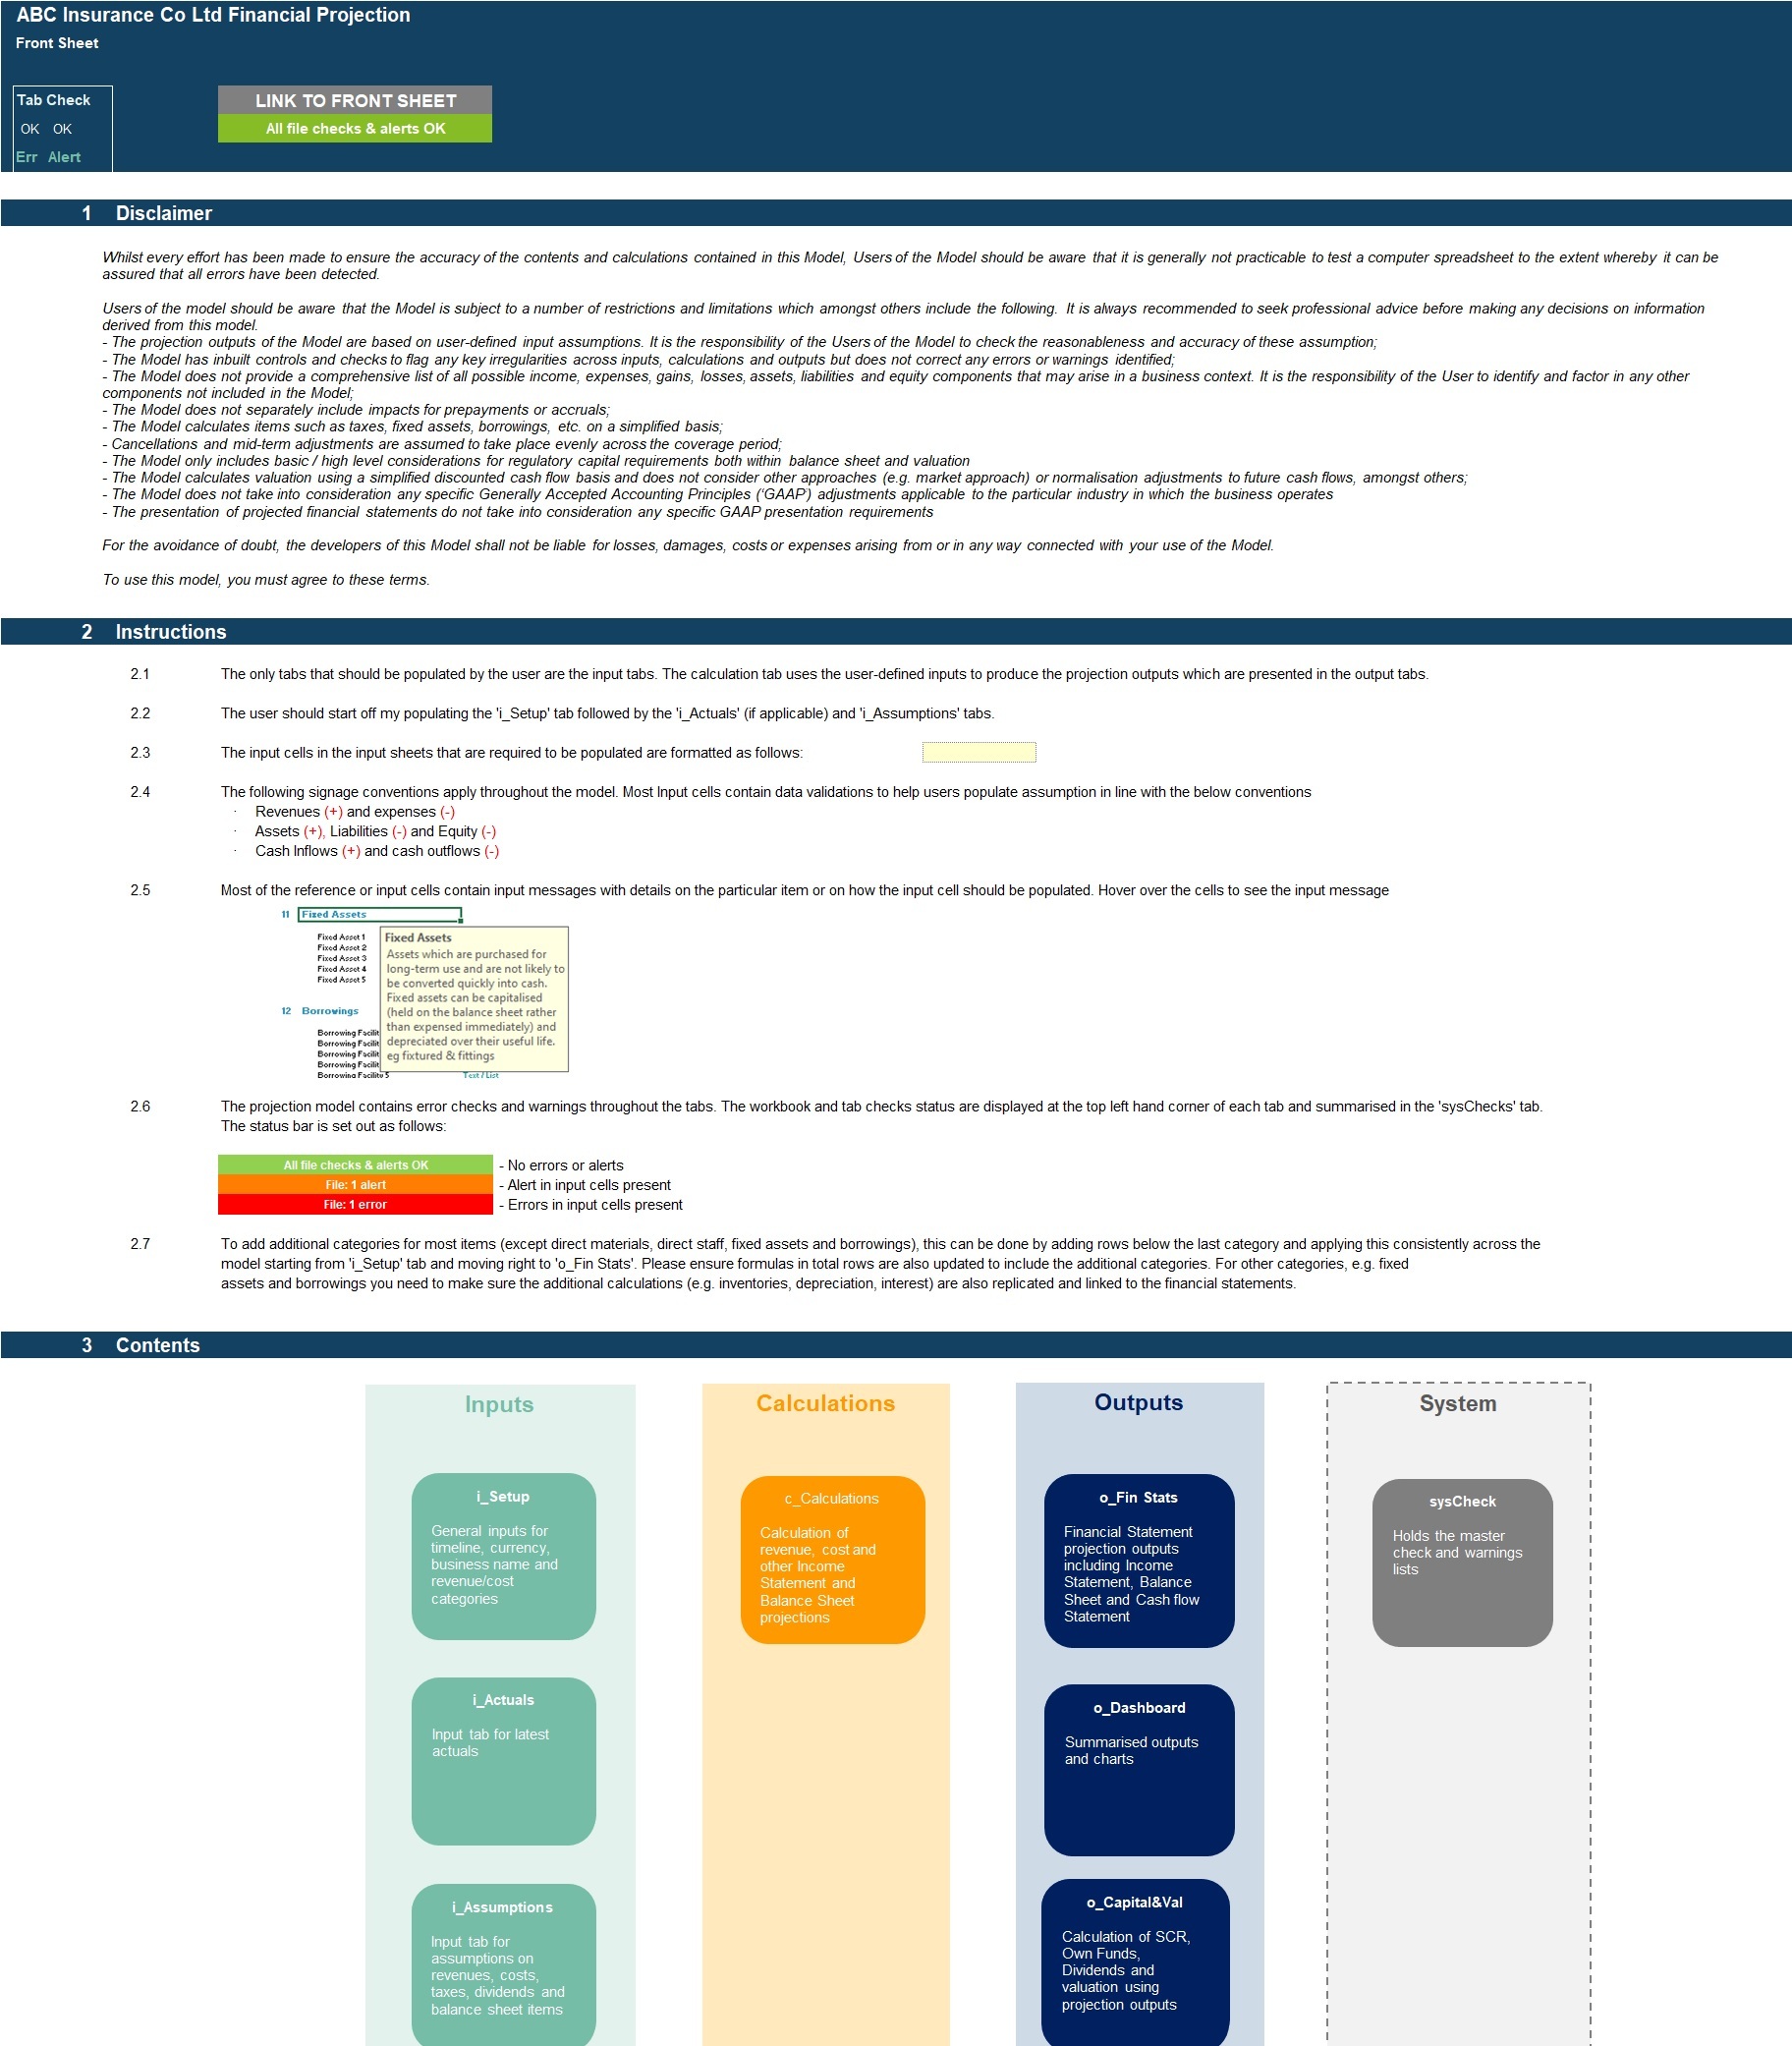
MODEL STRUCTURE
The model comprises of 9 tabs split into input ('i_'), calculation ('c_'), output ('o_’) and system tabs. The tabs to be populated by the user are the input tabs ('i_Setup', ‘i_Actuals’ and 'i_Assumptions'). The calculation tab uses the user-defined inputs to calculate and produce the projection outputs which are presented in 'o_Fin Stats', ‘o_Dashboard’ and ‘o_Capital&Val’.
System tabs include:
- A 'Front Sheet' containing a disclaimer, instructions and contents;
- A Checks dashboard containing a summary of checks by tab.
KEY FEATURES
Other key features of this model include the following:
- The model follows best practice financial modelling guidelines and includes instructions, line-item explanations, checks and input validations;
- The model is not password protected and can be modified as required following download;
- The model contains a dynamic timeline that allows for a mix of actual and forecast period across a 5-year period allowing projections to be rolled forward from month to month;
- Timeline is split on a monthly basis and summarised on an annual basis;
- Costs are split into: direct and non-direct for better driver-based forecasting;
- The model allows for the following number of underlying categories for each line item (these can be easily expanded if required):
o Insurance Products – 10 categories;
o Staff costs – 10 categories (5 direct, 5 non-direct);
o Marketing costs – 5 categories;
o Other expenses – 15 categories;
o Fixed assets – 5 categories;
o Financial investments – 10 categories;
o Borrowings – 3 facilities;
- Apart from projecting revenue and costs the model includes the possibility to model, payables, fixed assets, borrowings, dividends, corporate tax and insurance premium tax;
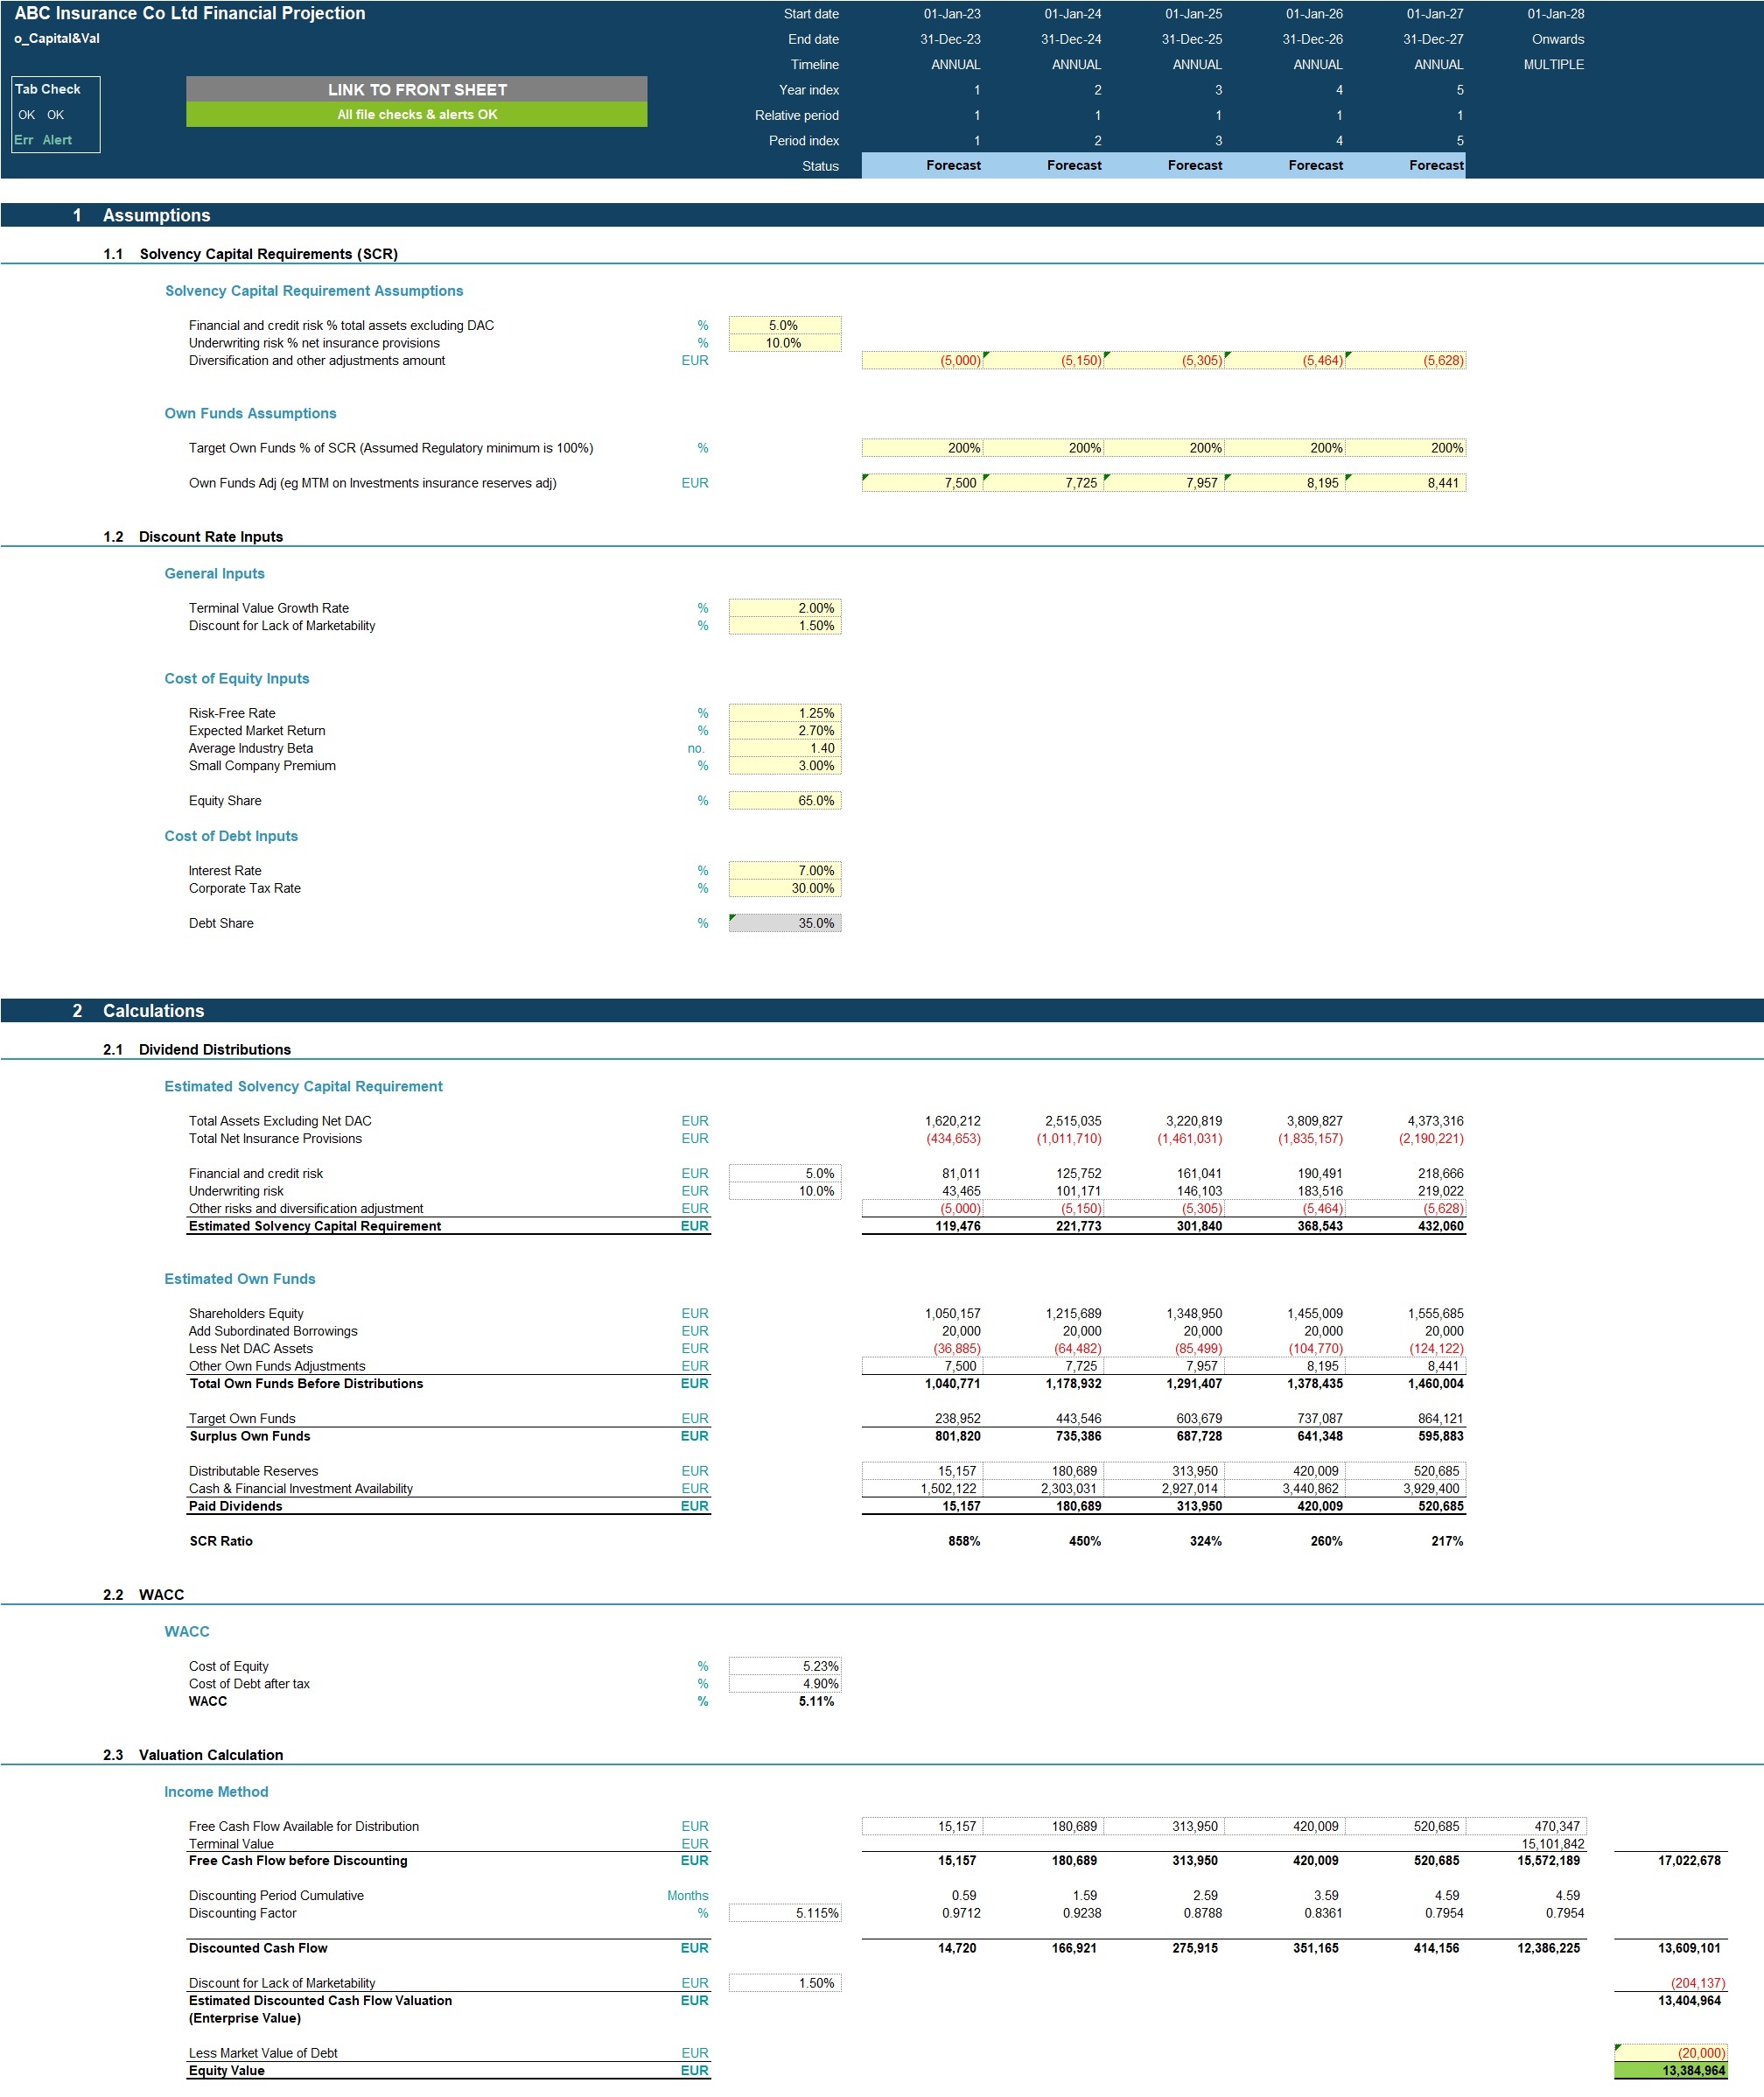
- The model included an integrated discounted cash flow valuation using calculation of surplus capital above target solvency capital requirement;
- Business name, currency, starting projection period are fully customisable;
- Revenue, cost, fixed asset and borrowing category descriptions are fully customisable;
- The model includes instructions, checks and input validations to help ensure input fields are populated accurately;
- The model includes a checks dashboard which summarises all the checks included in the various tabs making it easier to identify any errors.
SUPPORT & MODIFICATIONS
If you require any support or be-spoke modifications to the model, we happy to assist with this. Please send us a private message
ABOUT PROJECTIFY
We are financial modelling professionals with experience working in big 4 business modelling teams and strong experience supporting businesses with their financial planning and decision support needs. Our aim is to provide robust and easy-to-use tools that follow good practice financial modelling guidelines and assist individuals and businesses with their financial projection and analysis requirements.
We are keen to ensure our customers are satisfied with the models they purchase and will be more than happy to assist with any questions or support required.
We are also always keen to receive feedback so please do let us know what you think of our models by sending us a message or submitting a review.
PURPOSE OF MODEL
Highly versatile and user-friendly Excel model for the preparation a of 5-year rolling 3 statement (Income Statement, Balance Sheet and Cash flow Statement) financial projection with a monthly timeline for a startup or existing general (non-life) insurance business generating underwriting income and fee revenue from the underwriting of insurance policies.
The model allows the user to model up to 10 different insurance products (can be extended) including new business, renewals, cancellations and mid-term adjustments (MTAs) for each product with separate commissions, levies, loss ratios and reinsurance rates for each product and earnings based on policy coverage period.
Apart from underwriting income and expenses, the model allows the user to model staff costs, marketing costs, other administrative costs, fixed assets, financial investments, corporate tax, borrowings, equity additions and dividend distributions and includes a discounted cash flow valuation with adjustment for capital requirements.
The model follows good practice financial modelling principles and includes instructions, line-item explanations, checks and input validations.
KEY OUTPUTS
The key outputs include:
- Projected full financial statements (Income Statement, Balance Sheet and Cash flow Statement) presented on a monthly basis across 5 years and summarised on an annual basis.
- Dashboard with:
o Summarised projected Income Statement and Balance Sheet;
o Compounded Annual Growth rate (CAGR) for each summarised income statement and Balance Sheet line item;
o List of key ratios including loss ratio, expense ratio, combined ratio, average return on assets and equity and average debt to equity ratio;
o Bar charts summarising income statement and Balance Sheet projections;
o Chart presenting underwriting result by product, average product mix and total live policies per month.
KEY INPUTS
Inputs are split into Income Statement and Balance Sheet Inputs. Most inputs include user-friendly line item explanations and input validations to help users understand what the input is for and populate correctly.
Setup Inputs:
- Name of business;
- Currency;
- First projection year and month;
- Naming for insurance products, staff cost categories, marketing cost categories, other expense categories, fixed asset categories and borrowings;
Actuals Inputs:
- Number of live policies (for existing businesses);
- Opening balance sheet (for existing businesses);
- Income Statement actuals (for trend analysis);
Projection Inputs:
- Underwriting Result:
o Premium rate per product (with separate inputs for new business, renewals, MTAs and cancellations)
o Average policy coverage period
o Average claims payment period
o New business volume
o Renewal rates
o Cancellations rates (% of number of polices written)
o MTA rates ((% of number of polices written)
o Commission rates
o Expected loss ratios
o Levy rates
o Reinsurance percentages (separate for proportional and non-proportional)
o Fee rates (with separate inputs for policy administration, MTAs and cancellations)
o Settlement periods
- Staff Costs including:
o Staff numbers;
o Average Annual cost per staff member;
o Average employer’s payroll taxes as % of salary;
o Average annual bonus;
o Average healthcare benefits per staff member;
- Other cost inputs including
o Direct expenses;
o Marketing costs;
o Staff costs;
o Other costs.
- Insurance premium tax and corporate tax inputs including rate and payment periods;
- Target solvency capital requirements;
- Fixed Assets including addition amounts and useful life;
- Financial investments including asset allocation, return percentages and target cash balance;
- Borrowings including addition/redemption amounts and interest rate;
- Share Capital additions.
MODEL STRUCTURE
The model comprises of 9 tabs split into input ('i_'), calculation ('c_'), output ('o_’) and system tabs. The tabs to be populated by the user are the input tabs ('i_Setup', ‘i_Actuals’ and 'i_Assumptions'). The calculation tab uses the user-defined inputs to calculate and produce the projection outputs which are presented in 'o_Fin Stats', ‘o_Dashboard’ and ‘o_Capital&Val’.
System tabs include:
- A 'Front Sheet' containing a disclaimer, instructions and contents;
- A Checks dashboard containing a summary of checks by tab.
KEY FEATURES
Other key features of this model include the following:
- The model follows best practice financial modelling guidelines and includes instructions, line-item explanations, checks and input validations;
- The model is not password protected and can be modified as required following download;
- The model contains a dynamic timeline that allows for a mix of actual and forecast period across a 5-year period allowing projections to be rolled forward from month to month;
- Timeline is split on a monthly basis and summarised on an annual basis;
- Costs are split into: direct and non-direct for better driver-based forecasting;
- The model allows for the following number of underlying categories for each line item (these can be easily expanded if required):
o Insurance Products – 10 categories;
o Staff costs – 10 categories (5 direct, 5 non-direct);
o Marketing costs – 5 categories;
o Other expenses – 15 categories;
o Fixed assets – 5 categories;
o Financial investments – 10 categories;
o Borrowings – 3 facilities;
- Apart from projecting revenue and costs the model includes the possibility to model, payables, fixed assets, borrowings, dividends, corporate tax and insurance premium tax;
- The model included an integrated discounted cash flow valuation using calculation of surplus capital above target solvency capital requirement;
- Business name, currency, starting projection period are fully customisable;
- Revenue, cost, fixed asset and borrowing category descriptions are fully customisable;
- The model includes instructions, checks and input validations to help ensure input fields are populated accurately;
- The model includes a checks dashboard which summarises all the checks included in the various tabs making it easier to identify any errors.
SUPPORT & MODIFICATIONS
If you require any support or be-spoke modifications to the model, we happy to assist with this. Please send us a private message
ABOUT PROJECTIFY
We are financial modelling professionals with experience working in big 4 business modelling teams and strong experience supporting businesses with their financial planning and decision support needs. Our aim is to provide robust and easy-to-use tools that follow good practice financial modelling guidelines and assist individuals and businesses with their financial projection and analysis requirements.
We are keen to ensure our customers are satisfied with the models they purchase and will be more than happy to assist with any questions or support required.
We are also always keen to receive feedback so please do let us know what you think of our models by sending us a message or submitting a review.
This Best Practice includes
1 Populated Excel Model and 1 Unpopulated Excel Model
Further information
Prepartion of a 5 year 3 statement (Income Statement, Balance Sheet, Cash Flow Statement) Financial Projection Model for a new or existing general (non-life) insurance company with earnings based on policy coverage period and dividends and valuation based on surplus capital above target solvency capital requirements.
