
Originally published: 14/02/2023 10:59
Last version published: 17/03/2025 10:38
Publication number: ELQ-49719-7
View all versions & Certificate
Last version published: 17/03/2025 10:38
Publication number: ELQ-49719-7
View all versions & Certificate

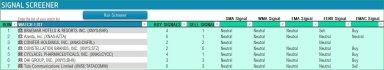
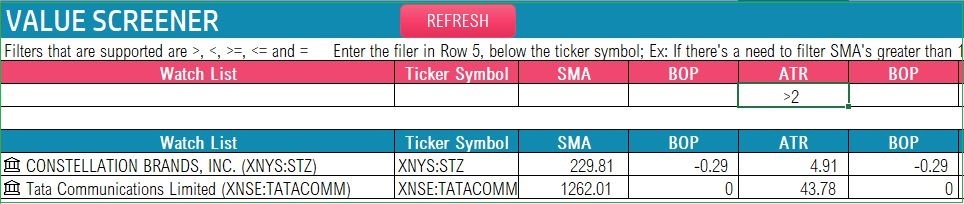
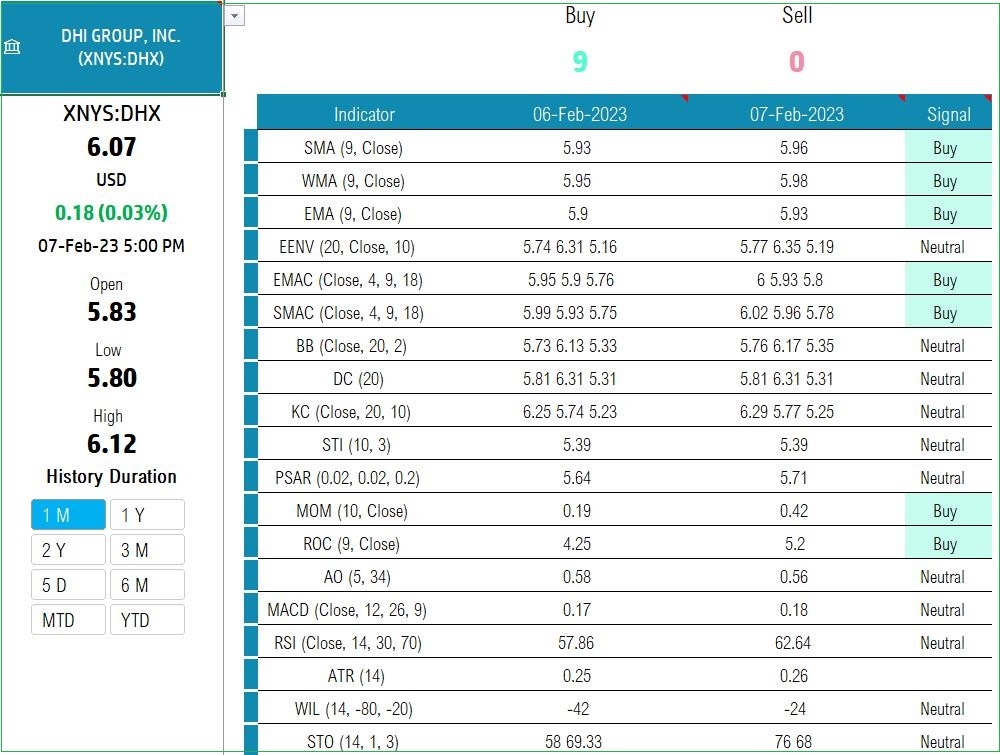
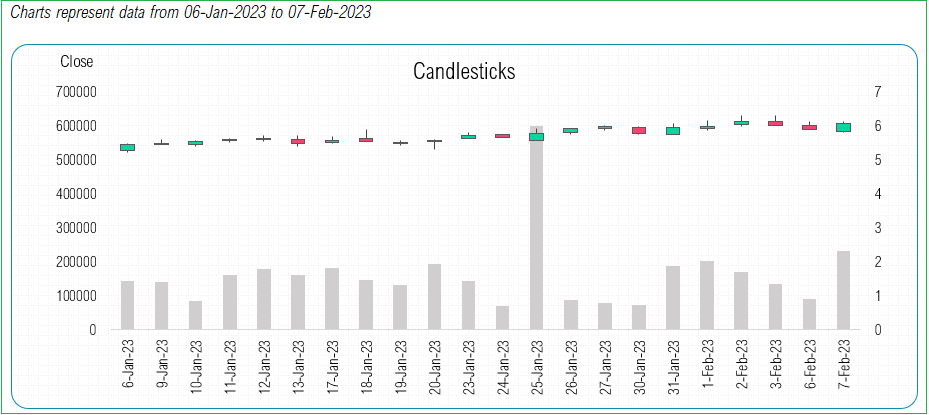
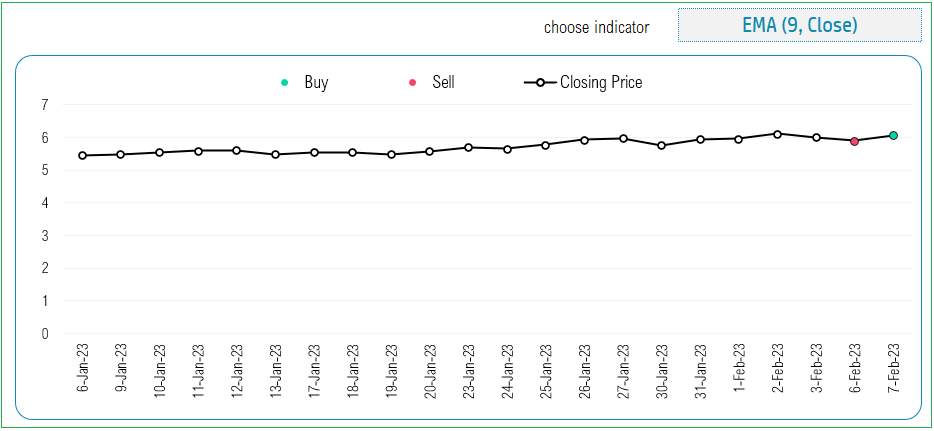
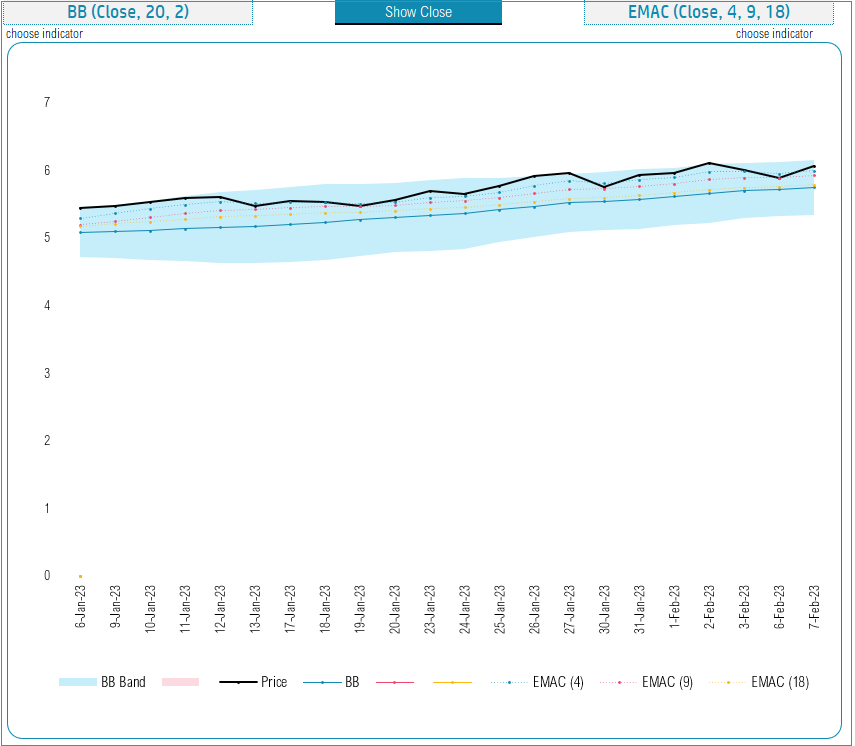
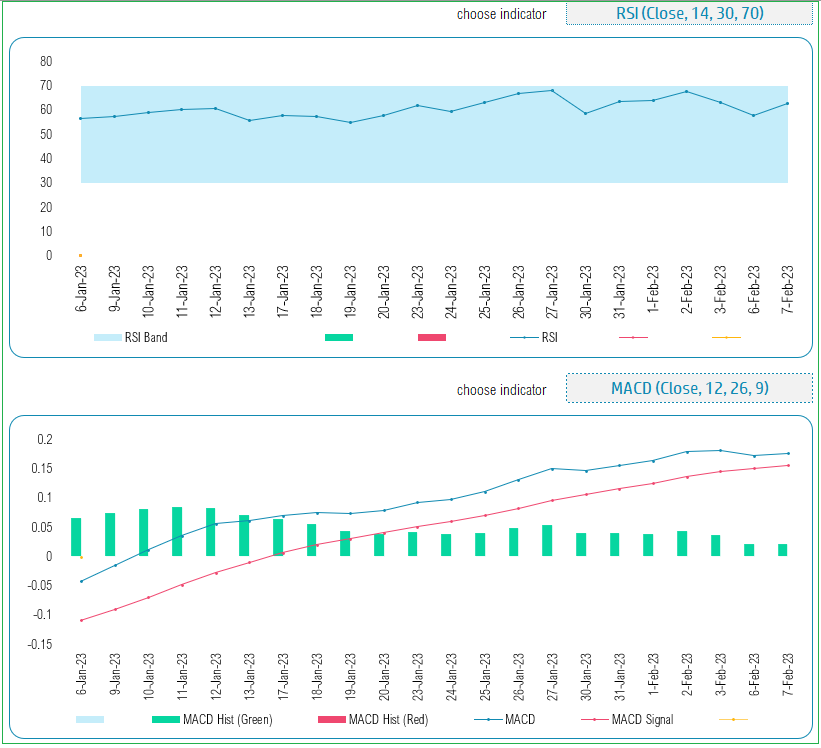
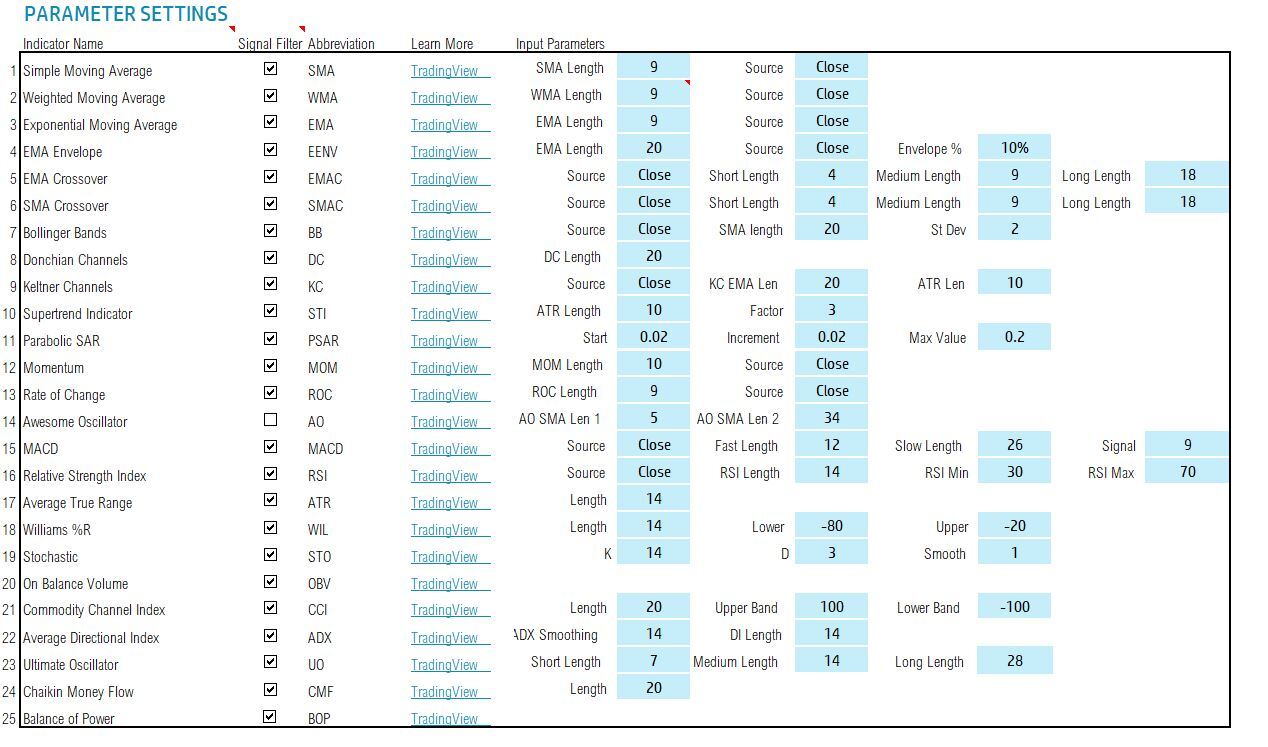
Stock Screener Excel Template
Get an in-depth analysis of stocks in a simple Excel spreadsheet. View multiple technical indicators of stocks, calculated automatically with this template.
