

Originally published: 28/09/2021 15:14
Publication number: ELQ-23240-1
View all versions & Certificate
Publication number: ELQ-23240-1
View all versions & Certificate

School Financial Model in Excel
School Financial Model in Excel
Expert in performance improvement and restructuring with significant experienceFollow 444
Description
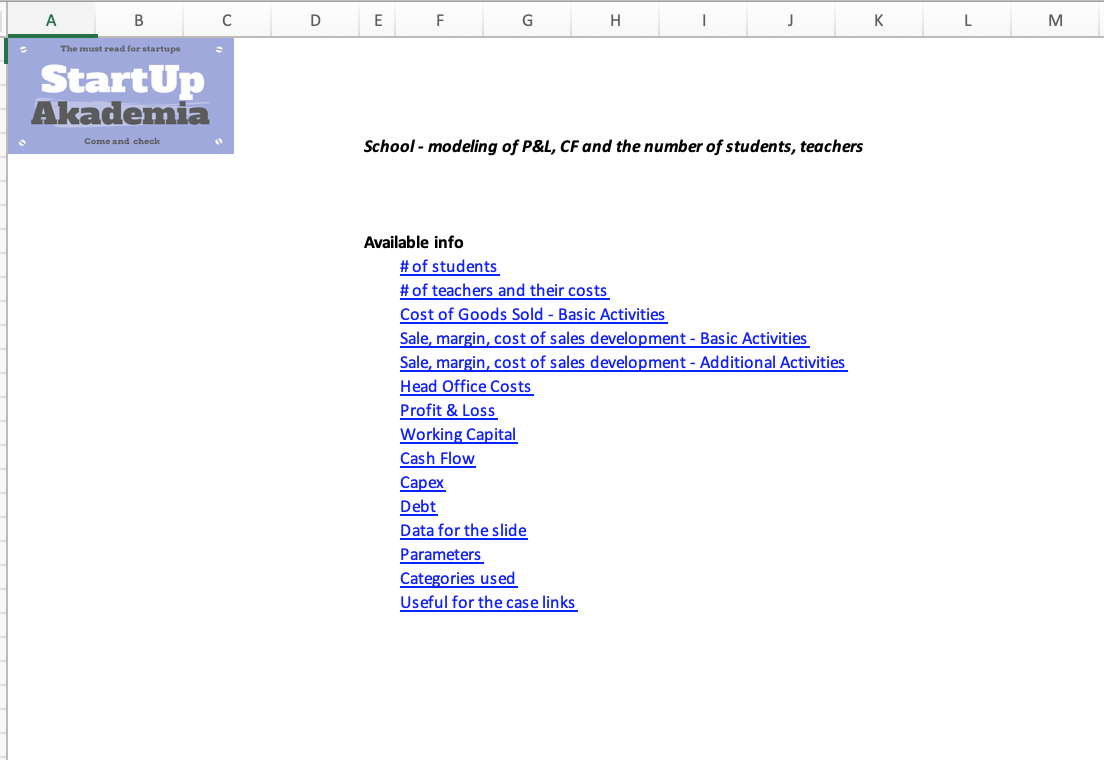
School Financial Model in Excel
Schools are interesting businesses to model in Excel. Apart from the usual things like P&L, Cash Flows, you model also the number of teachers and additional revenues from other than tuition or subvention sources. In this model, you can see how you can model such businesses. This is an annual model. By altering the cells in blue you can adjust the model to your needs.
A few information about the model
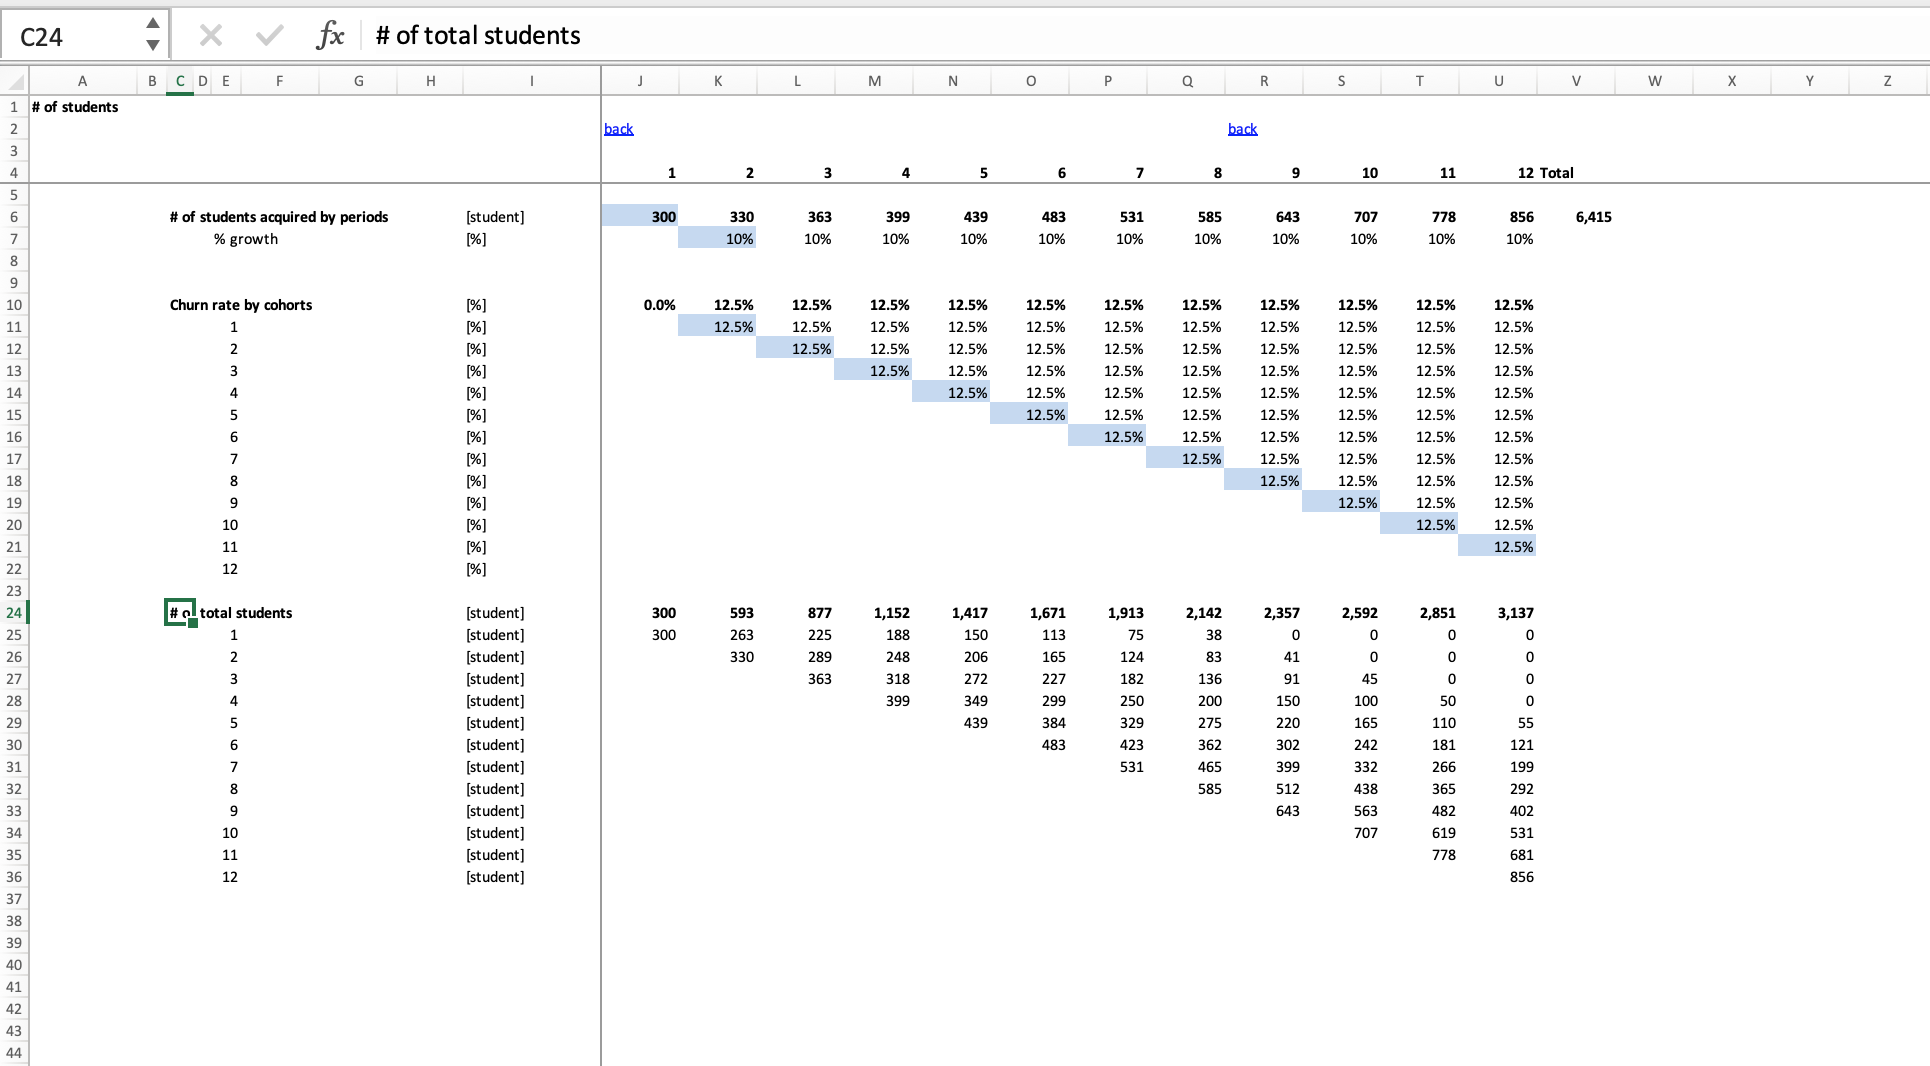
1. Students. In sheet Students, we model the number of students based on churn rate and the number of customers acquired. We assume that it is a school that covers 8 years of education so the natural churn rate will be at least 12.5%
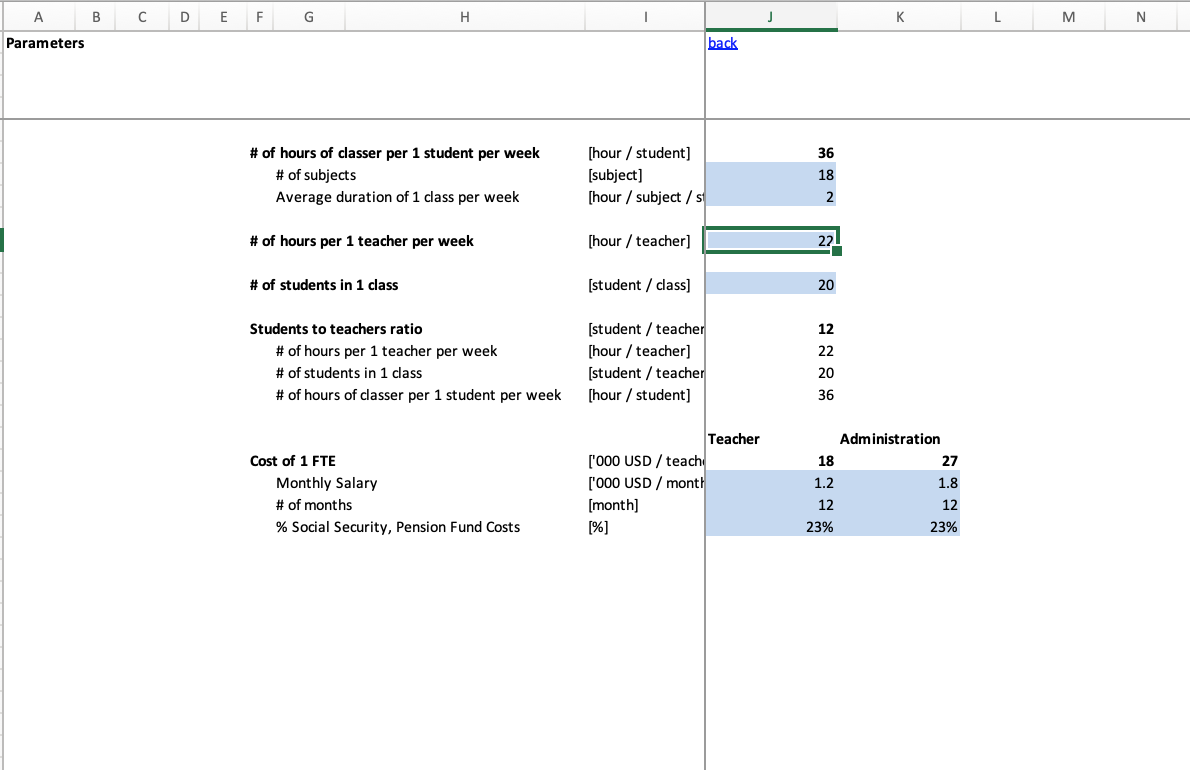
2. Teachers. In the sheet “Teachers” we model the number of teachers you will need, based on the number of students, and the ratio of students to teachers. The ratio you can change in the Sheet Parameters. In the sheet “Teachers” we also estimate the cost of labor related to Teachers
3. COGS. In the sheet COGS, we define the costs related to servicing kids like food, utilities, etc.
4. Sales & Margin. In the sheet “SalesBC”, we model revenues, gross margin, cost of acquisition, retention, logistics costs related to the basic activities (teaching). In the sheet “SalesAD” we have similar things estimated for additional activities like advertising, renting space of the school, etc.
5. Capex. Capex is calculated in sheet Capex, based on the number of customers we have to service. We have2 main types of Capex for Content: Acquisition Capex and Retention Capex. In a separate sheet (Depreciation) we model the Depreciation by cohorts and Net Value of Assets.
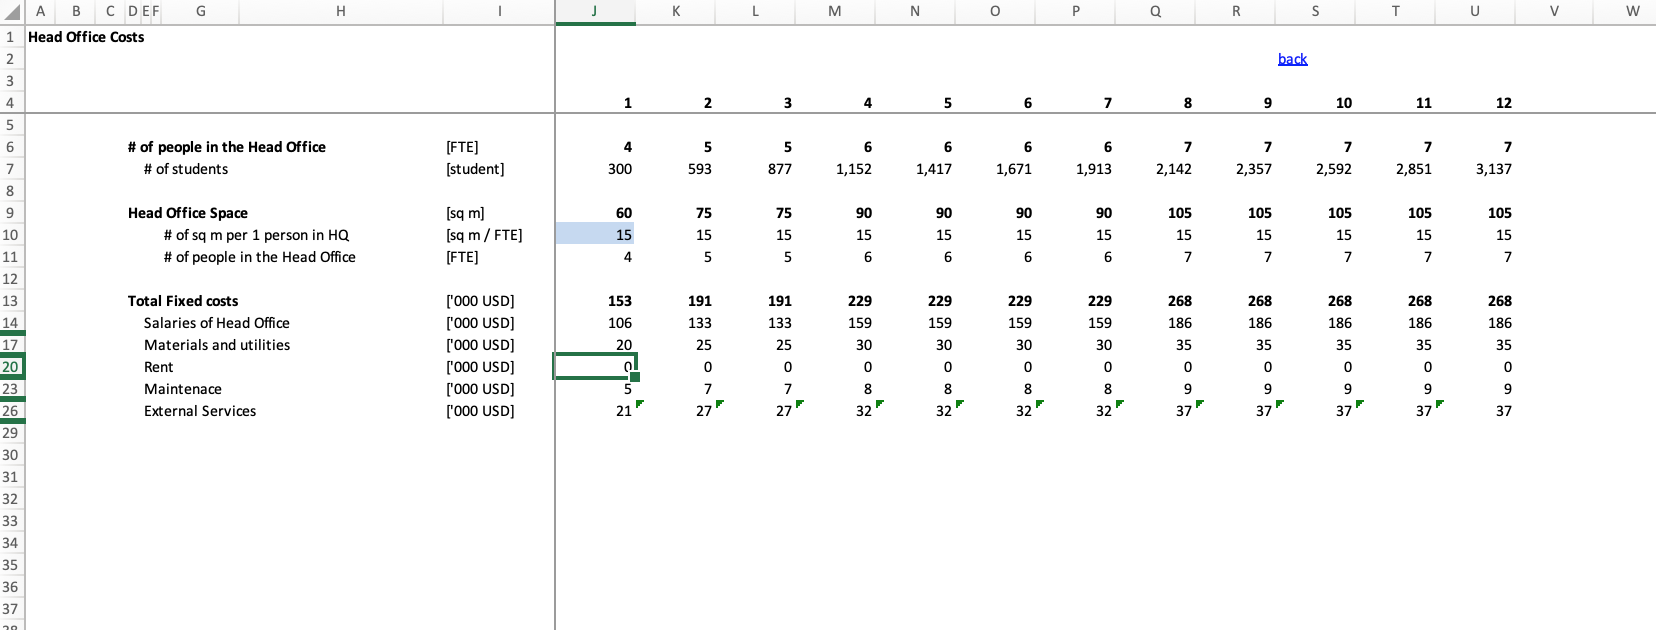
6. Head Office costs. These costs are calculated in the sheet HQ.
7. Profit and Loss statement. Based on data from previous sheets in the sheet P&L we generate the Profit and Loss statement.
8. Working Capital. Working Capital is calculated in the sheet Work Cap, based on sales and conversion periods assumed for inventory, receivables, and payables.
9. Debt. We assume that the growth will be partially financed by Debt. In this sheet, we calculate the Debt at the end of the year based on assumed loans that we take and repayment of the loans. We also calculate here the financial costs and profits.
10. Cash Flow. Finally, in the sheet CF, we calculate the cash flow based on data from previous sheets
School Financial Model in Excel
Schools are interesting businesses to model in Excel. Apart from the usual things like P&L, Cash Flows, you model also the number of teachers and additional revenues from other than tuition or subvention sources. In this model, you can see how you can model such businesses. This is an annual model. By altering the cells in blue you can adjust the model to your needs.
A few information about the model
1. Students. In sheet Students, we model the number of students based on churn rate and the number of customers acquired. We assume that it is a school that covers 8 years of education so the natural churn rate will be at least 12.5%
2. Teachers. In the sheet “Teachers” we model the number of teachers you will need, based on the number of students, and the ratio of students to teachers. The ratio you can change in the Sheet Parameters. In the sheet “Teachers” we also estimate the cost of labor related to Teachers
3. COGS. In the sheet COGS, we define the costs related to servicing kids like food, utilities, etc.
4. Sales & Margin. In the sheet “SalesBC”, we model revenues, gross margin, cost of acquisition, retention, logistics costs related to the basic activities (teaching). In the sheet “SalesAD” we have similar things estimated for additional activities like advertising, renting space of the school, etc.
5. Capex. Capex is calculated in sheet Capex, based on the number of customers we have to service. We have2 main types of Capex for Content: Acquisition Capex and Retention Capex. In a separate sheet (Depreciation) we model the Depreciation by cohorts and Net Value of Assets.
6. Head Office costs. These costs are calculated in the sheet HQ.
7. Profit and Loss statement. Based on data from previous sheets in the sheet P&L we generate the Profit and Loss statement.
8. Working Capital. Working Capital is calculated in the sheet Work Cap, based on sales and conversion periods assumed for inventory, receivables, and payables.
9. Debt. We assume that the growth will be partially financed by Debt. In this sheet, we calculate the Debt at the end of the year based on assumed loans that we take and repayment of the loans. We also calculate here the financial costs and profits.
10. Cash Flow. Finally, in the sheet CF, we calculate the cash flow based on data from previous sheets
This Best Practice includes
1 Excel model
