Originally published: 05/09/2022 07:54
Publication number: ELQ-72255-1
View all versions & Certificate
Publication number: ELQ-72255-1
View all versions & Certificate


0.0 / 5 (0 votes)
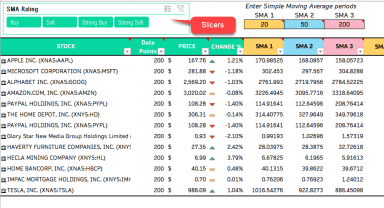
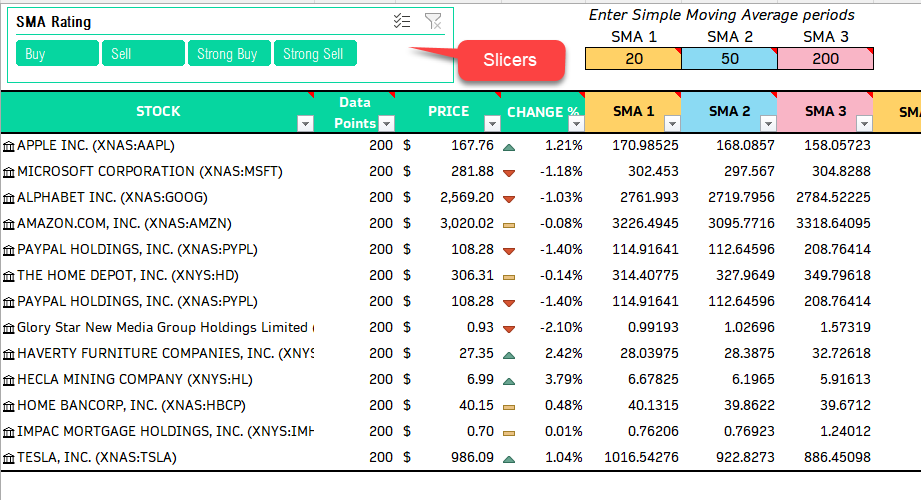
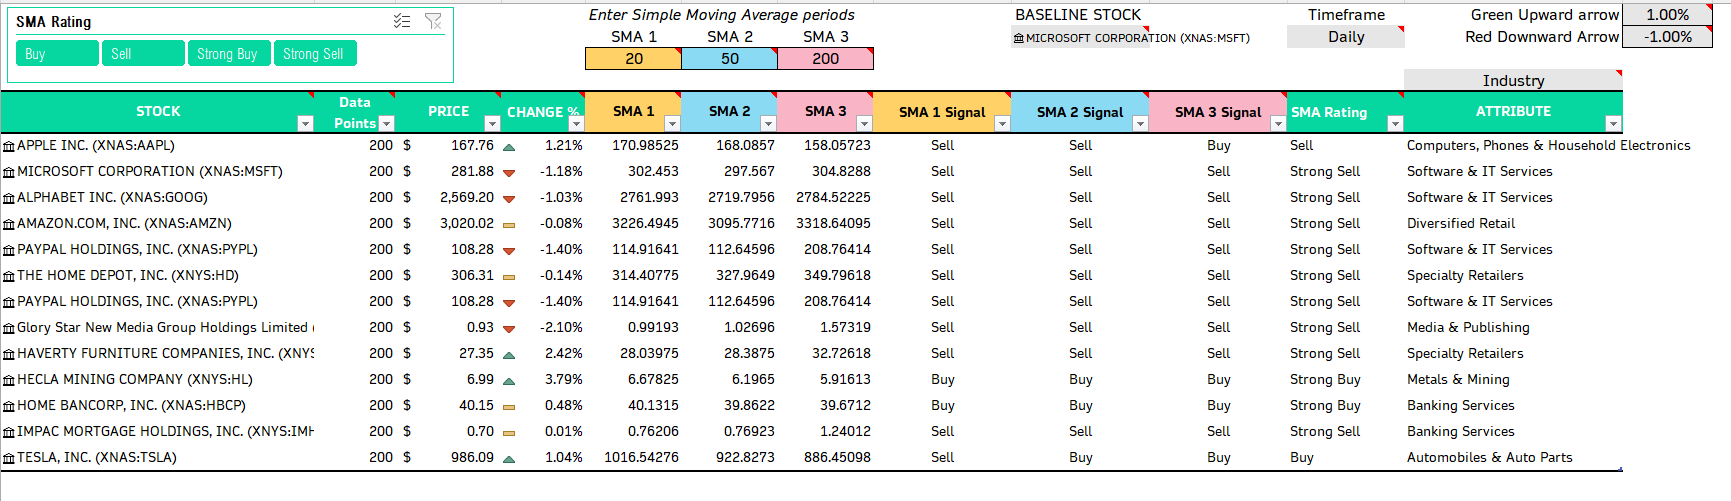
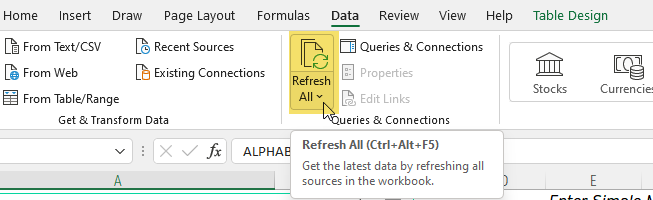
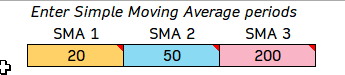
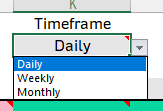
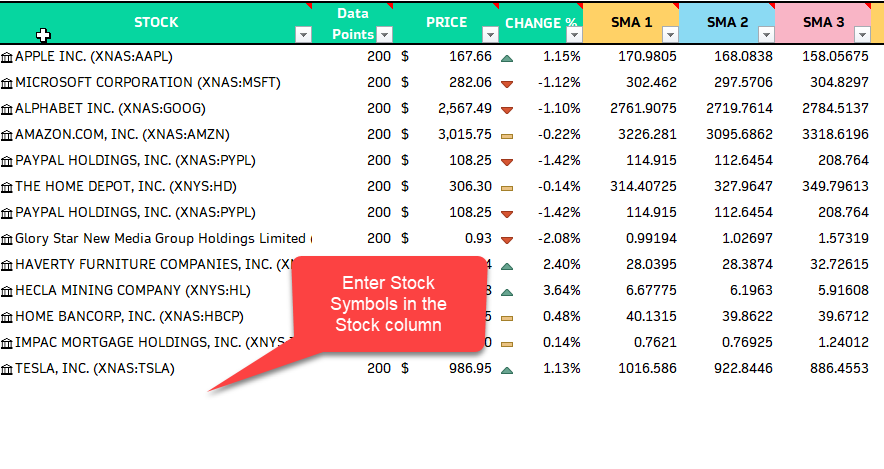
Simple Moving Average Stock Screener Excel Template
by Indzara
Version 1 (Original Version): 05/09/2022 07:54 GMT
Publication Number: ELQ-72255-1
