


Originally published: 02/05/2022 08:52
Publication number: ELQ-98785-1
View all versions & Certificate
Publication number: ELQ-98785-1
View all versions & Certificate

Detailed Leveraged Buyout (LBO) Financial Model Template and Overview Presentation
Detailed LBO financial model template and presentation
Description
This is a detailed and easy-to-use Leveraged Buyout (LBO) financial model. This is a modular financial model meaning that relevant calculations are separated into separate tabs that can be used to perform the LBO analysis for any company. More complex models at the most basic level are separated into 1) inputs; 2) calculations; and 3) outputs. In simplistic models, these items are often grouped into a single tab.
The model template does not overcomplicate the analysis by including too many inputs and assumptions, calculations and outputs, but rather focus on key inputs and assumptions required to derive the most relevant outputs (i.e. investor returns, credit metrics and acquisition structure).
Included is a financial model template and brief LBO overview presentation.
I have used the following structural approach for every model that I have built, which users have always found to be clean, practical, easy to follow, and user-friendly. Sections may vary somewhat depending on the complexity of the model but the basic layout remains the same.
The sections of this model template are as follows:
1. Title Page: A brief description of the model’s purpose. Contact information can also be included here.
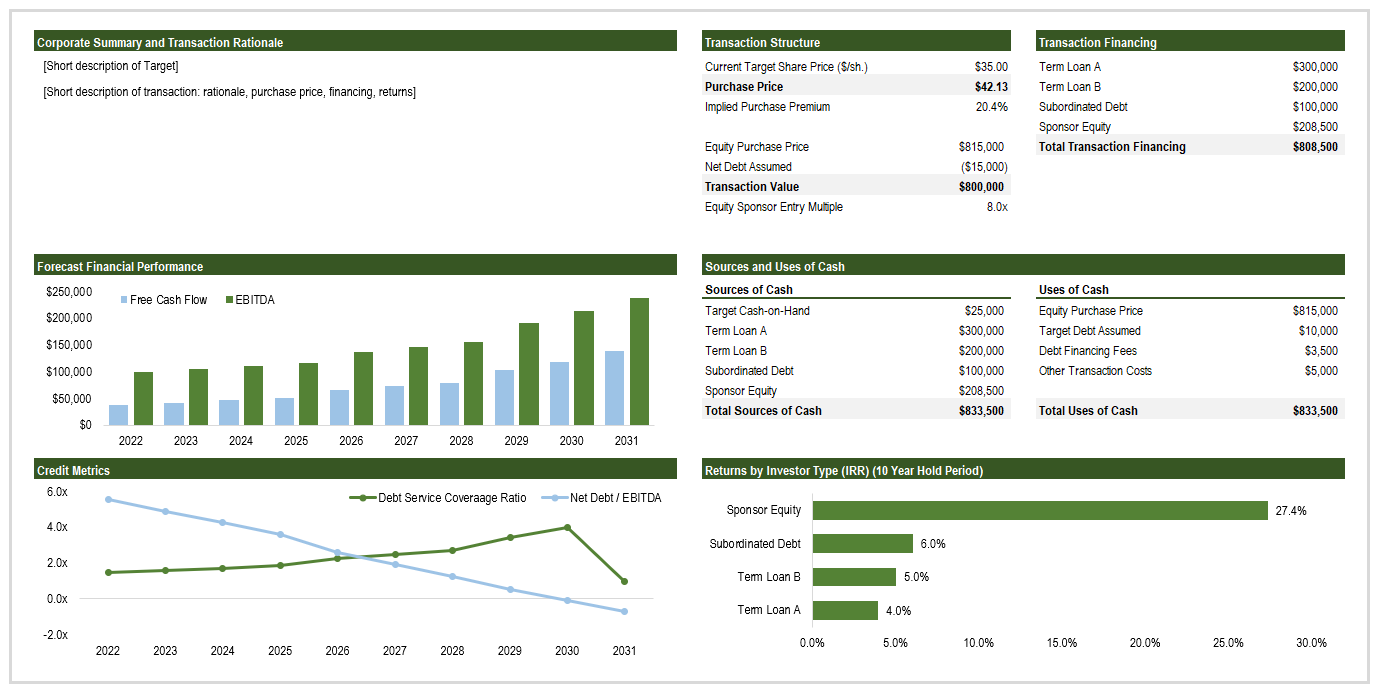
2. Summary Tab: Key outputs from the LBO analysis are presented here in graphical and tabular format, including forecast EBITDA and cash flow, credit metrics, transaction structure and financing, sources and uses of cash and investment returns.
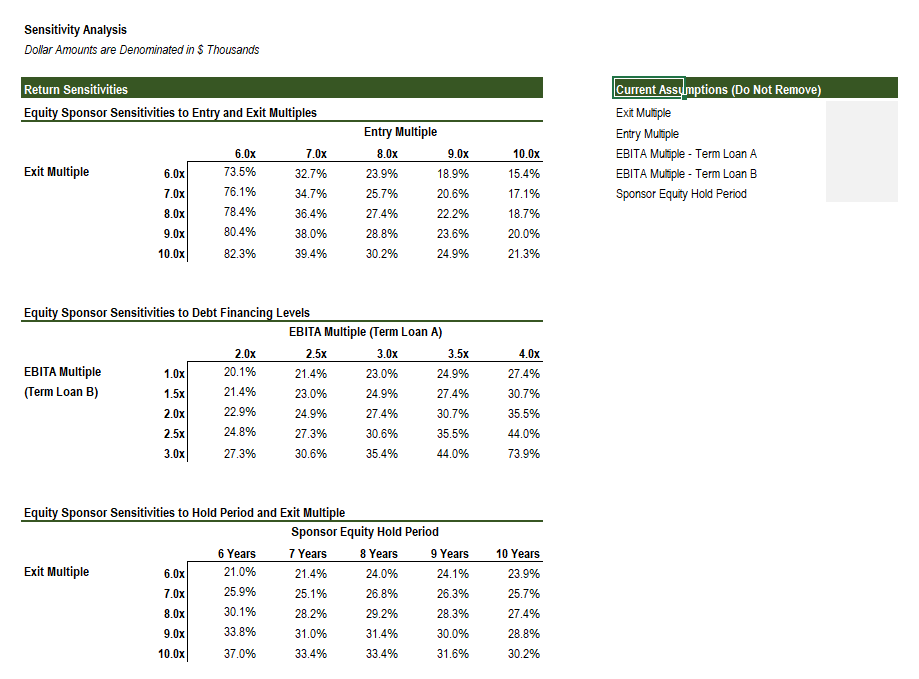
3. Sensitivities Tab: Equity return sensitivities that the user can rely on to test the robustness of the valuation.
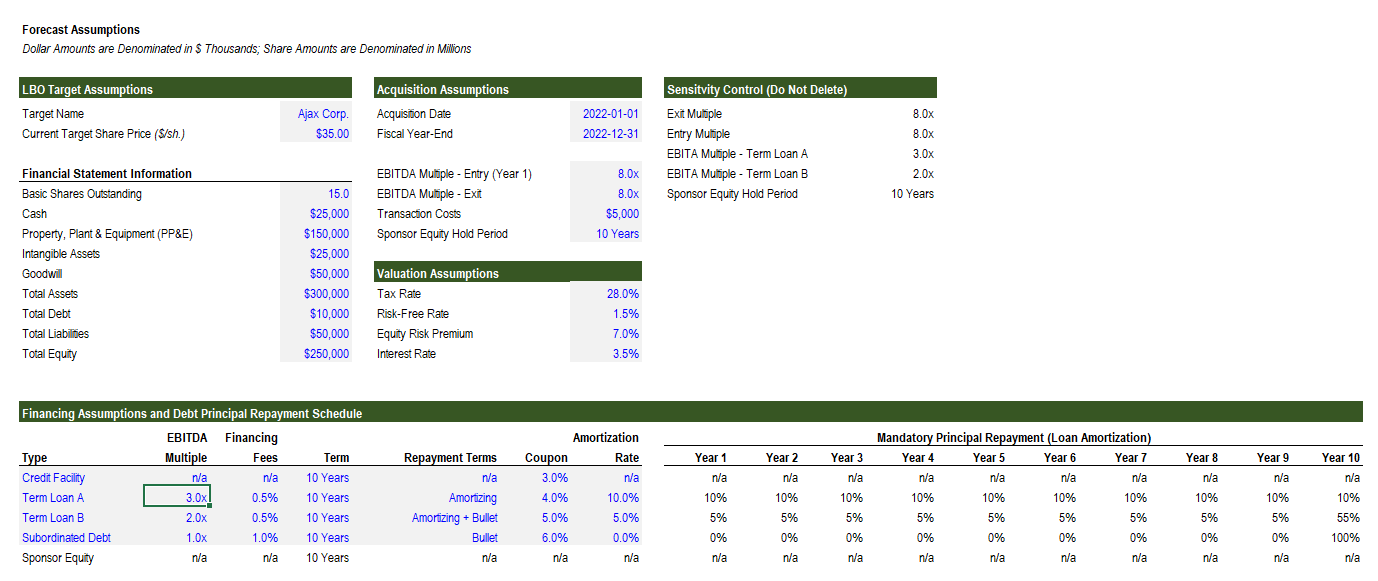
4. Assumptions Tab: Inputs and assumptions that drive the model, and include target financial information, acquisition and valuation assumptions and financing inputs.
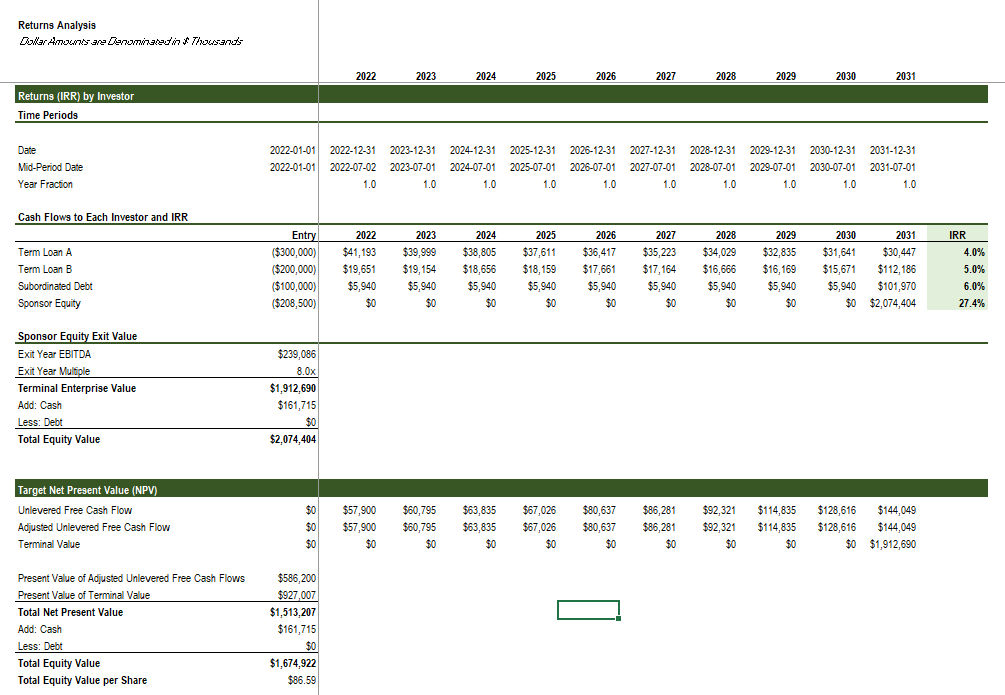
5. Returns Tab: A simple and easy-to-follow calculations of the returns by investor type (debt and equity investors) as well as DCF valuation of the target company.
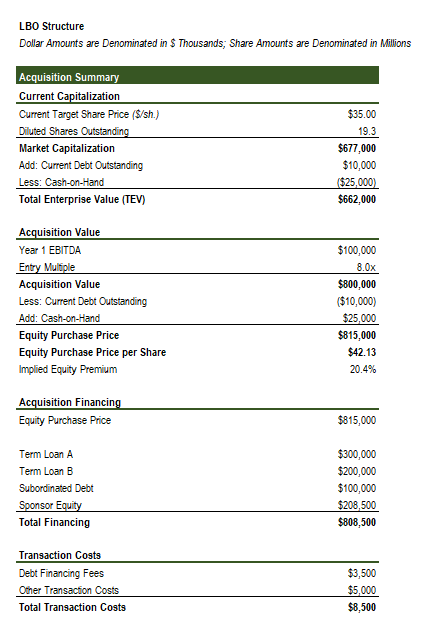
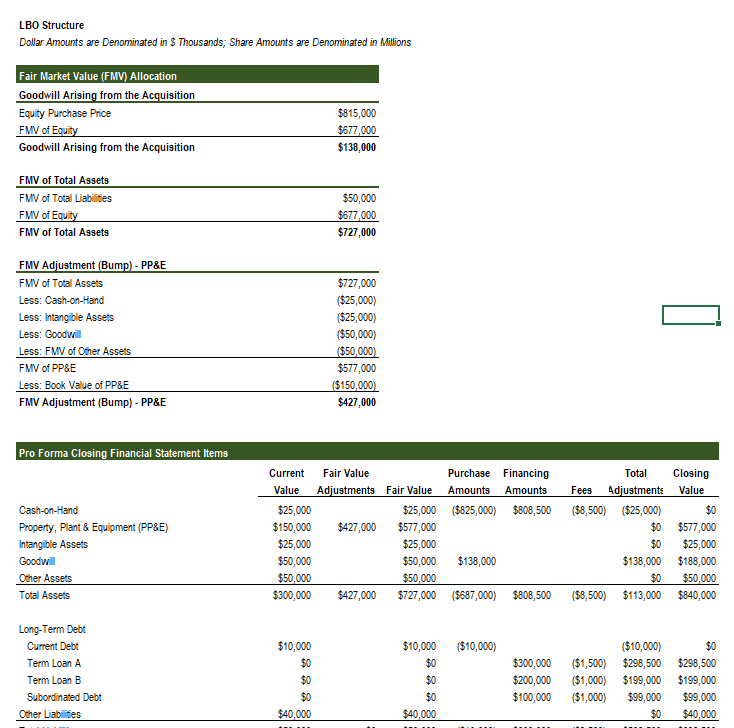
6. LBO Structure Tab: Detailed but easy-to-follow calculations of the acquisition structure, including equity purchase price, acquisition financing, transaction costs, the fair market value bump and goodwill arising from the acquisition and the key pro forma financial statement items at closing of the transaction.
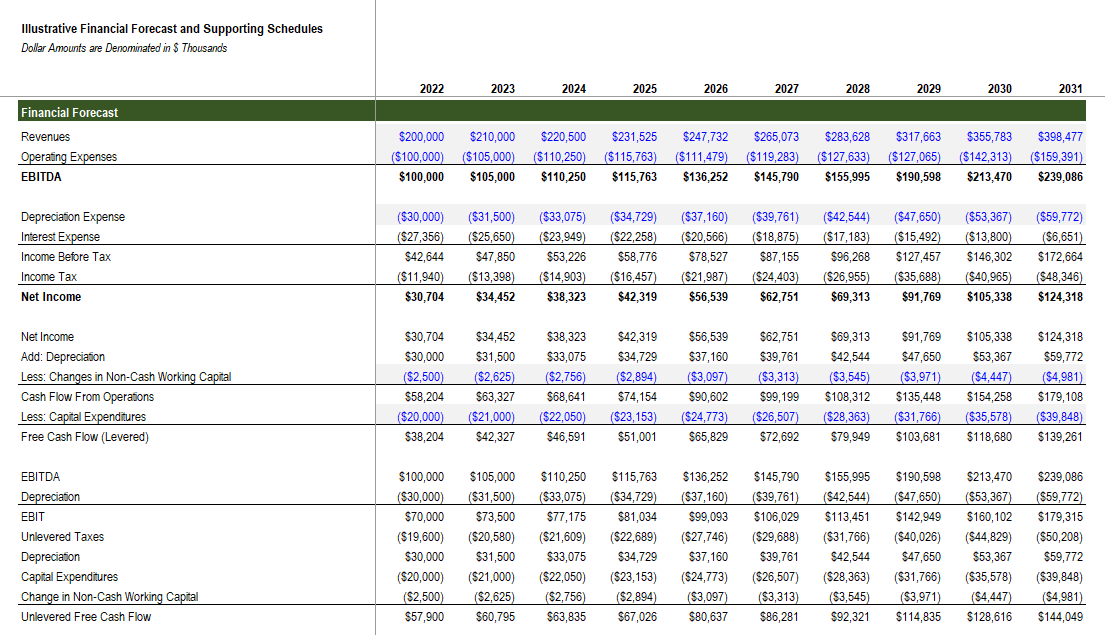
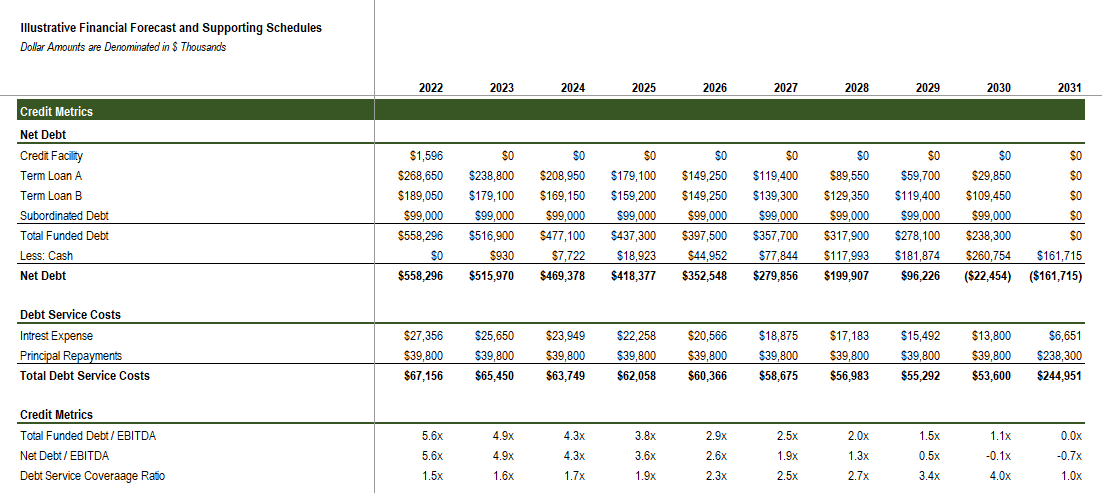
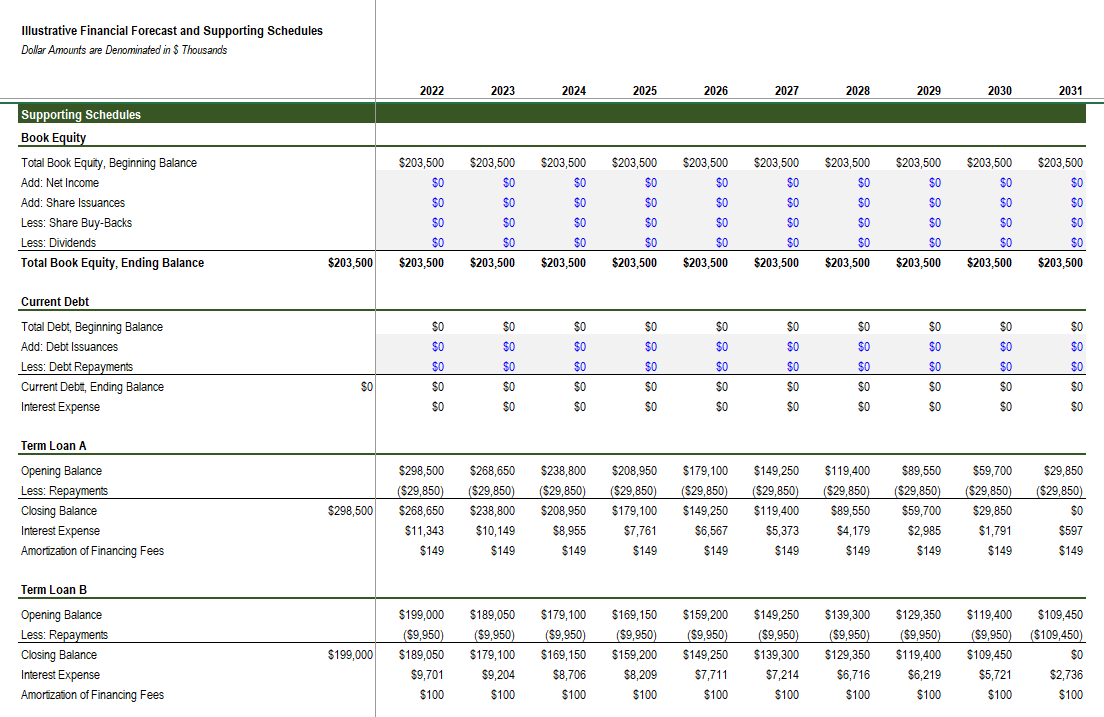
7. Financial Forecast Tab: Financial projections that drive the valuation. In this model, the forecast itself is illustrative only and can be replaced with the user’s own forecast. The most important items that are needed from any financial forecast for valuation purposes are: EBITDA, depreciation, interest expense, capital expenditures, and changes in non-cash working capital. Credit metrics and detailed debt amortization schedules are also provided here as supporting schedules.
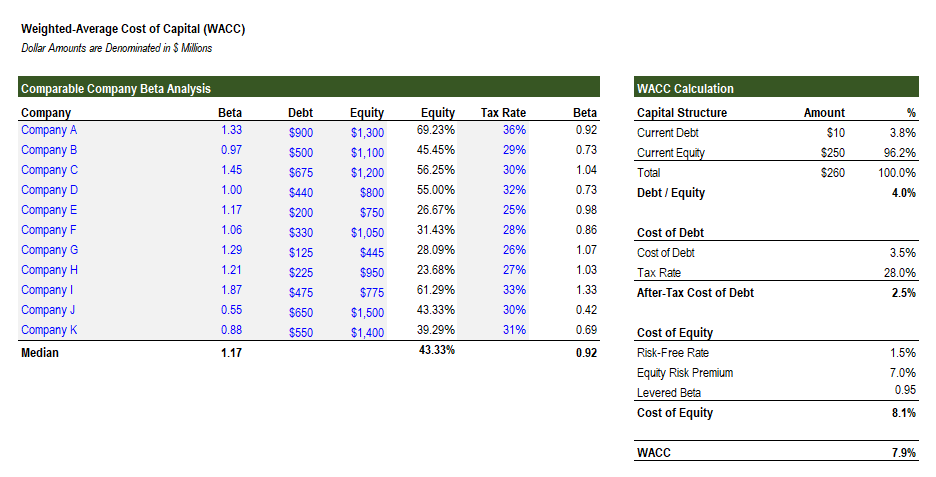
8. WACC Tab: The information in this tab is illustrative as well and should be replaced with actual comparable companies that are relevant to the user’s situation. The weighted-average cost of capital (WACC) is used as the discount rate in the DCF valuation.
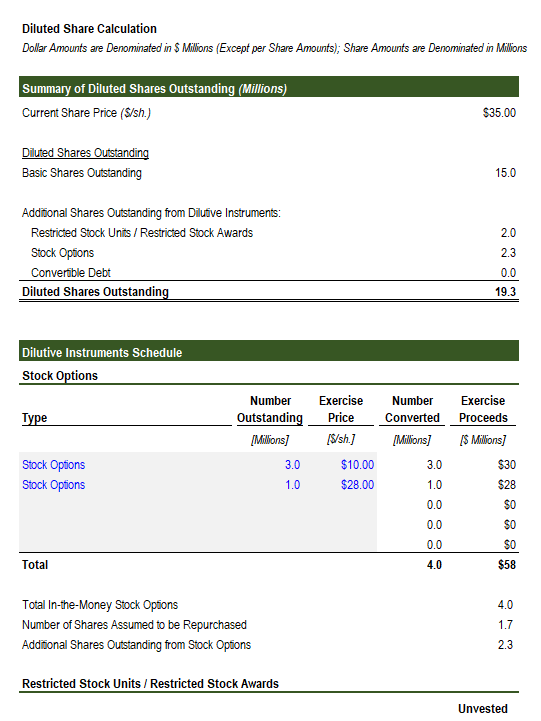
9. Diluted Securities Tab: Inputs to calculate the impact of potentially dilutive securities.
The model template utilizes 10 years for the forecast period.
Again, this is a detailed but user-friendly model that can be used to perform an LBO analysis for any company.
This is a detailed and easy-to-use Leveraged Buyout (LBO) financial model. This is a modular financial model meaning that relevant calculations are separated into separate tabs that can be used to perform the LBO analysis for any company. More complex models at the most basic level are separated into 1) inputs; 2) calculations; and 3) outputs. In simplistic models, these items are often grouped into a single tab.
The model template does not overcomplicate the analysis by including too many inputs and assumptions, calculations and outputs, but rather focus on key inputs and assumptions required to derive the most relevant outputs (i.e. investor returns, credit metrics and acquisition structure).
Included is a financial model template and brief LBO overview presentation.
I have used the following structural approach for every model that I have built, which users have always found to be clean, practical, easy to follow, and user-friendly. Sections may vary somewhat depending on the complexity of the model but the basic layout remains the same.
The sections of this model template are as follows:
1. Title Page: A brief description of the model’s purpose. Contact information can also be included here.
2. Summary Tab: Key outputs from the LBO analysis are presented here in graphical and tabular format, including forecast EBITDA and cash flow, credit metrics, transaction structure and financing, sources and uses of cash and investment returns.
3. Sensitivities Tab: Equity return sensitivities that the user can rely on to test the robustness of the valuation.
4. Assumptions Tab: Inputs and assumptions that drive the model, and include target financial information, acquisition and valuation assumptions and financing inputs.
5. Returns Tab: A simple and easy-to-follow calculations of the returns by investor type (debt and equity investors) as well as DCF valuation of the target company.
6. LBO Structure Tab: Detailed but easy-to-follow calculations of the acquisition structure, including equity purchase price, acquisition financing, transaction costs, the fair market value bump and goodwill arising from the acquisition and the key pro forma financial statement items at closing of the transaction.
7. Financial Forecast Tab: Financial projections that drive the valuation. In this model, the forecast itself is illustrative only and can be replaced with the user’s own forecast. The most important items that are needed from any financial forecast for valuation purposes are: EBITDA, depreciation, interest expense, capital expenditures, and changes in non-cash working capital. Credit metrics and detailed debt amortization schedules are also provided here as supporting schedules.
8. WACC Tab: The information in this tab is illustrative as well and should be replaced with actual comparable companies that are relevant to the user’s situation. The weighted-average cost of capital (WACC) is used as the discount rate in the DCF valuation.
9. Diluted Securities Tab: Inputs to calculate the impact of potentially dilutive securities.
The model template utilizes 10 years for the forecast period.
Again, this is a detailed but user-friendly model that can be used to perform an LBO analysis for any company.
This Best Practice includes
Excel template; PDF presentation
