
Originally published: 13/03/2023 11:02
Publication number: ELQ-74370-1
View all versions & Certificate
Publication number: ELQ-74370-1
View all versions & Certificate

RSI (Relative Strength Index) Indicator Google Sheets Template
This template will help you create the RSI indicator automatically and calculate the trading signals instantly for any stock.
Description
RSI (Relative Strength Index) technical indicator is used to analyze stock performance.
This is one of the popular technical indicators used by traders, which a momentum-based oscillator created by J. Welles Wilder Jr.
How to calculate RSI(Relative Strength Index)?
Due to the nature of the calculation, we start with a slightly different formula for the first period.
Let’s say we use a 14 day RSI. On Day 14 of our data, we can calculate the first RSI.
Calculations for the first RSI – On Day 14
1. On Day 14, we calculate Avg. Gain of 14 days using a simple average of gain on each of the 14 days. A gain is measured as Closing Price – Closing Price on Previous Day. If there is no gain, it is measured as 0 gain.
2. Similarly, on Day 14, we calculate Avg. Loss of 14 days using a simple average of gain on each of the 14 days. A gain is measured as Closing Price – Closing Price on Previous Day. If there is no gain, it is measured as 0 gain.
3. Relative Strength RS = Avg Gain/Avg Loss
4. Relative Strength RSI = 100 – 100/(1+RS)
Calculations for all subsequent RSIs – from Day 15
On Subsequent days (from Day 15), the calculations for Avg. Gain and Avg. Loss change as below.
1. Avg. Gain is measured as (Prev Day Avg Gain * 13) + Current Day Gain
2. Avg. Loss is measured as (Prev Day Avg Loss * 13) + Current Day Loss
3. Relative Strength RS = Avg Gain/Avg Loss
4. Relative Strength RSI = 100 – 100/(1+RS)
Note: Due to the nature of the calculations, depending on your starting point, the RSI values may differ slightly. For example, if you start with a1 year historical data for a stock, your RSI may be different from your RSI if you start with 6 Month historical data.
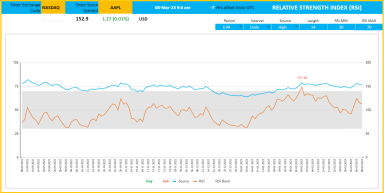
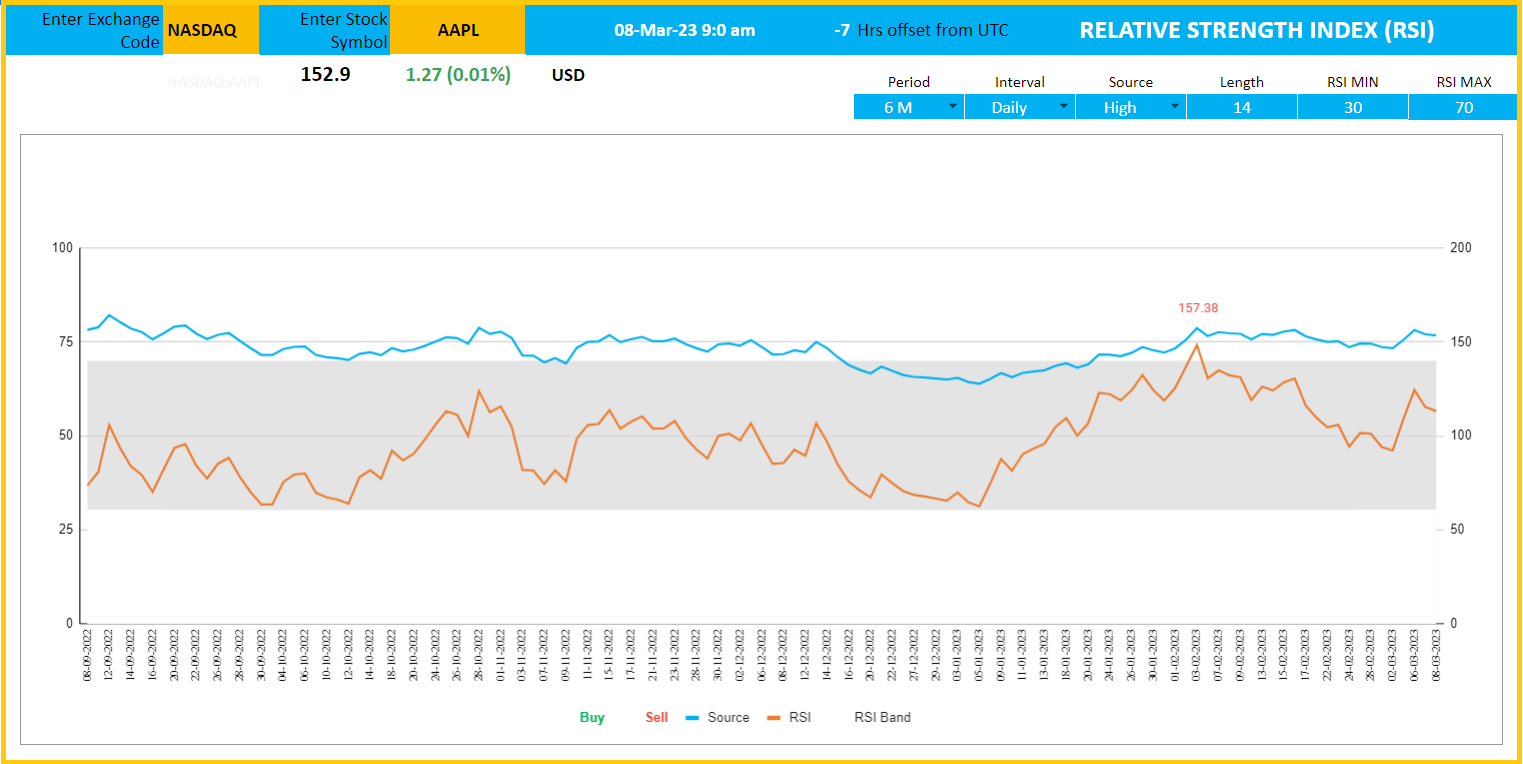
The RSI Chart
The blue line indicates the closing price and the Orange line the RSI. The shaded area represents the RSI band from the minimum threshold to the maximum threshold.
Type in a stock exchange code (like NASDAQ or NYSE) and the stock symbol (example: “AAPL” for Apple Inc.)
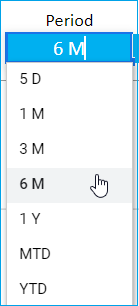
Period
The template can pull up to 1 year of price history by default. You can choose how much history to display on the chart easily using the check box.
Interval
The template allows price history at 2 different intervals: Daily and Weekly.
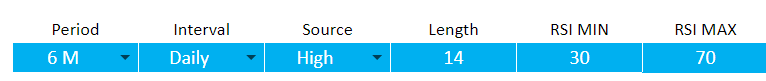
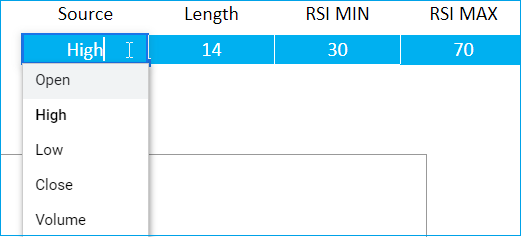
Input Parameters:
i. Source: Closing price is the one that is used for calculations typically. However, you can choose from Open, High, Low, Close or Volume.
ii. Length: You can type in a length in periods. The commonly used is 14.
iii. RSI Min: This is the minimum RSI threshold to generate signals. The commonly used is 30.
iv. RSI Max: This is the maximum RSI threshold to generate signals. The commonly used is 70.
The chart will update automatically based on all the above inputs.
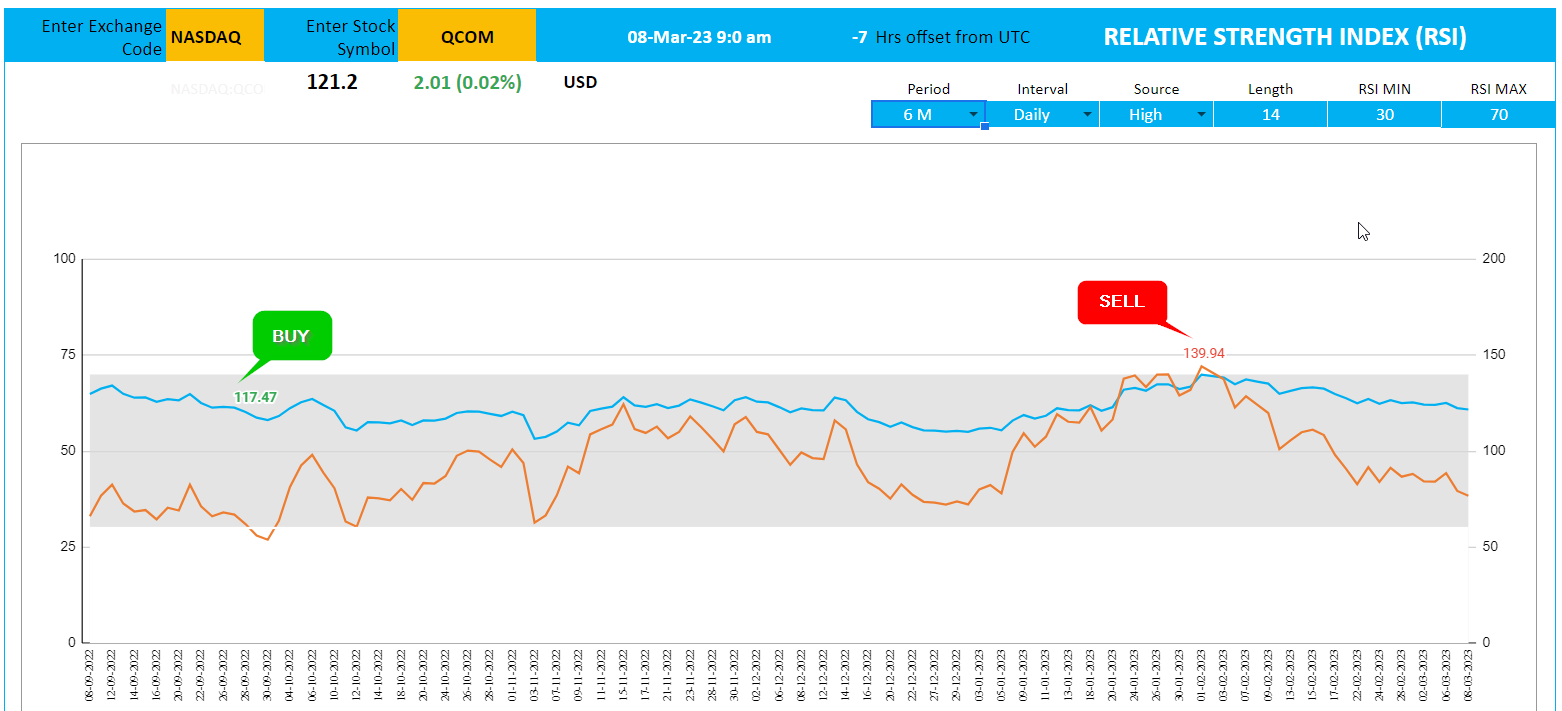
Signals
The template shows two types of signals (Buy, Sell) on the chart.
The following rule generates the signals.
Buy when the RSI drops below the RSI Minimum threshold (30 by default)
Sell when the RSI exceeds above the RSI Maximum threshold (70 by default)
Time Zone
On the top right you can see the maximum of the last trade time of these currencies.
The default time that Microsoft provides is UTC. The offset is set to -7 hrs, to convert to pacific time zone.
You can modify this if you need the time in a different time zone.
RSI (Relative Strength Index) technical indicator is used to analyze stock performance.
This is one of the popular technical indicators used by traders, which a momentum-based oscillator created by J. Welles Wilder Jr.
How to calculate RSI(Relative Strength Index)?
Due to the nature of the calculation, we start with a slightly different formula for the first period.
Let’s say we use a 14 day RSI. On Day 14 of our data, we can calculate the first RSI.
Calculations for the first RSI – On Day 14
1. On Day 14, we calculate Avg. Gain of 14 days using a simple average of gain on each of the 14 days. A gain is measured as Closing Price – Closing Price on Previous Day. If there is no gain, it is measured as 0 gain.
2. Similarly, on Day 14, we calculate Avg. Loss of 14 days using a simple average of gain on each of the 14 days. A gain is measured as Closing Price – Closing Price on Previous Day. If there is no gain, it is measured as 0 gain.
3. Relative Strength RS = Avg Gain/Avg Loss
4. Relative Strength RSI = 100 – 100/(1+RS)
Calculations for all subsequent RSIs – from Day 15
On Subsequent days (from Day 15), the calculations for Avg. Gain and Avg. Loss change as below.
1. Avg. Gain is measured as (Prev Day Avg Gain * 13) + Current Day Gain
2. Avg. Loss is measured as (Prev Day Avg Loss * 13) + Current Day Loss
3. Relative Strength RS = Avg Gain/Avg Loss
4. Relative Strength RSI = 100 – 100/(1+RS)
Note: Due to the nature of the calculations, depending on your starting point, the RSI values may differ slightly. For example, if you start with a1 year historical data for a stock, your RSI may be different from your RSI if you start with 6 Month historical data.
The RSI Chart
The blue line indicates the closing price and the Orange line the RSI. The shaded area represents the RSI band from the minimum threshold to the maximum threshold.
Type in a stock exchange code (like NASDAQ or NYSE) and the stock symbol (example: “AAPL” for Apple Inc.)
Period
The template can pull up to 1 year of price history by default. You can choose how much history to display on the chart easily using the check box.
Interval
The template allows price history at 2 different intervals: Daily and Weekly.
Input Parameters:
i. Source: Closing price is the one that is used for calculations typically. However, you can choose from Open, High, Low, Close or Volume.
ii. Length: You can type in a length in periods. The commonly used is 14.
iii. RSI Min: This is the minimum RSI threshold to generate signals. The commonly used is 30.
iv. RSI Max: This is the maximum RSI threshold to generate signals. The commonly used is 70.
The chart will update automatically based on all the above inputs.
Signals
The template shows two types of signals (Buy, Sell) on the chart.
The following rule generates the signals.
Buy when the RSI drops below the RSI Minimum threshold (30 by default)
Sell when the RSI exceeds above the RSI Maximum threshold (70 by default)
Time Zone
On the top right you can see the maximum of the last trade time of these currencies.
The default time that Microsoft provides is UTC. The offset is set to -7 hrs, to convert to pacific time zone.
You can modify this if you need the time in a different time zone.
This Best Practice includes
1 PDF File with link to download your copy of the Google Sheet Template
