

Originally published: 26/11/2024 10:44
Publication number: ELQ-71923-1
View all versions & Certificate
Publication number: ELQ-71923-1
View all versions & Certificate

Petrochemical Engineering Company Financial Model
This is a 5-year 3 Statement financial model for a Petrochemical Engineering Company that involves incorporating key elements from its business operations.
AllFinancialModels offer a curated selection of high-quality yet financial model templates designed to support a wide range of business needs.Follow
petrochemical engineeringengineeringfinancial modeloil and gasfinance modelpetrochemicalspetroleum engineeringpetroleum distillateshydrocarbon explorationexcel
Description
This is a financial model for a Petrochemical Engineering Company that involves incorporating key elements from its business operations, segmented into different services. Below is a detailed structure for the financial model, with considerations for an Income Statement, Cash Flow Statement, and Balance Sheet, along with revenue and expense breakdowns for the specified service areas:
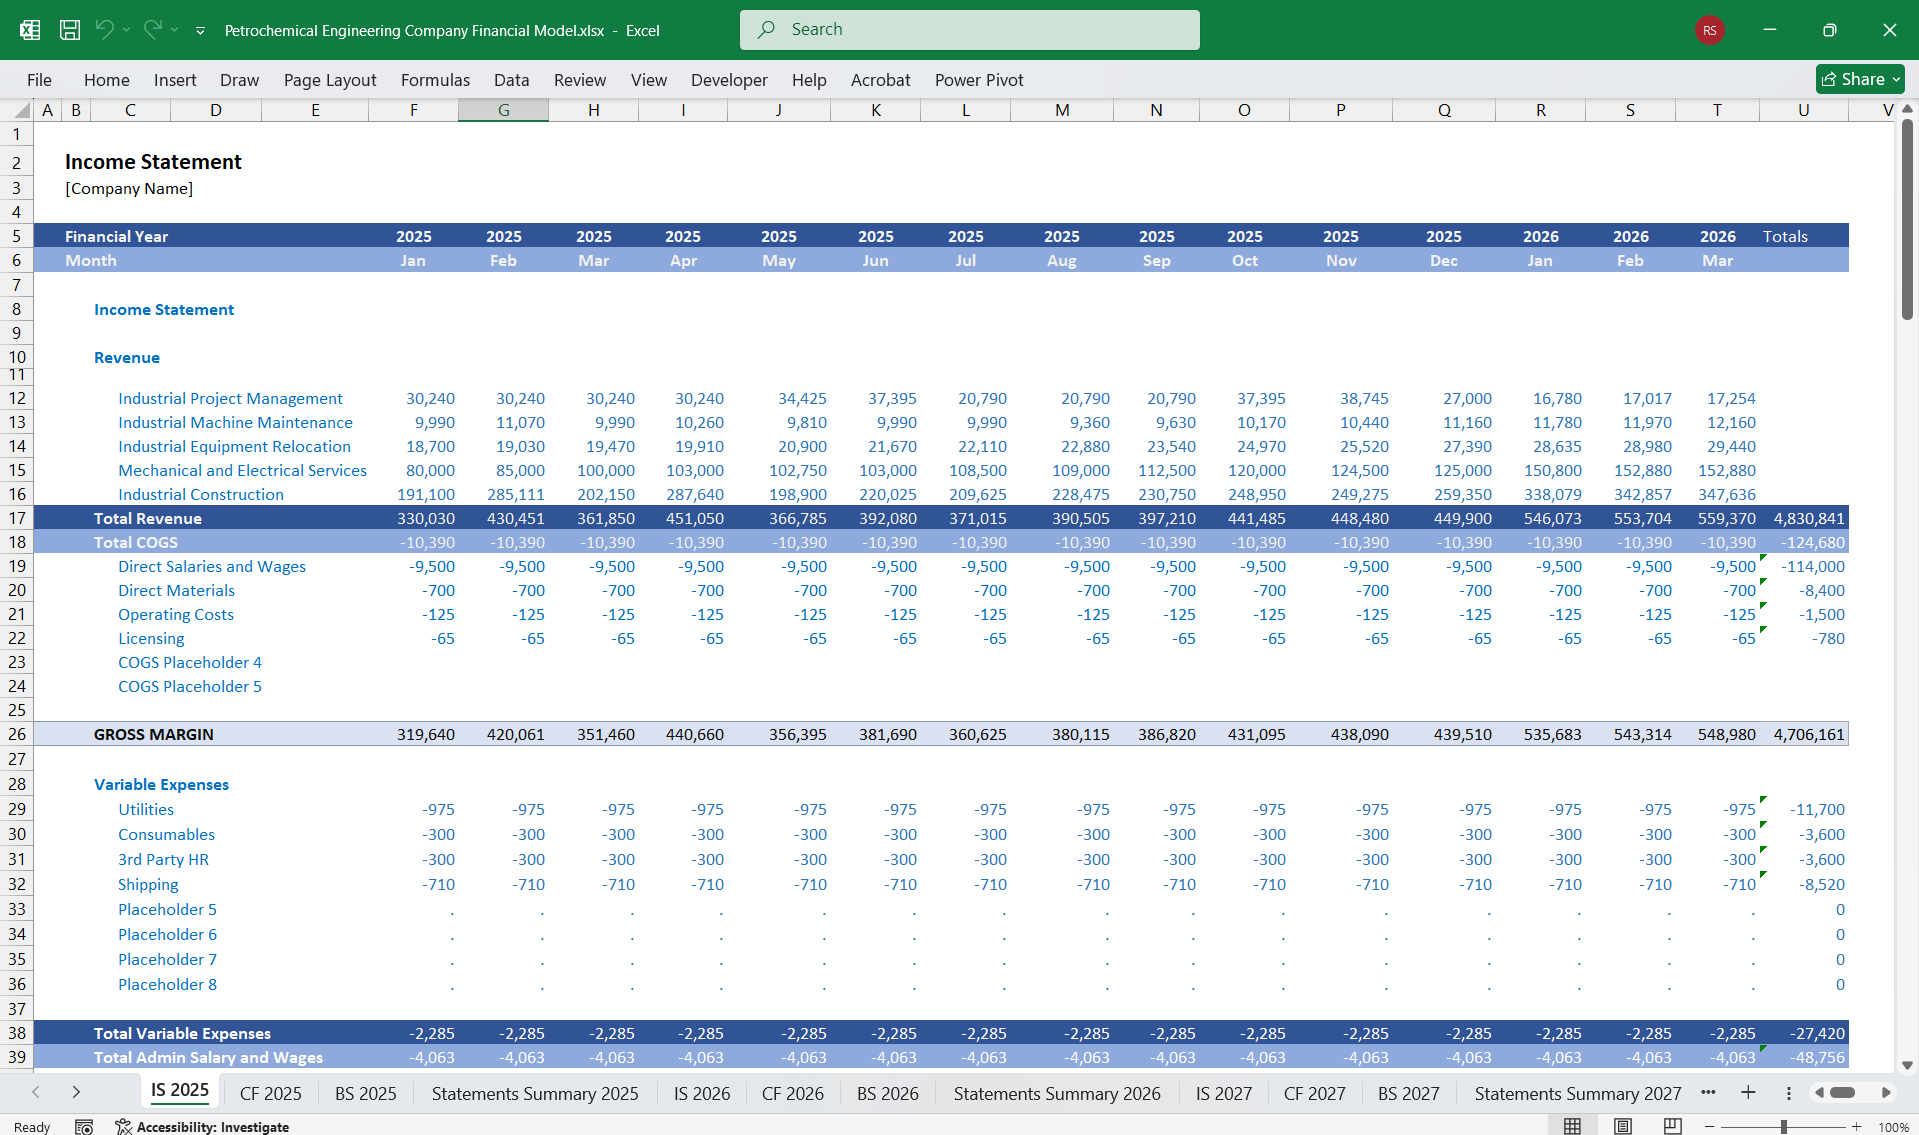
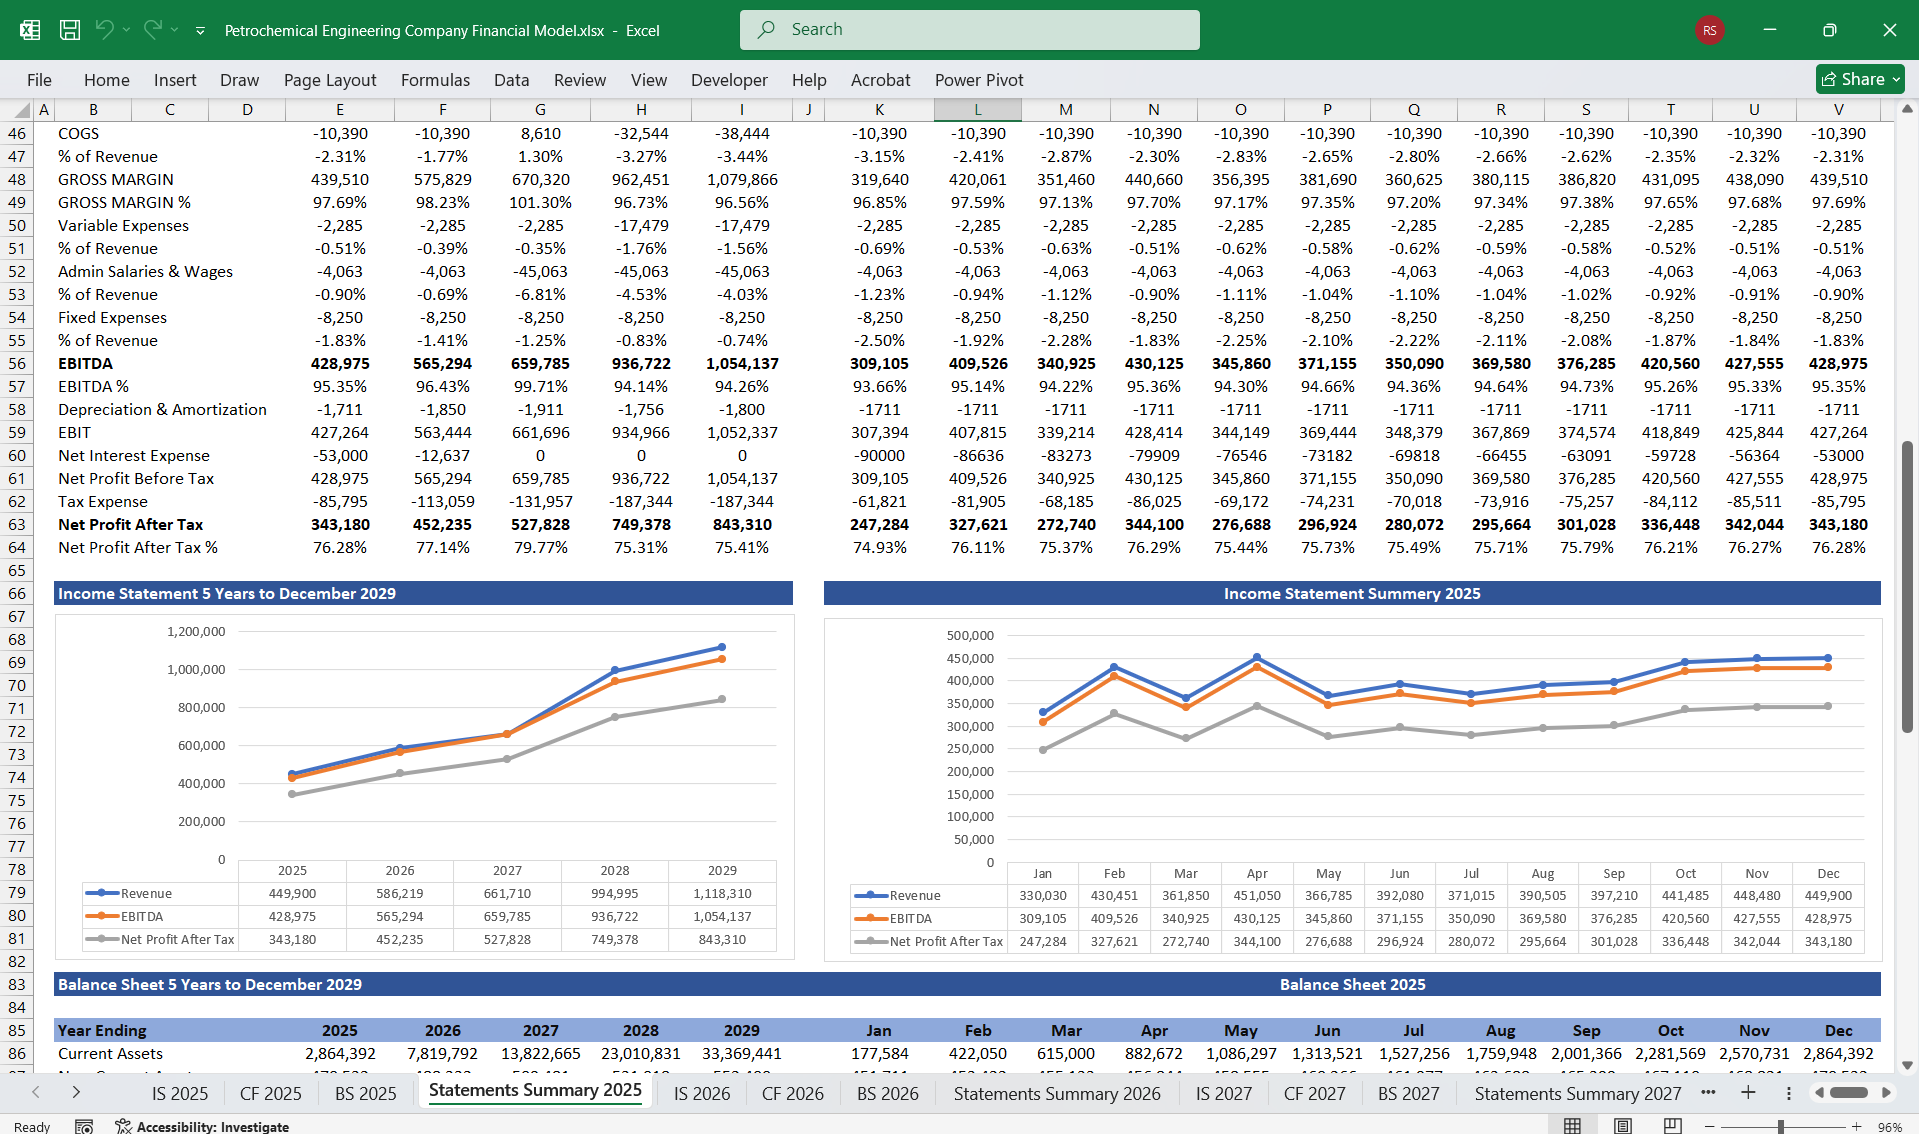
1. Income StatementThe Income Statement captures revenues and expenses to calculate profitability.
Revenue BreakdownInclude income streams from the following services:
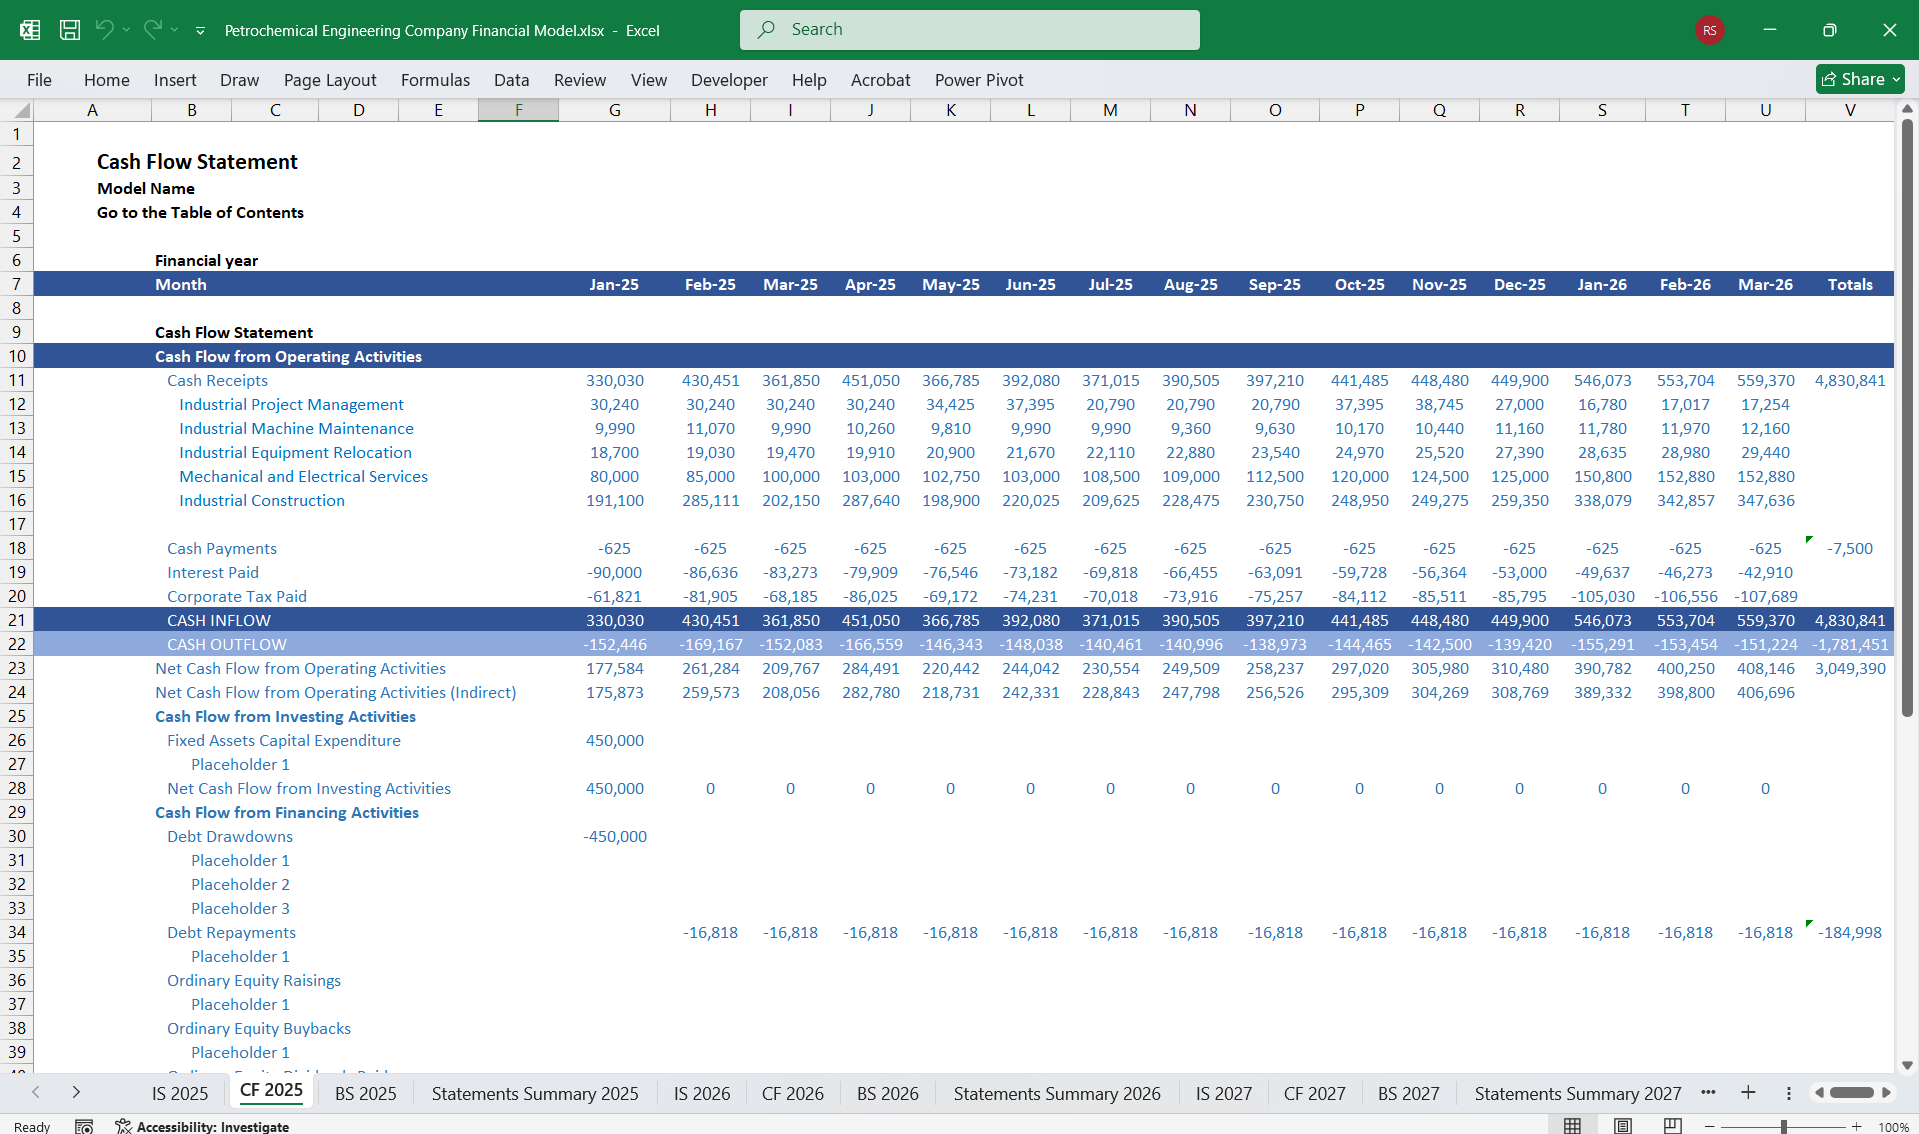
Operating Activities
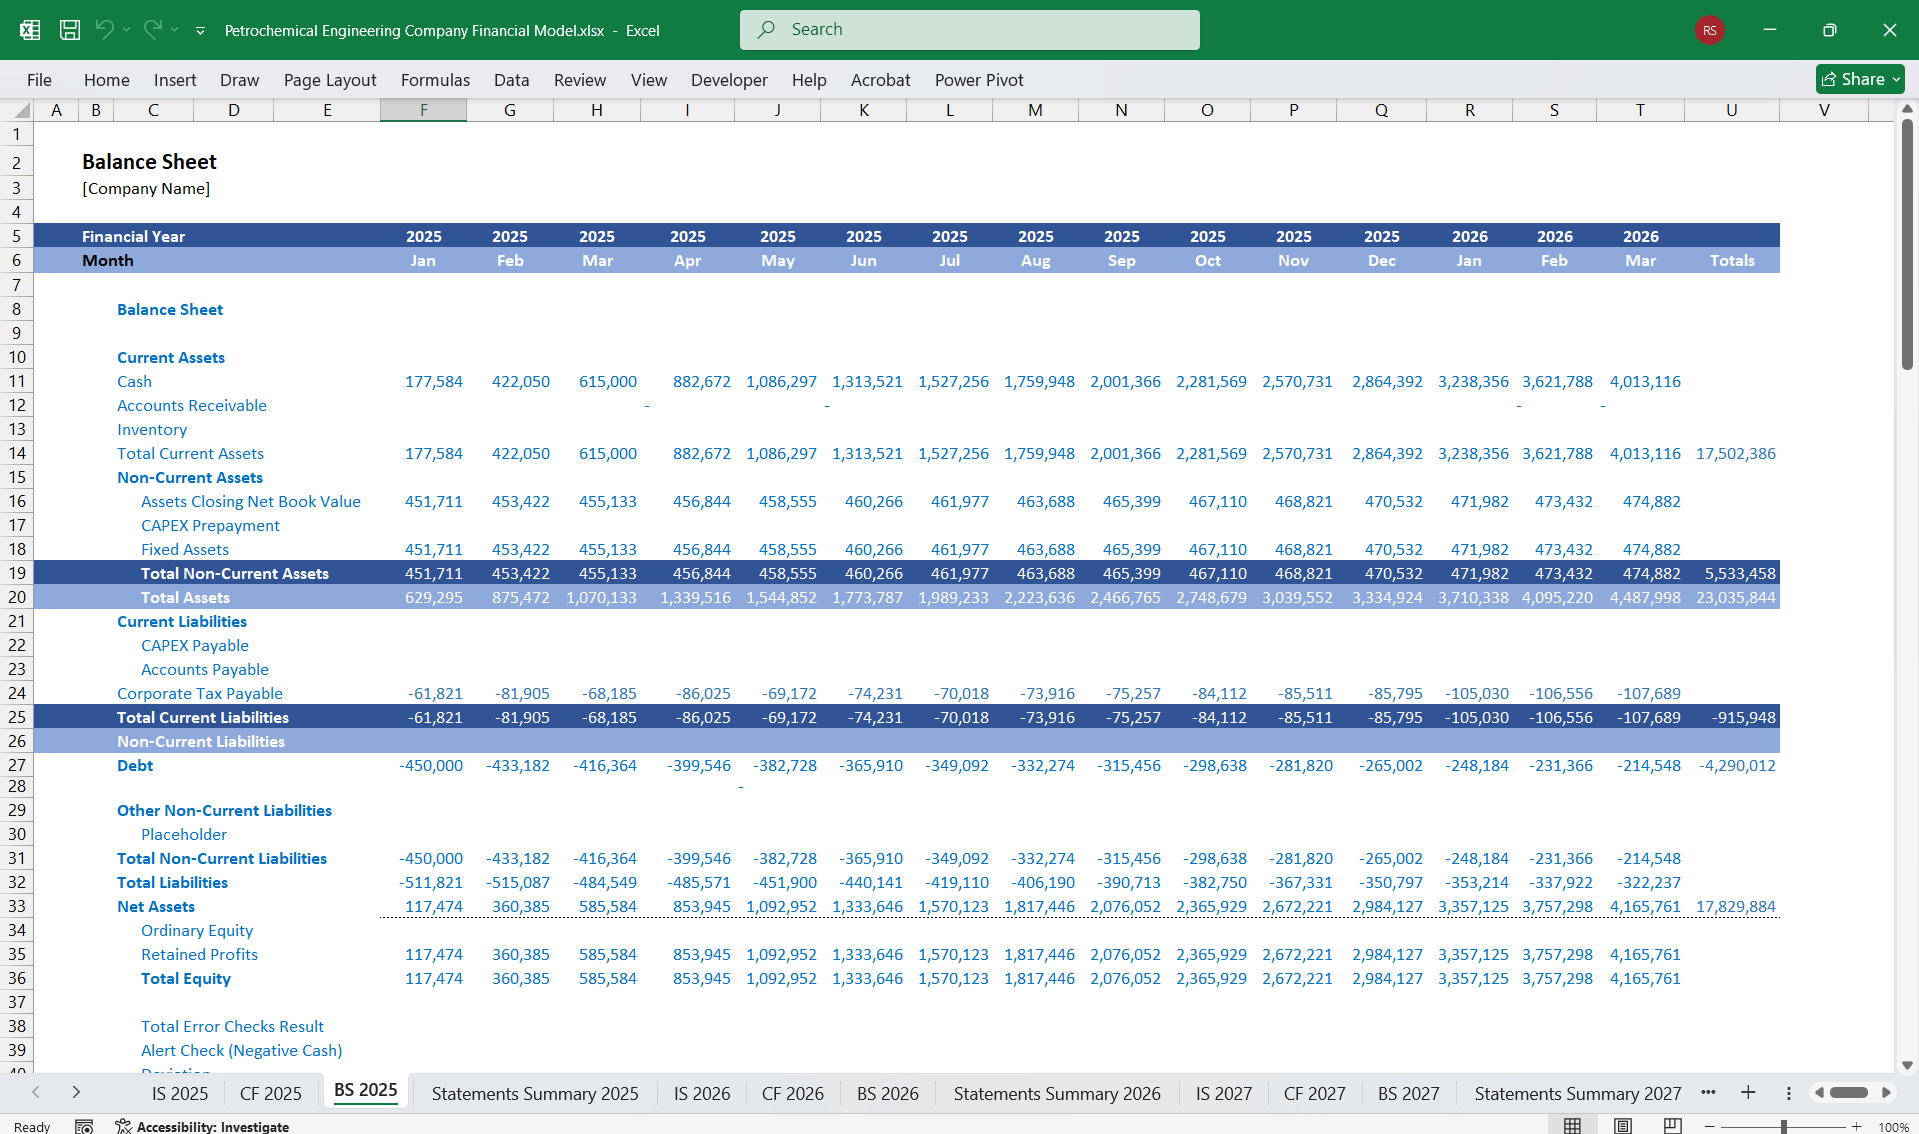
3. Balance SheetThe Balance Sheet provides a snapshot of assets, liabilities, and equity.
Assets
This is a financial model for a Petrochemical Engineering Company that involves incorporating key elements from its business operations, segmented into different services. Below is a detailed structure for the financial model, with considerations for an Income Statement, Cash Flow Statement, and Balance Sheet, along with revenue and expense breakdowns for the specified service areas:
1. Income StatementThe Income Statement captures revenues and expenses to calculate profitability.
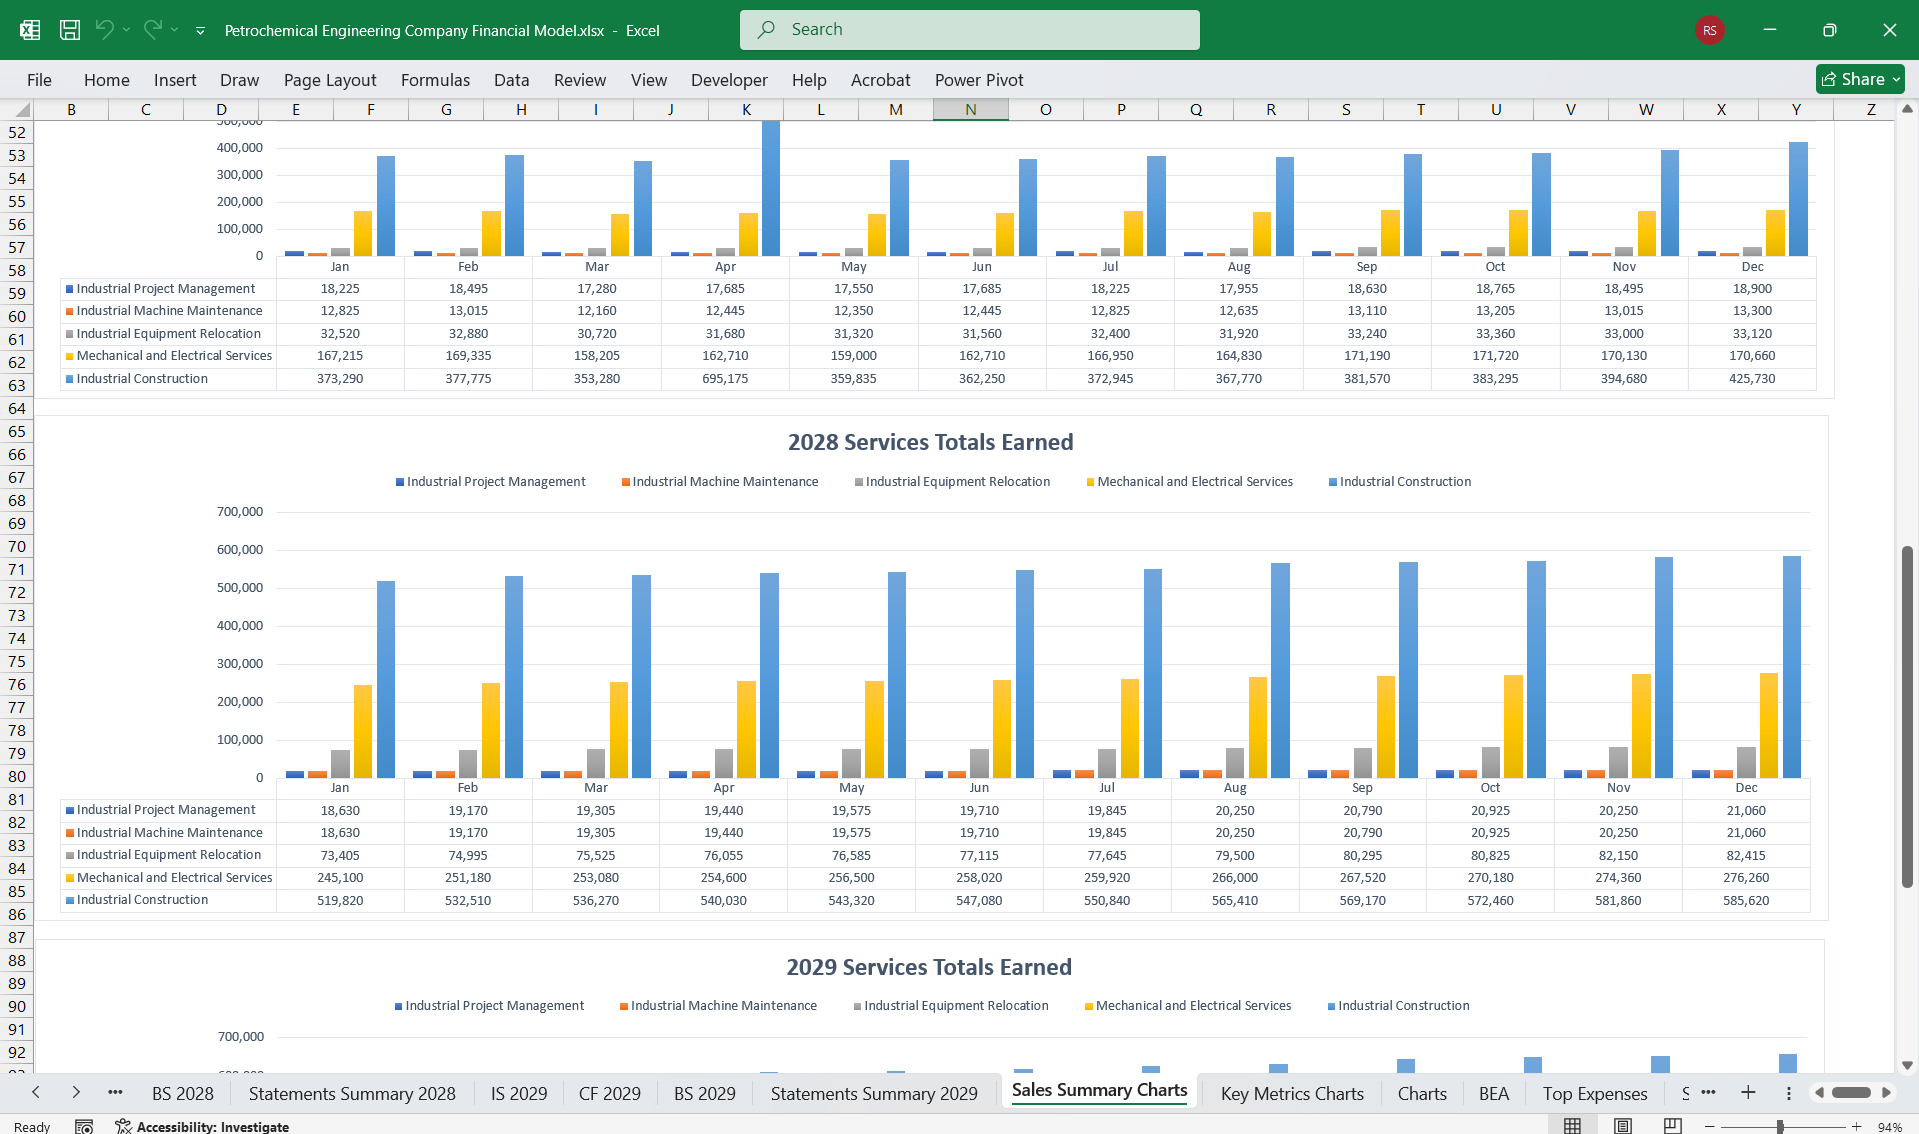
Revenue BreakdownInclude income streams from the following services:
- Industrial Project Management:
- Revenue from consulting, planning, and oversight of projects.
- Potential for recurring revenue if long-term contracts exist.
- Industrial Machine Maintenance:
- Service charges for regular maintenance contracts.
- Emergency maintenance or repairs at higher margins.
- Industrial Equipment Relocation:
- Income from logistical operations for moving equipment between facilities.
- Specialized fees for handling hazardous or oversized equipment.
- Mechanical and Electrical Services:
- Revenue from electrical installations, mechanical repairs, and upgrades.
- Industrial Construction:
- Contractual income from design-build projects.
- Progress payments on large-scale industrial builds.
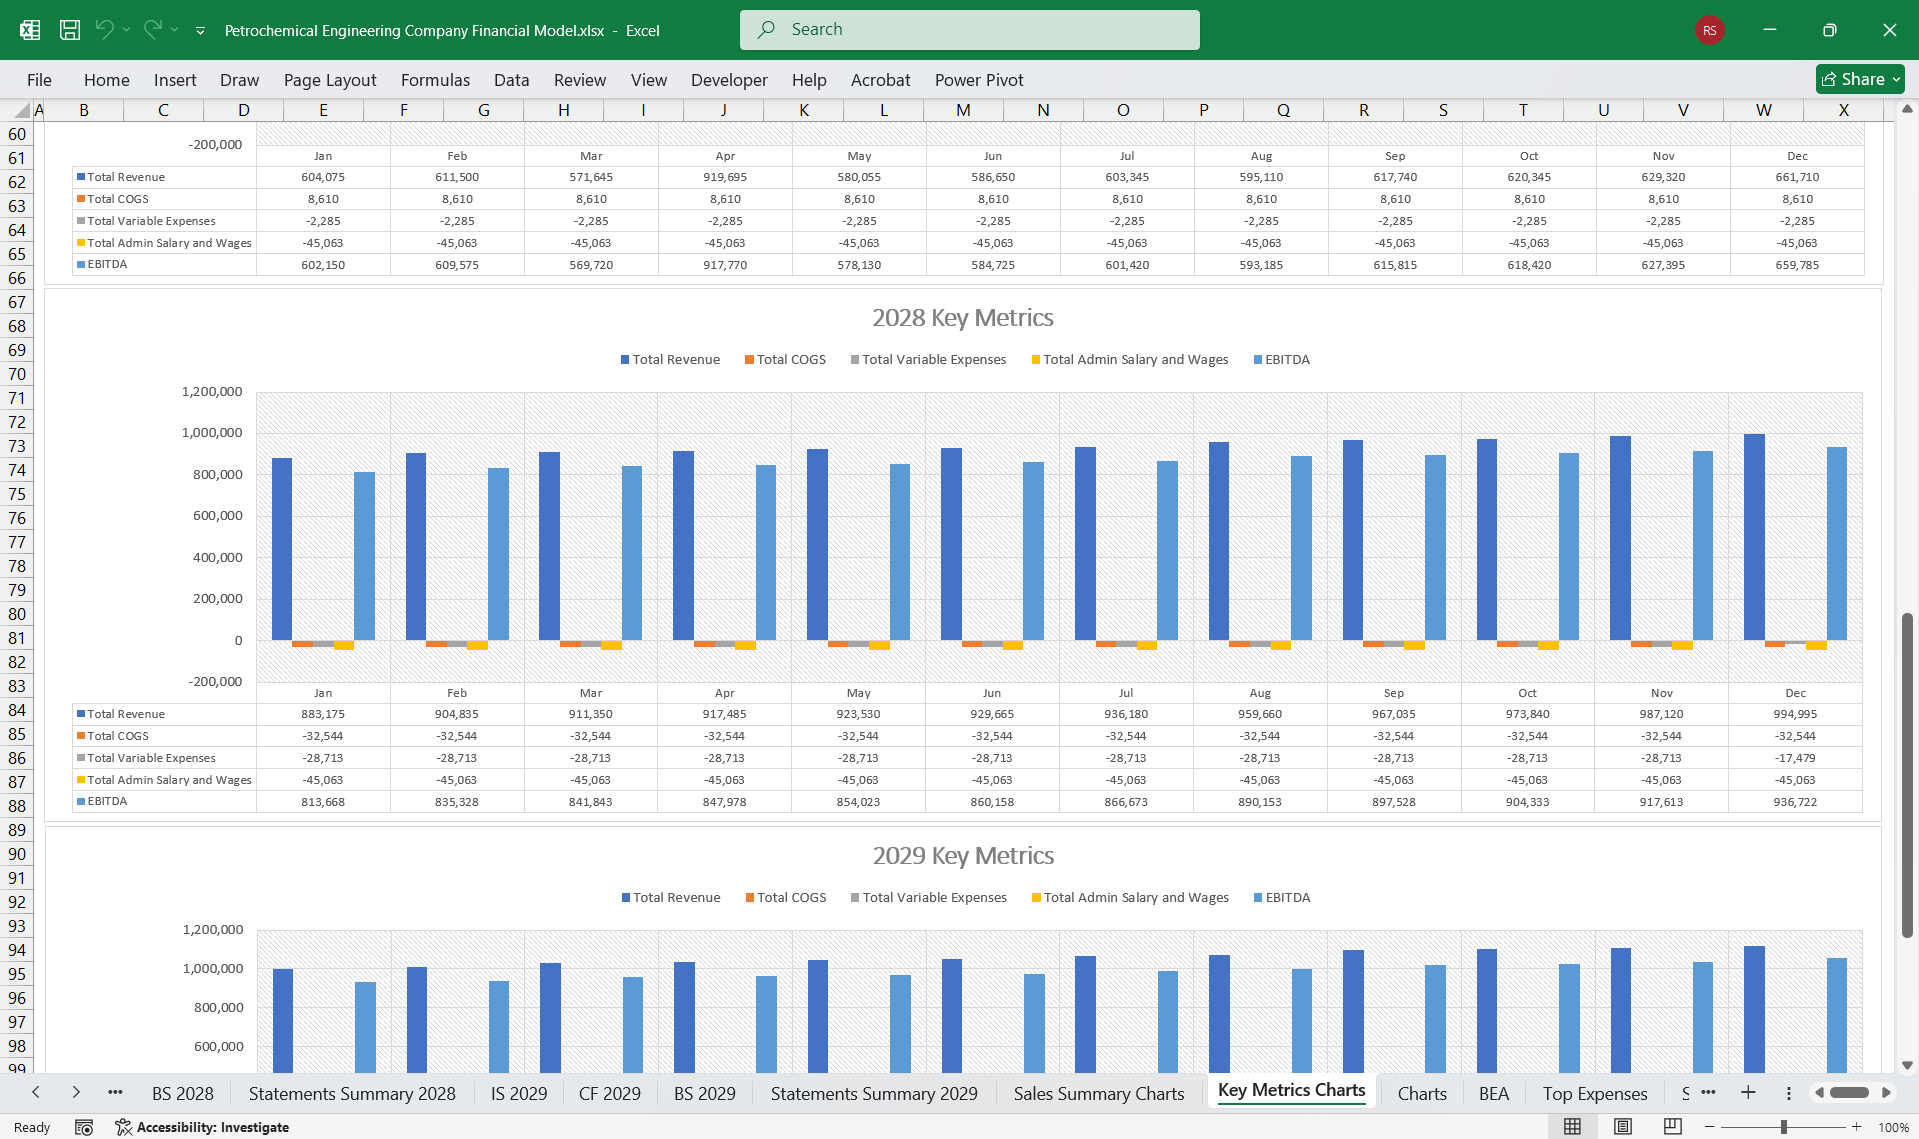
- Cost of Goods Sold (COGS):
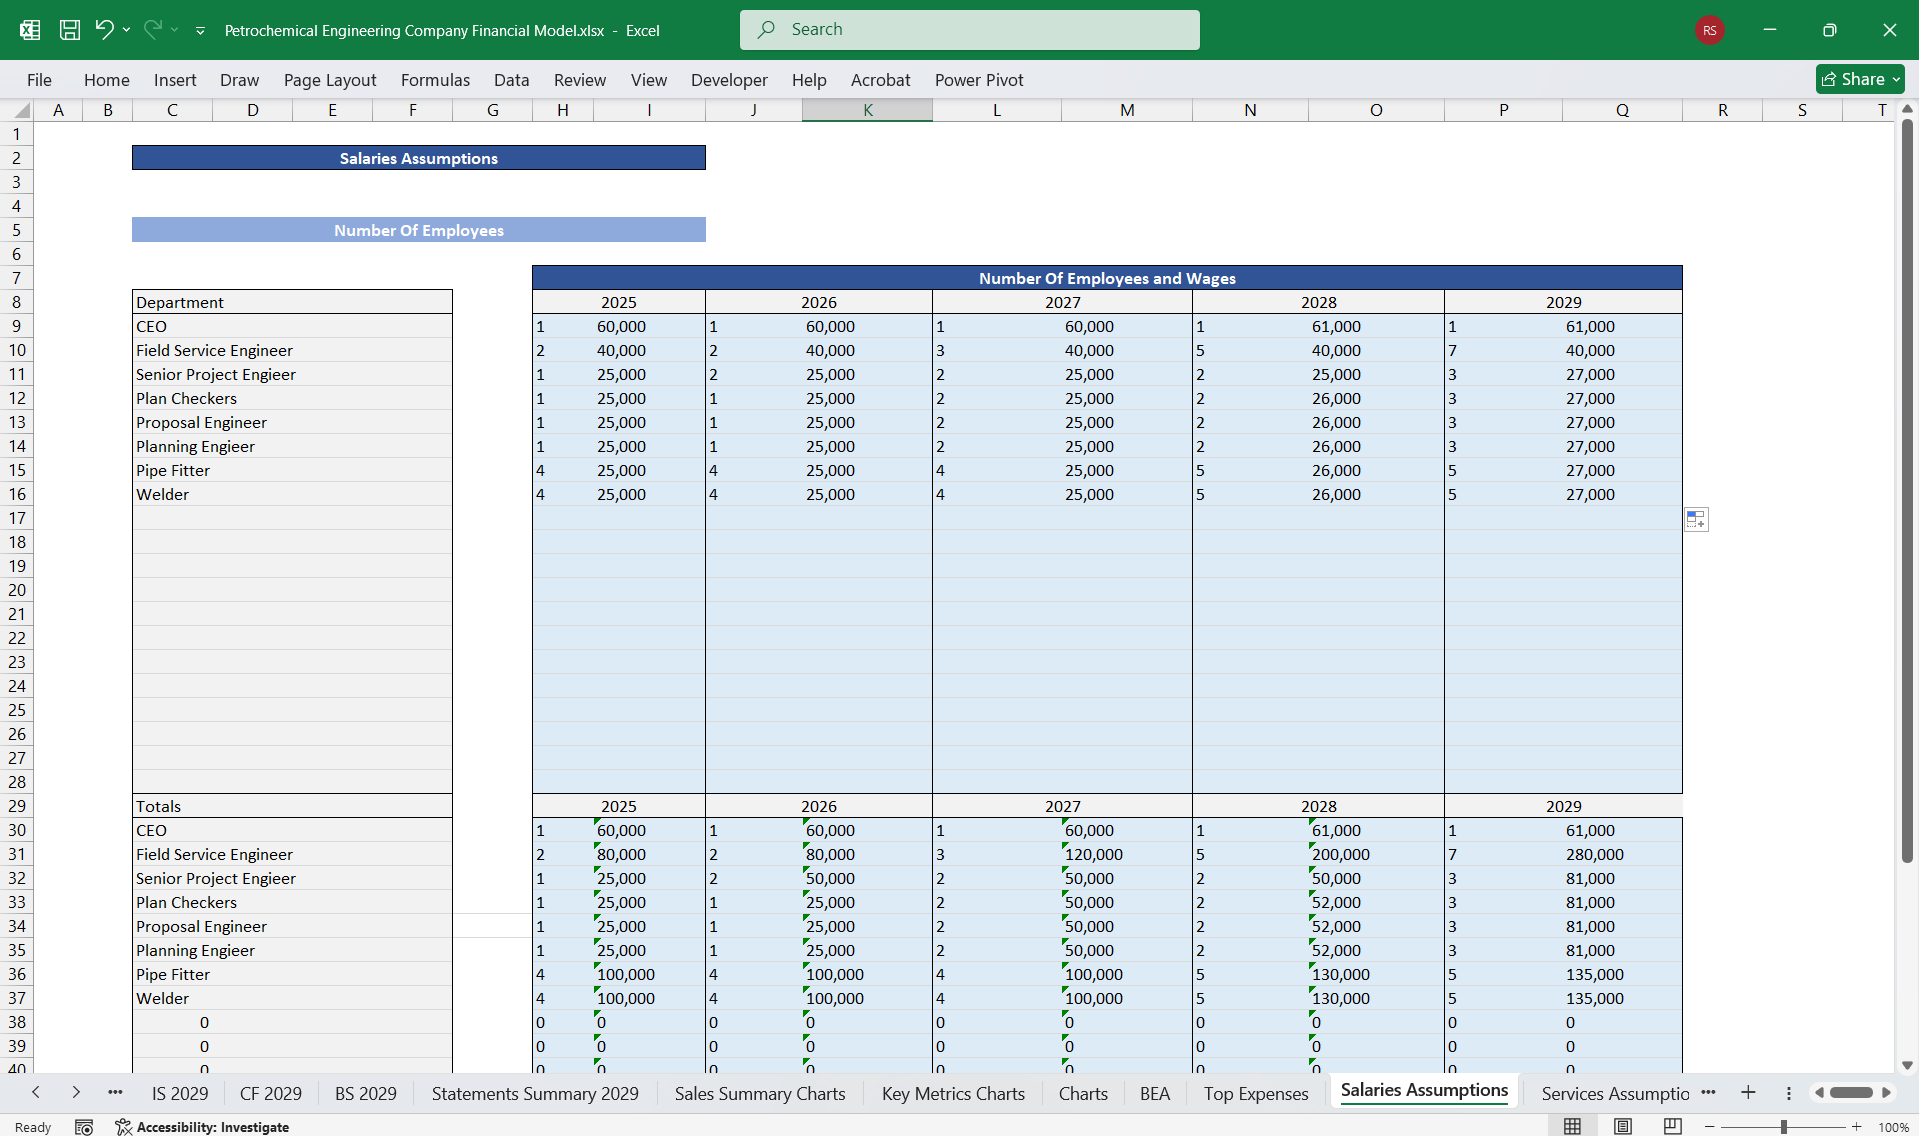
- Labor costs (engineers, technicians).
- Equipment, materials, and supplies for projects and maintenance.
- Subcontractor costs for specific tasks.
- Operating Expenses:
- Administrative overhead.
- Marketing and sales efforts.
- Employee training and development.
- R&D for better tools and technologies.
- Depreciation/Amortization:
- Depreciation of machinery and vehicles used in relocation and construction.
- Amortization of intellectual property or software licenses.
- Taxes and Interest:
- Tax obligations.
- Interest on business loans or equipment financing.
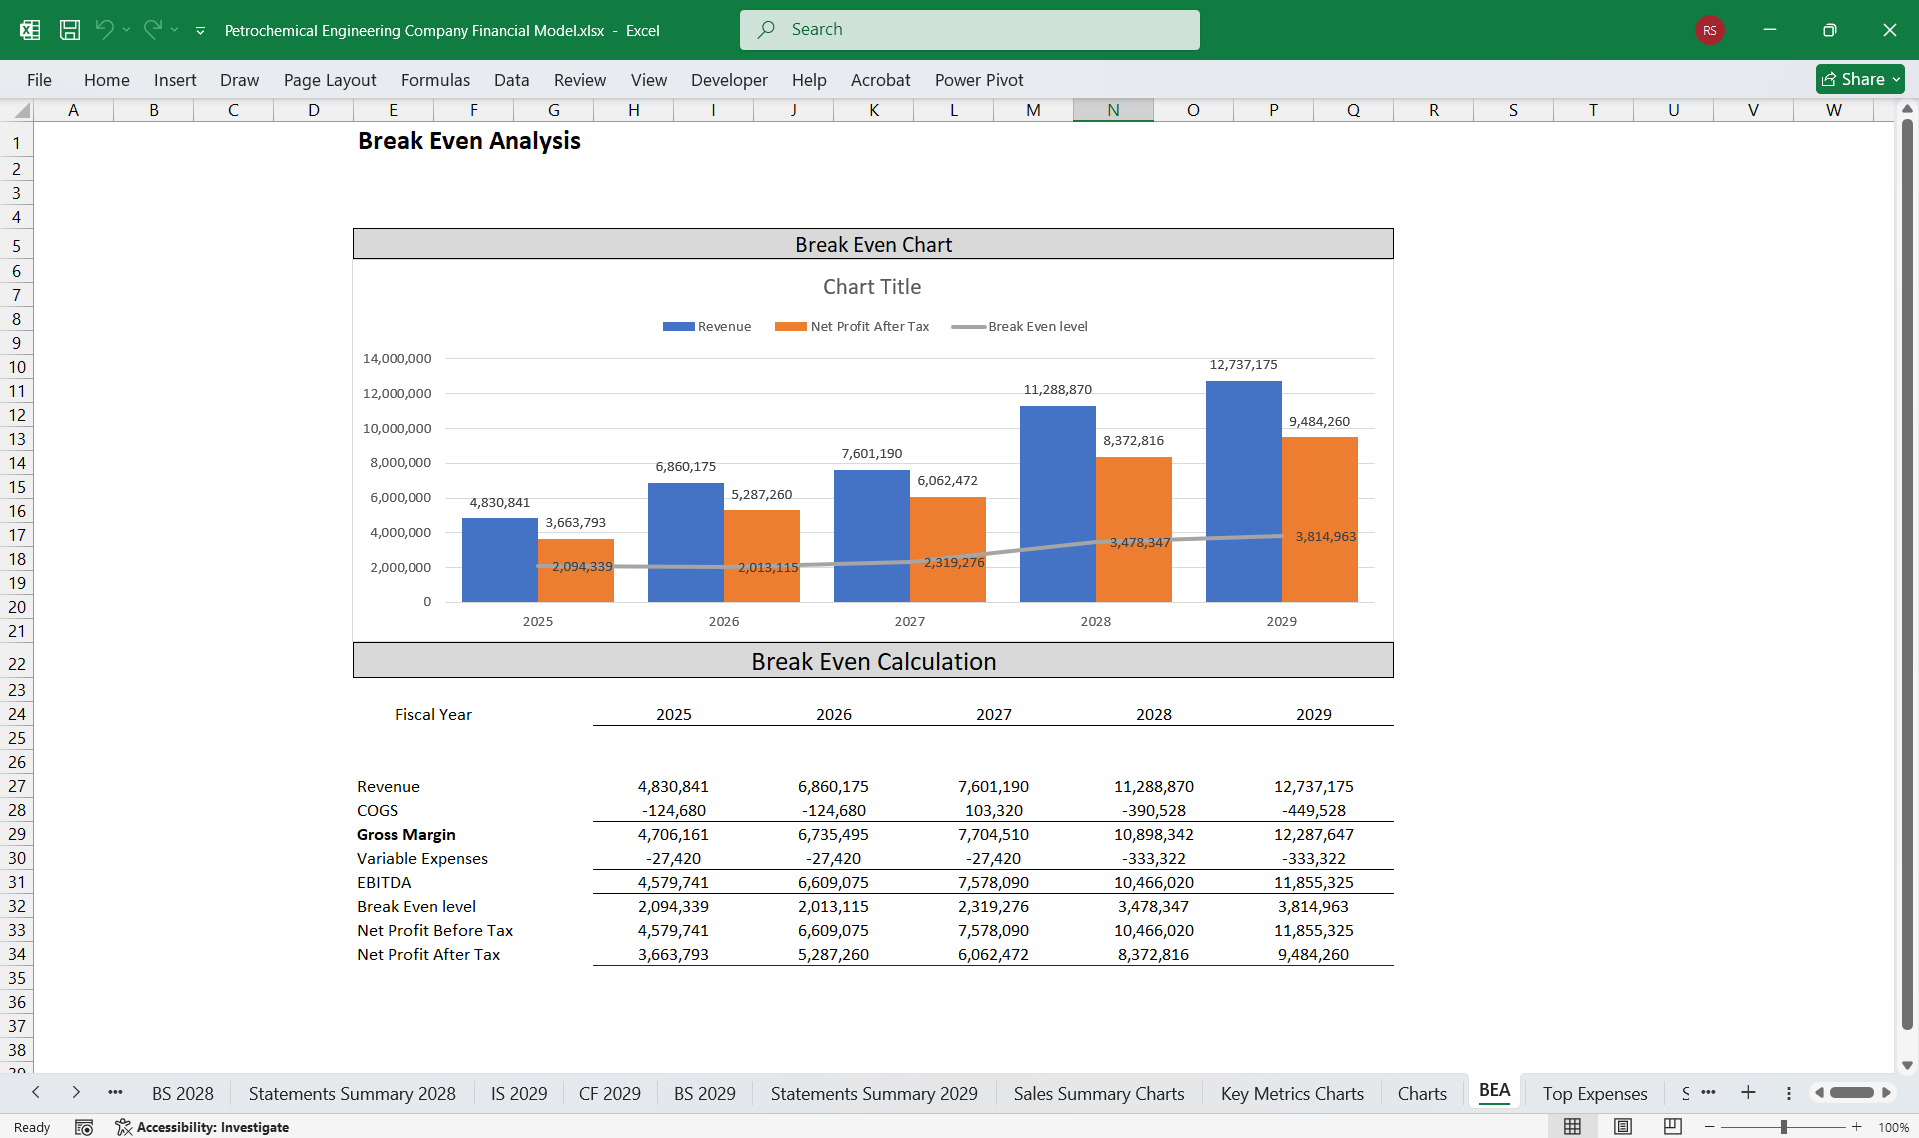
- Gross Profit.
- Operating Profit (EBIT).
- Net Profit.
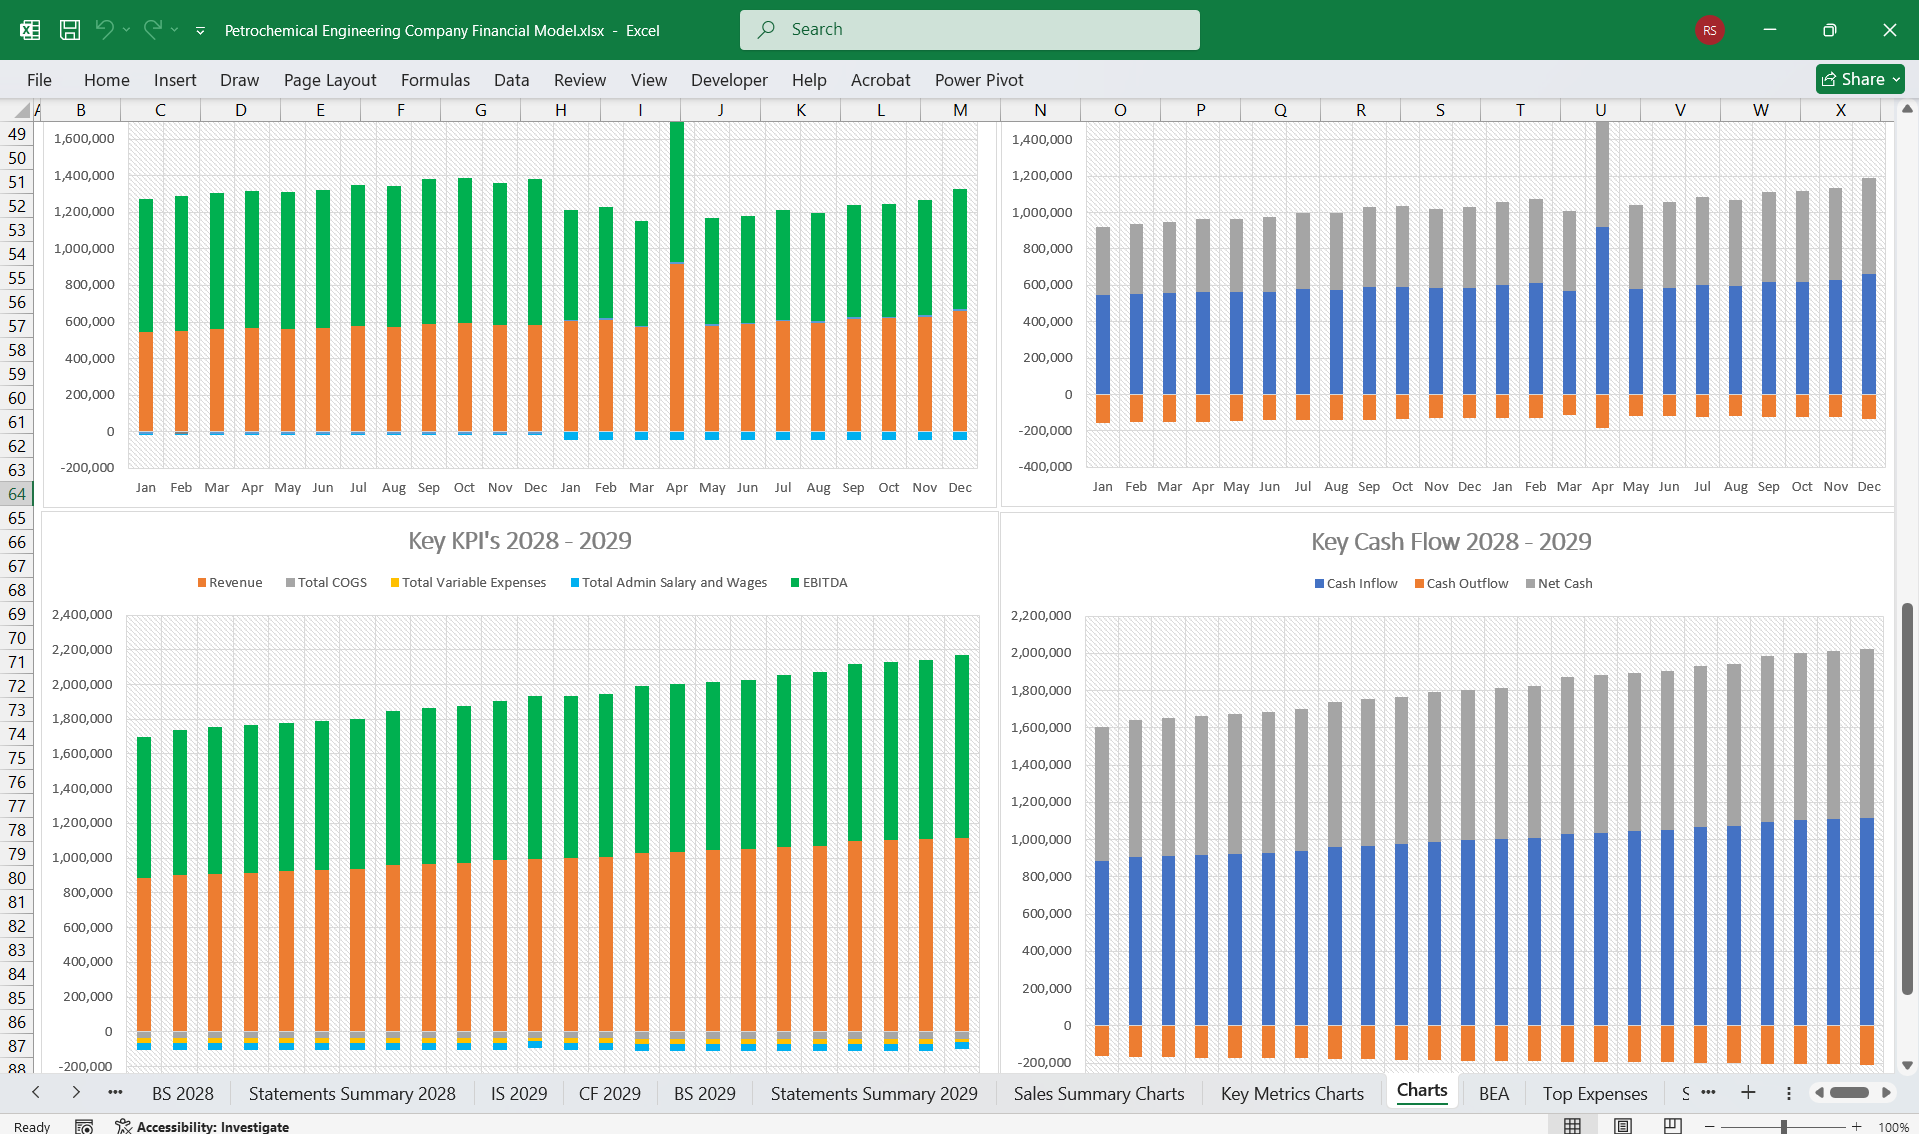
Operating Activities
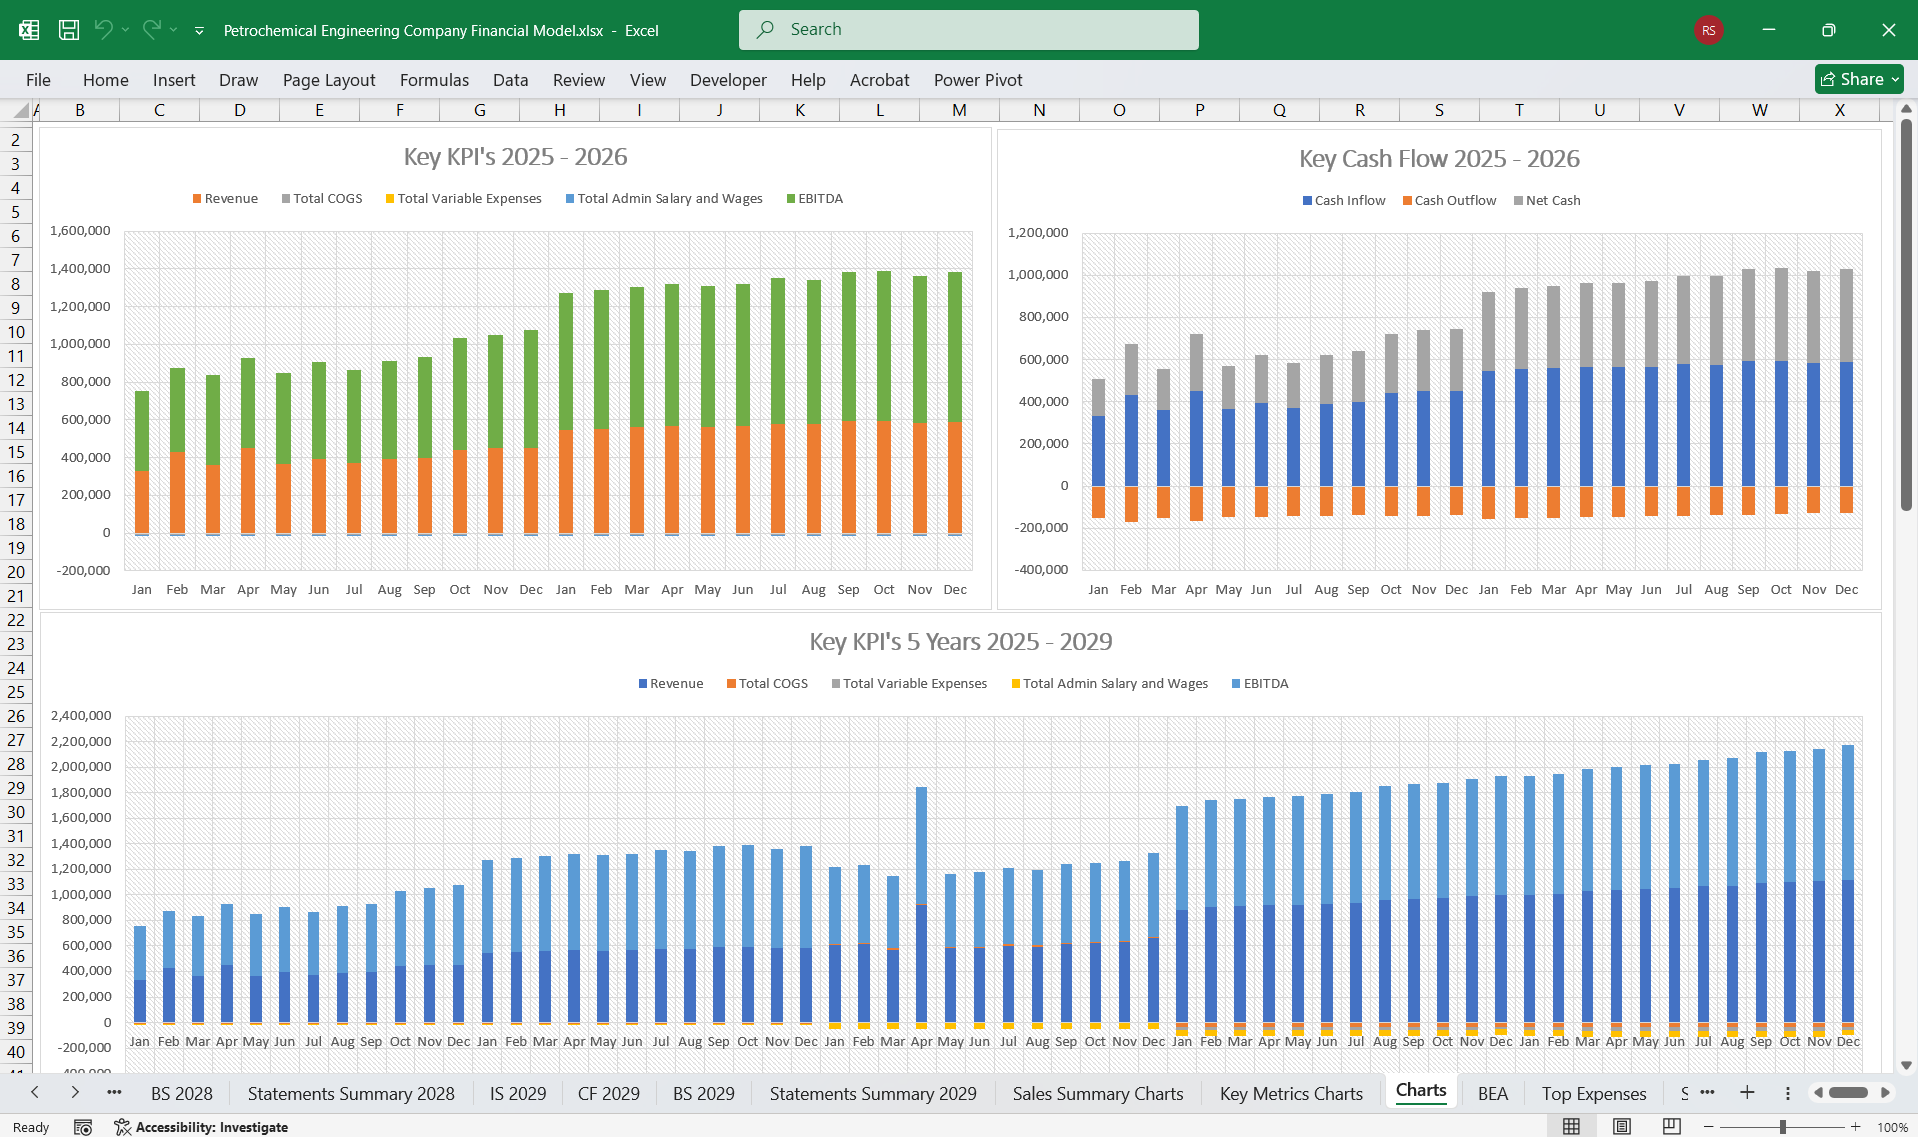
- Cash Inflows:
- Payments received from clients for project milestones, maintenance contracts, and equipment relocation jobs.
- Cash Outflows:
- Payments to suppliers, employees, and subcontractors.
- Utility costs and other day-to-day expenses.
- Cash Outflows:
- Capital expenditures on new industrial equipment or facilities.
- Investment in software or technology for operational efficiency.
- Cash Inflows:
- Proceeds from the sale of old equipment or assets.
- Cash Inflows:
- Borrowings for large-scale construction or new machinery purchases.
- Equity injections from investors.
- Cash Outflows:
- Loan repayments.
- Dividends to shareholders.
3. Balance SheetThe Balance Sheet provides a snapshot of assets, liabilities, and equity.
Assets
- Current Assets:
- Cash and cash equivalents.
- Accounts receivable (client payments due for services rendered).
- Inventory of tools, machinery parts, and consumables.
- Non-Current Assets:
- Property, plant, and equipment (PP&E) used in construction, maintenance, and relocation.
- Intangible assets like software systems or licenses.
- Current Liabilities:
- Accounts payable (supplier invoices due).
- Short-term loans or lease obligations.
- Non-Current Liabilities:
- Long-term loans or bonds for equipment and construction.
- Pension liabilities for employees.
- Owner’s equity or retained earnings.
- Share capital if applicable.
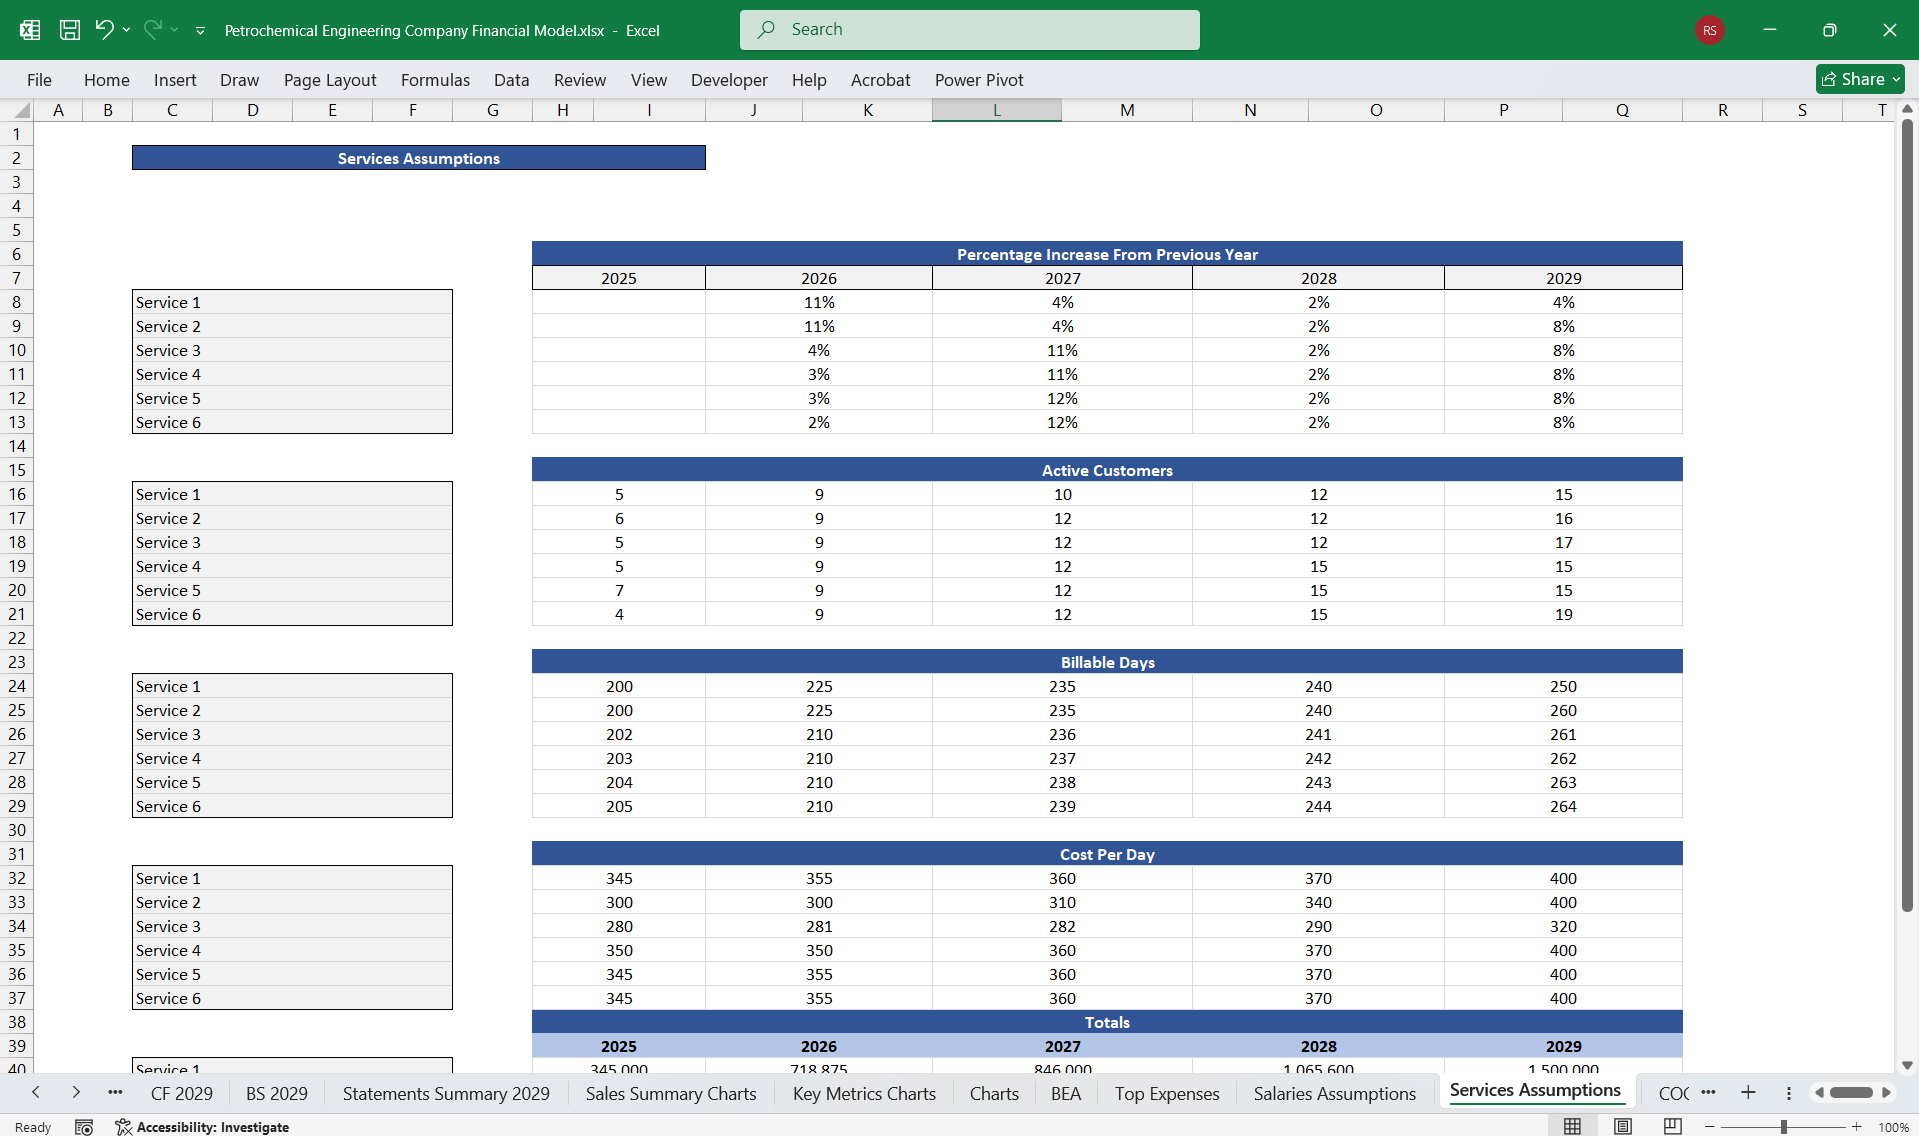
- Industrial Project Management:
- Revenue: Based on consulting fees and project oversight percentages.
- Costs: Primarily labor (engineers/project managers) and travel expenses.
- Industrial Machine Maintenance:
- Revenue: Revenue is predictable if tied to recurring contracts.
- Costs: Spare parts, tools, and technical labor.
- Industrial Equipment Relocation:
- Revenue: High margins for complex relocations.
- Costs: Transportation logistics, crane or rig rentals, specialized labor.
- Mechanical and Electrical Services:
- Revenue: Depends on service contracts and installations.
- Costs: Electrical/mechanical components and skilled technicians.
- Industrial Construction:
- Revenue: Milestone-based payments.
- Costs: Materials (steel, concrete), labor, and subcontractor costs.
- Gross Margin by Service Line - Profitability per service.
- Operating Margin - Overall operational efficiency.
- DSO (Days Sales Outstanding) - Efficiency in receivables collection.
- ROA (Return on Assets) - Effectiveness in utilizing assets.
This Best Practice includes
1 Excel Financial Model
Further information
Eliminates the need to create project finance trackers from scratch and includes all common Petrochemical Engineering company actual and projection components.
