
Originally published: 09/06/2023 14:57
Publication number: ELQ-88455-1
View all versions & Certificate
Publication number: ELQ-88455-1
View all versions & Certificate

Sporting Goods Excel Financial Model
The Sporting Goods Financial Model is a comprehensive financial model best suited to your business needs.
Our mission is to be the industrial leader and pioneer in our business domainFollow 12
Description
Sporting Goods Financial Model has an excellent possibility for significant growth prospects. Therefore, they must recognize the need for financial planning to compete effectively and efficiently. This excel financial model will assist you in determining the funding you need to support first-year operations, financial statements, project valuation, and financial analysis. Additionally, this Financial Model is simple and easy to use; it can be effectively used even by individuals who lack extensive financial knowledge.
The purpose of the Sporting Goods Financial model is to provide you with an ideal financial plan to strengthen funding plans, improve your startup strategy in a manner that can be successfully implemented, and enable both you and potential investors to recognize a comprehensive understanding of the economics of your business.
Key sheets of The Sporting Goods Financial Model
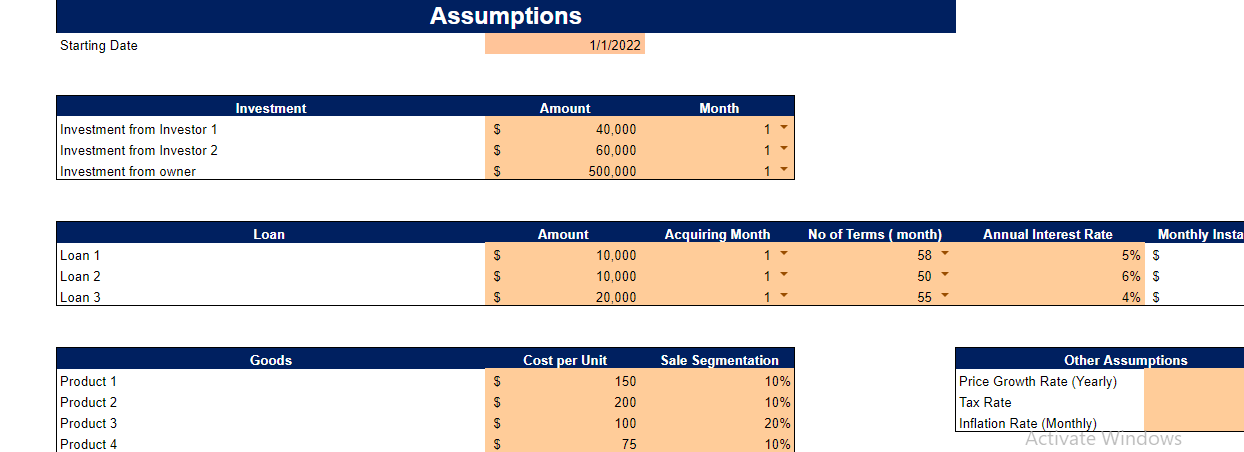
Input/Assumptions of Sporting Goods Financial Model
The input sheet contains all the assumptions related to the business. Then, the columns highlighted in peach are the input you must change according to your business data, and the model will adjust the calculations accordingly. The main assumptions in the input sheet are
1 Investment and loan
2 Conversion rate
3 No of new visitors (First month) and Visitors Growth rate(Monthly)
4 Price and cost Growth rate (Yearly) and Average no of orders per customer
5 Cost and sales percentage
6 Employees’ payroll, capital expenditures, and operating expenses
7 Receivables, payables, inventory days
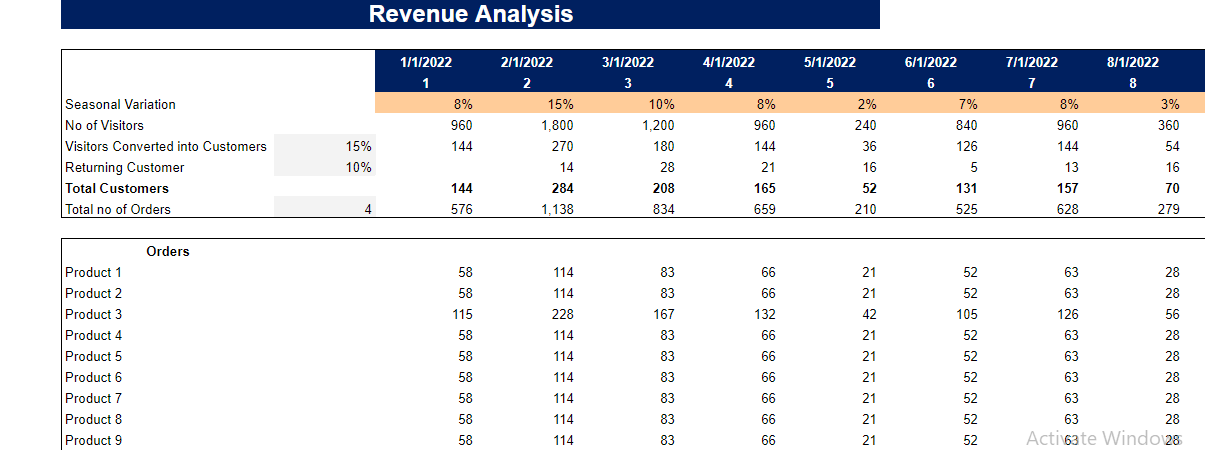
Revenue Analysis of the Sporting Goods Financial Model
The Revenue analysis provides you with the assumptions and potential conversion of the visitors into customers, the no of bikes bought, their price, and the revenue and cost of goods sold for all types of tires.
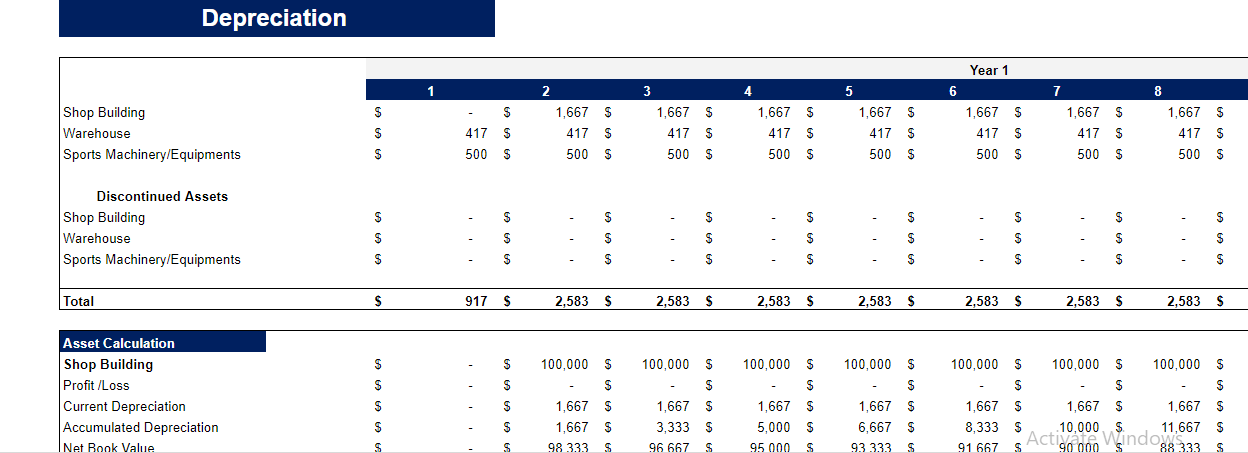
Depreciation
The depreciation table calculates the depreciation value for your fixed assets, Net book value, and the profit or loss you will incur in the month of sale.
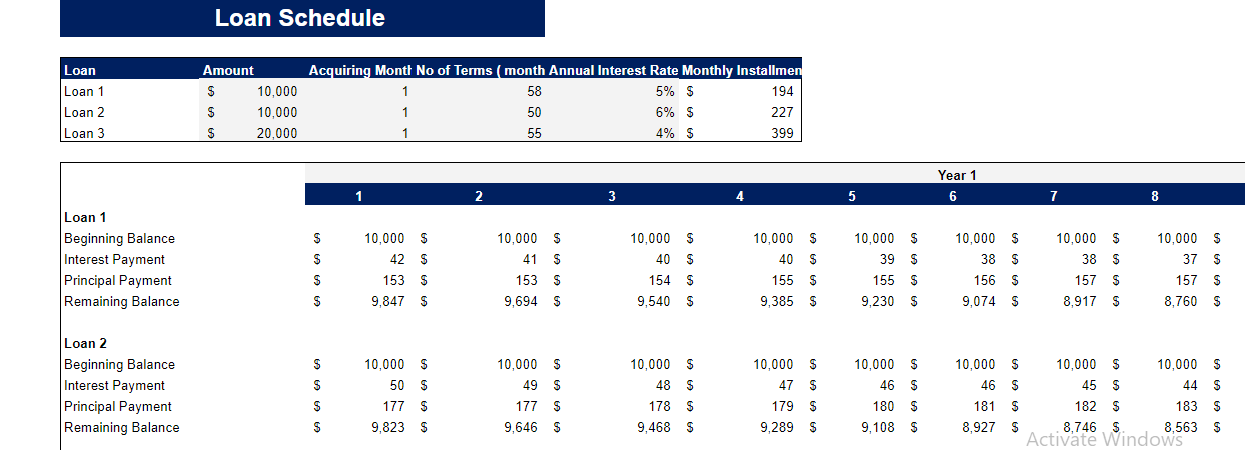
Loan Schedule
The loan schedule calculates the interest and the principal amount being paid to the creditor each month and the remaining balance needed to pay in the future.
Startup Summary
The Startup Summary explains the funding required to meet the first year of operations. Furthermore, it gives information about the amount of money the company has already invested offers potential investors a brief overview of the company and aids in raising money.
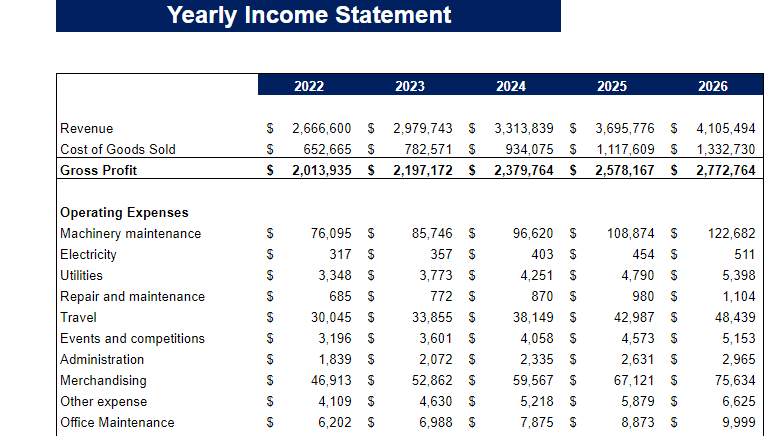
Income Statement
An income statement shows the company’s profitability. The income you will earn and the expenditures you will bear in the next five years. It indicates whether the company is making a profit or a loss.
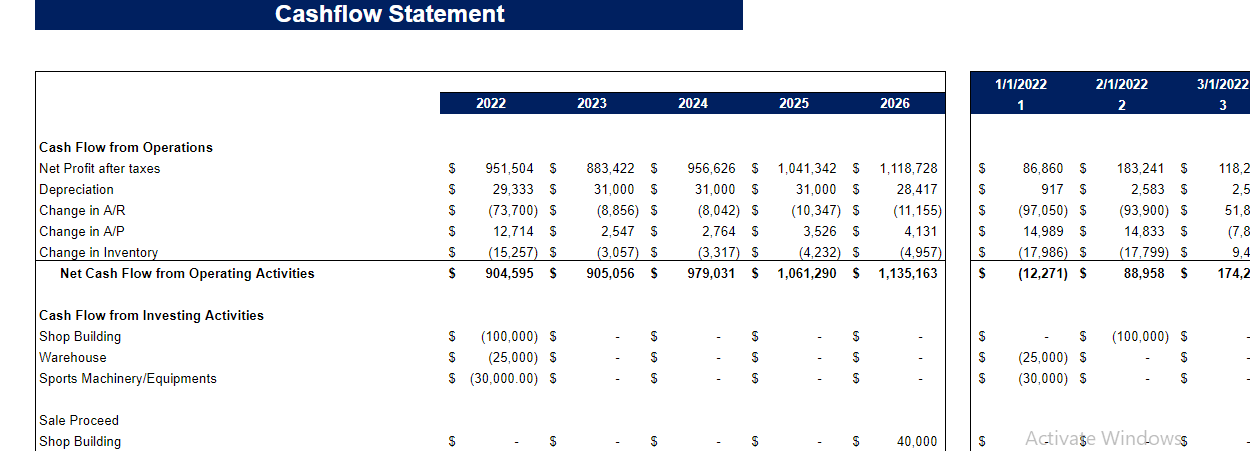
Cash Flow Statement
The cash flow statement provides an overview of your business’s cash inflow and outflow from operating, financing, and investing activities and, finally, the net cash you have in your industries. The cash flow statement will evaluate how efficiently your company manages its cash position.
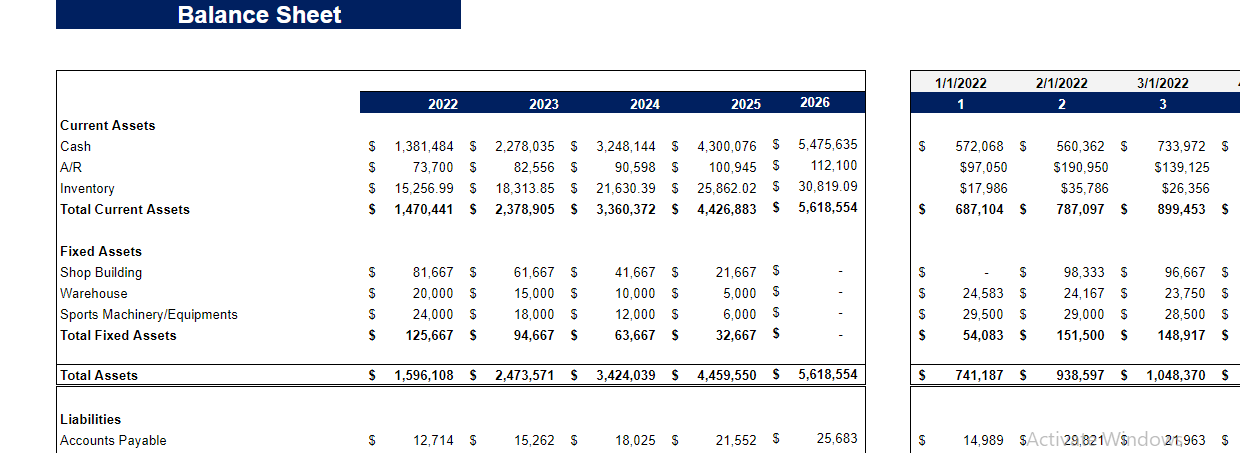
Balance Sheet of the Sporting Goods Financial Model
The balance sheet displays the company’s total assets and how the assets are financed through debt or equity. Overall it shows the financial position of the company.
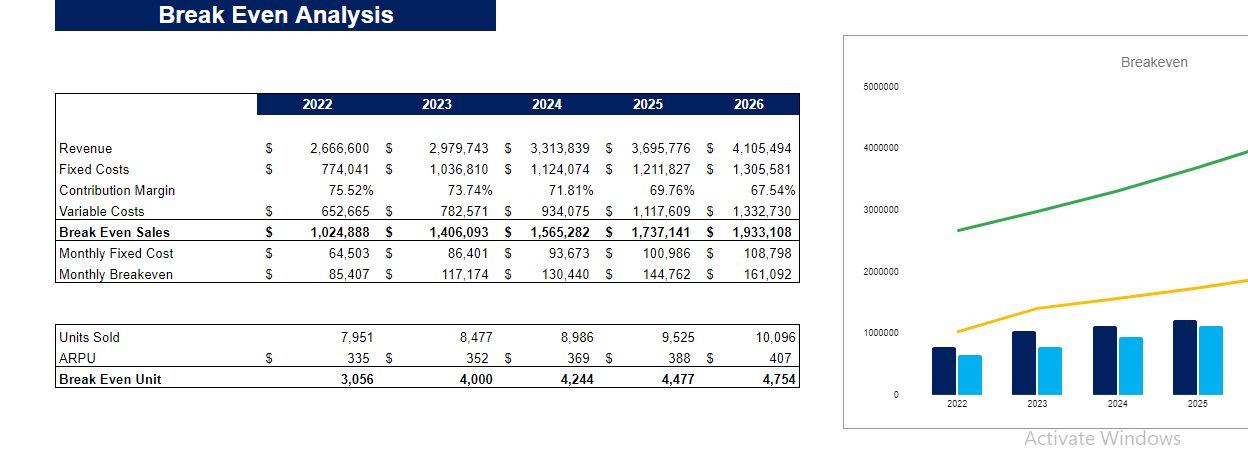
Break-even Analysis
The breakeven analysis will help you understand the sales required to meet the breakeven. That is no profit, no loss.
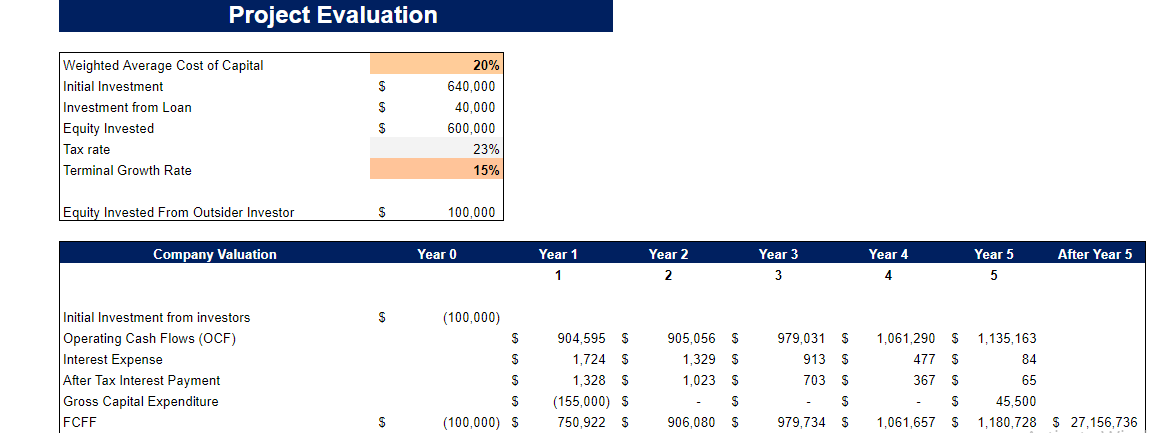
Project Evaluation
The project evaluation estimates your business worth. It contains the Net present value of the company, Internal rate of return, Return on Investment, Expected equity percentage to investors, investor’s Future Equity Share, and Cash Burn Rate Analysis.
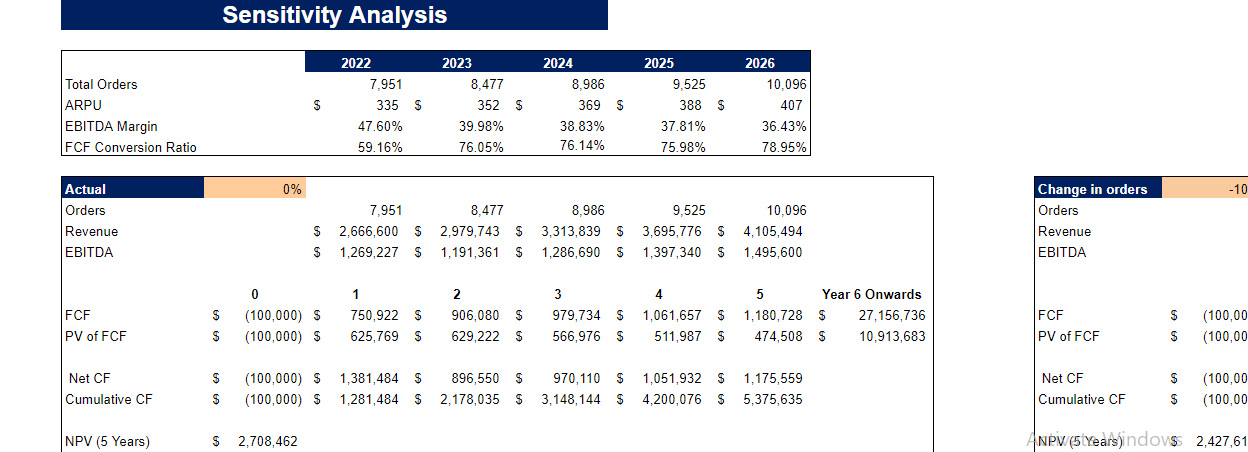
Sensitivity Analysis of the Sporting Goods Financial Model
The sensitivity analysis will estimate future projections by changing the revenue while keeping costs the same.
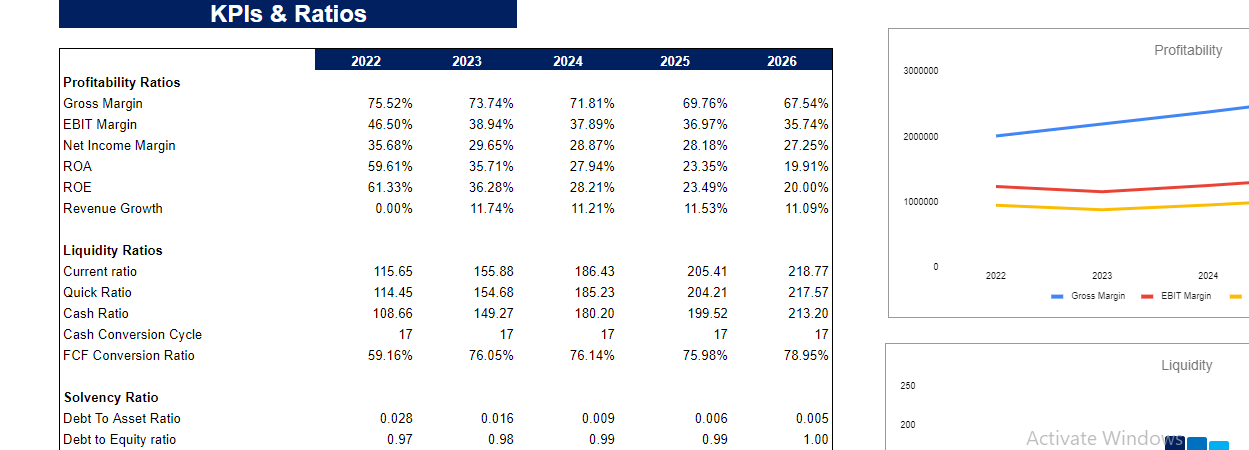
KPIs and Ratios
This Key Performance Indicator and Ratios will enable you to know the profitability, liquidity, solvency, and Efficiency ratios in numerical and through graphs.
Dashboard
This dashboard provides a graphical representation of how your business is performing. So you don’t need to move sheets to compare data.
Benefits of Using this Financial Model
1 Effortless and easy to use, there is no need to create formulas.
2 Cost-effective, as you don’t need to hire financial experts for financial modeling tasks for your startup.
3 Detailed calculations with an accurate and standardized pattern.
Sporting Goods Financial Model has an excellent possibility for significant growth prospects. Therefore, they must recognize the need for financial planning to compete effectively and efficiently. This excel financial model will assist you in determining the funding you need to support first-year operations, financial statements, project valuation, and financial analysis. Additionally, this Financial Model is simple and easy to use; it can be effectively used even by individuals who lack extensive financial knowledge.
The purpose of the Sporting Goods Financial model is to provide you with an ideal financial plan to strengthen funding plans, improve your startup strategy in a manner that can be successfully implemented, and enable both you and potential investors to recognize a comprehensive understanding of the economics of your business.
Key sheets of The Sporting Goods Financial Model
Input/Assumptions of Sporting Goods Financial Model
The input sheet contains all the assumptions related to the business. Then, the columns highlighted in peach are the input you must change according to your business data, and the model will adjust the calculations accordingly. The main assumptions in the input sheet are
1 Investment and loan
2 Conversion rate
3 No of new visitors (First month) and Visitors Growth rate(Monthly)
4 Price and cost Growth rate (Yearly) and Average no of orders per customer
5 Cost and sales percentage
6 Employees’ payroll, capital expenditures, and operating expenses
7 Receivables, payables, inventory days
Revenue Analysis of the Sporting Goods Financial Model
The Revenue analysis provides you with the assumptions and potential conversion of the visitors into customers, the no of bikes bought, their price, and the revenue and cost of goods sold for all types of tires.
Depreciation
The depreciation table calculates the depreciation value for your fixed assets, Net book value, and the profit or loss you will incur in the month of sale.
Loan Schedule
The loan schedule calculates the interest and the principal amount being paid to the creditor each month and the remaining balance needed to pay in the future.
Startup Summary
The Startup Summary explains the funding required to meet the first year of operations. Furthermore, it gives information about the amount of money the company has already invested offers potential investors a brief overview of the company and aids in raising money.
Income Statement
An income statement shows the company’s profitability. The income you will earn and the expenditures you will bear in the next five years. It indicates whether the company is making a profit or a loss.
Cash Flow Statement
The cash flow statement provides an overview of your business’s cash inflow and outflow from operating, financing, and investing activities and, finally, the net cash you have in your industries. The cash flow statement will evaluate how efficiently your company manages its cash position.
Balance Sheet of the Sporting Goods Financial Model
The balance sheet displays the company’s total assets and how the assets are financed through debt or equity. Overall it shows the financial position of the company.
Break-even Analysis
The breakeven analysis will help you understand the sales required to meet the breakeven. That is no profit, no loss.
Project Evaluation
The project evaluation estimates your business worth. It contains the Net present value of the company, Internal rate of return, Return on Investment, Expected equity percentage to investors, investor’s Future Equity Share, and Cash Burn Rate Analysis.
Sensitivity Analysis of the Sporting Goods Financial Model
The sensitivity analysis will estimate future projections by changing the revenue while keeping costs the same.
KPIs and Ratios
This Key Performance Indicator and Ratios will enable you to know the profitability, liquidity, solvency, and Efficiency ratios in numerical and through graphs.
Dashboard
This dashboard provides a graphical representation of how your business is performing. So you don’t need to move sheets to compare data.
Benefits of Using this Financial Model
1 Effortless and easy to use, there is no need to create formulas.
2 Cost-effective, as you don’t need to hire financial experts for financial modeling tasks for your startup.
3 Detailed calculations with an accurate and standardized pattern.
This Best Practice includes
1 Excel File (15 Tabs)
Further information
The objective of the Sporting Goods Financial Model is to provide a comprehensive and customizable tool for businesses in the sporting goods industry.
For Sporting Goods Excel Financial Model
