
Originally published: 17/11/2023 13:19
Publication number: ELQ-97470-1
View all versions & Certificate
Publication number: ELQ-97470-1
View all versions & Certificate

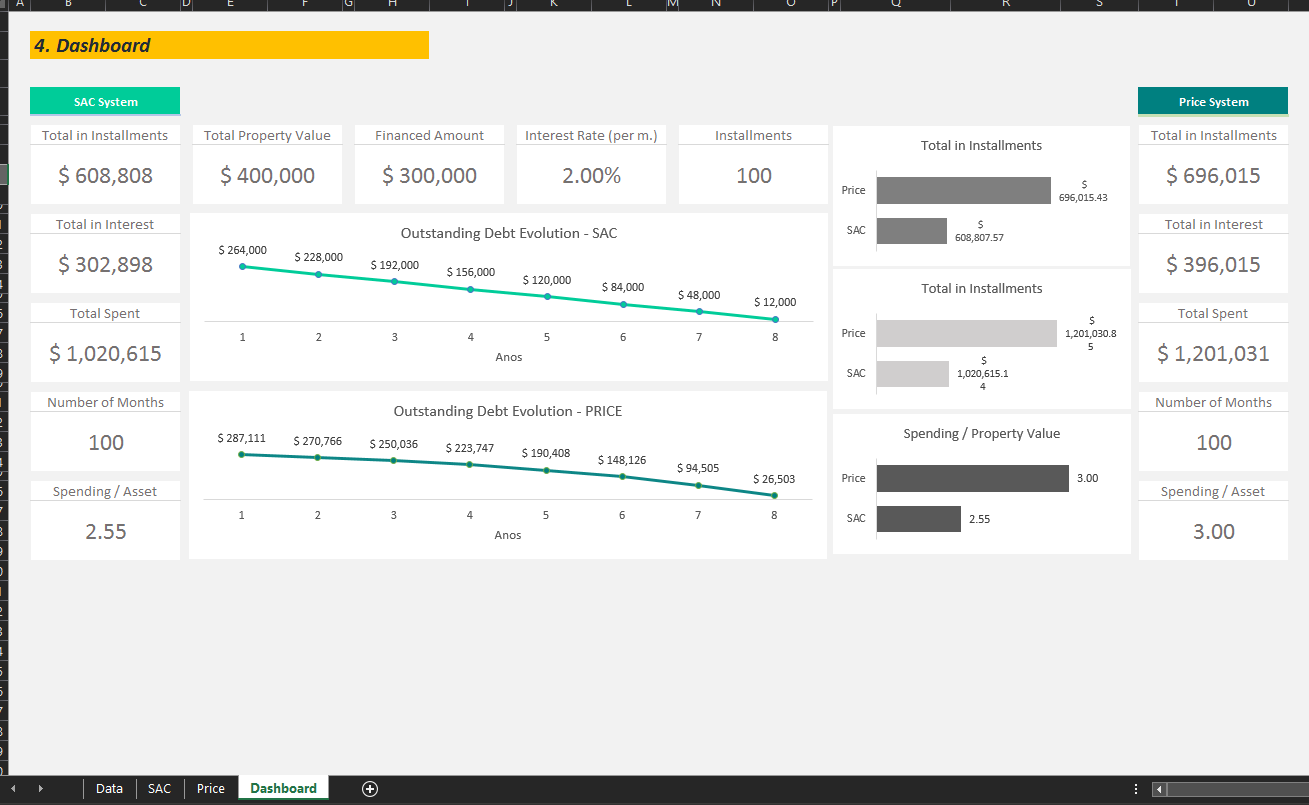
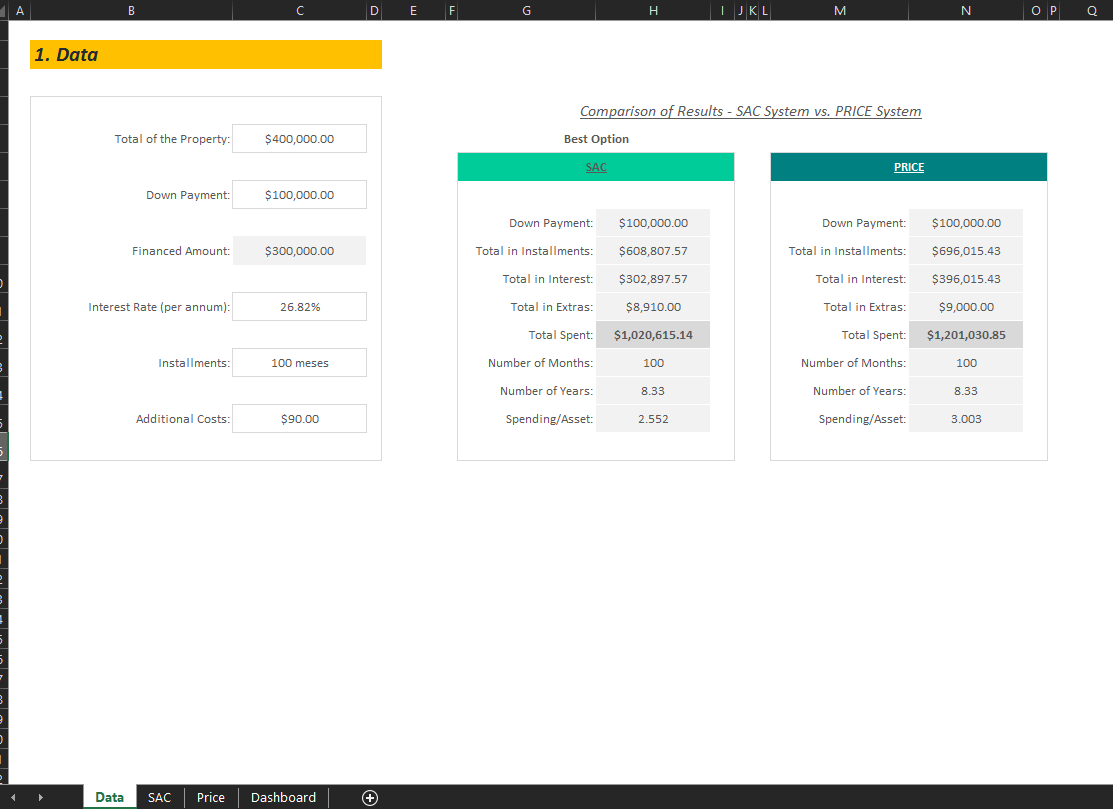
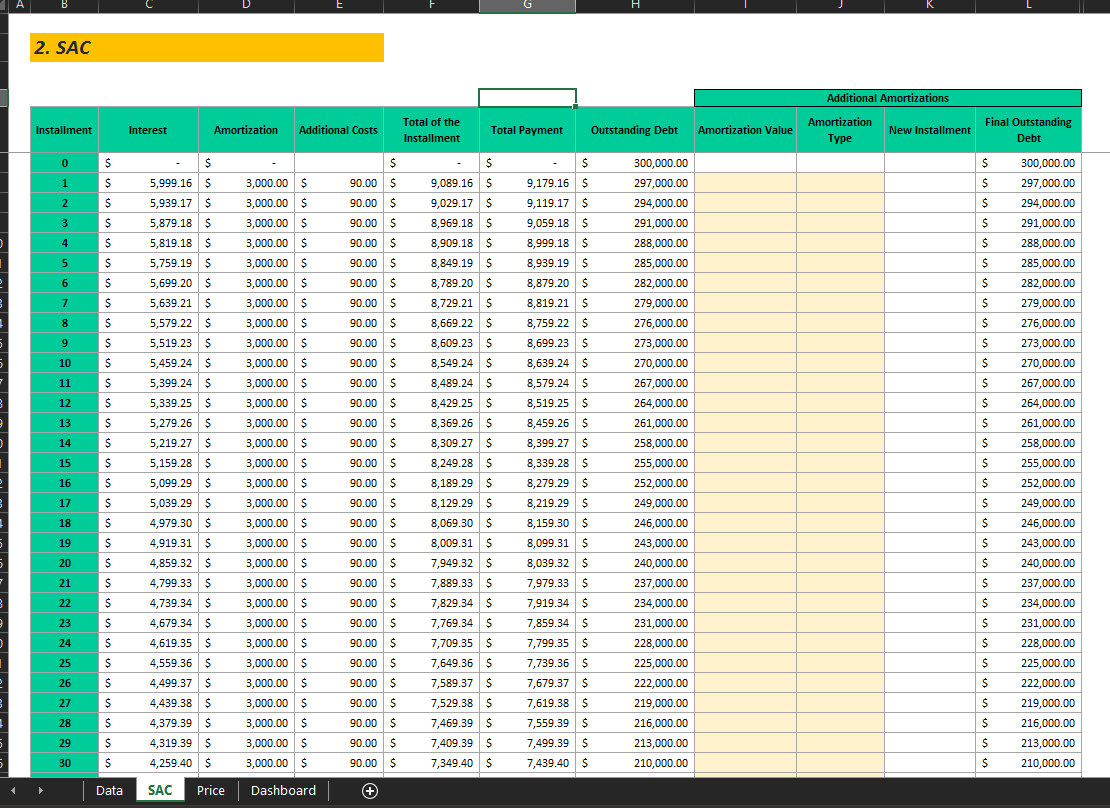
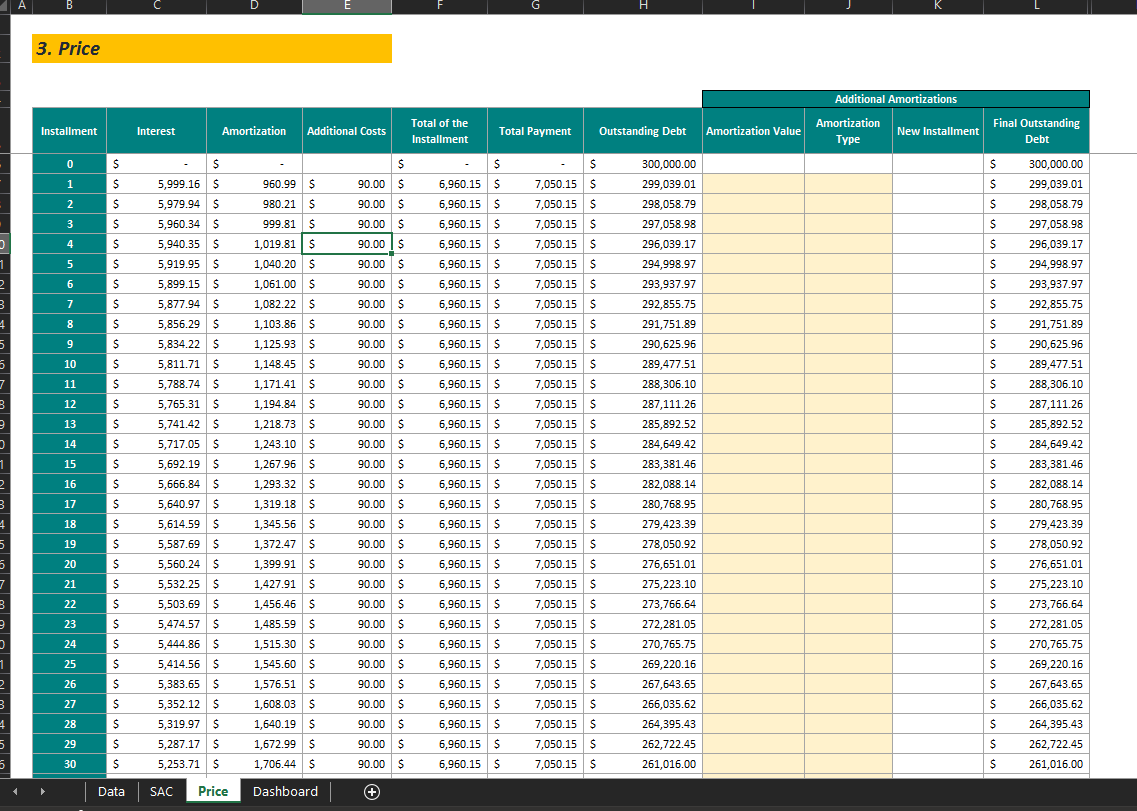
Price and SAC Table Simulator Excel Template
Compare real estate financing using the Price Table and SAC Table by using this spreadsheet.
Our online platform provides a wide range of engaging and useful templates that cater to various needs.Follow 37
