
Originally published: 16/08/2024 11:41
Publication number: ELQ-48301-1
View all versions & Certificate
Publication number: ELQ-48301-1
View all versions & Certificate

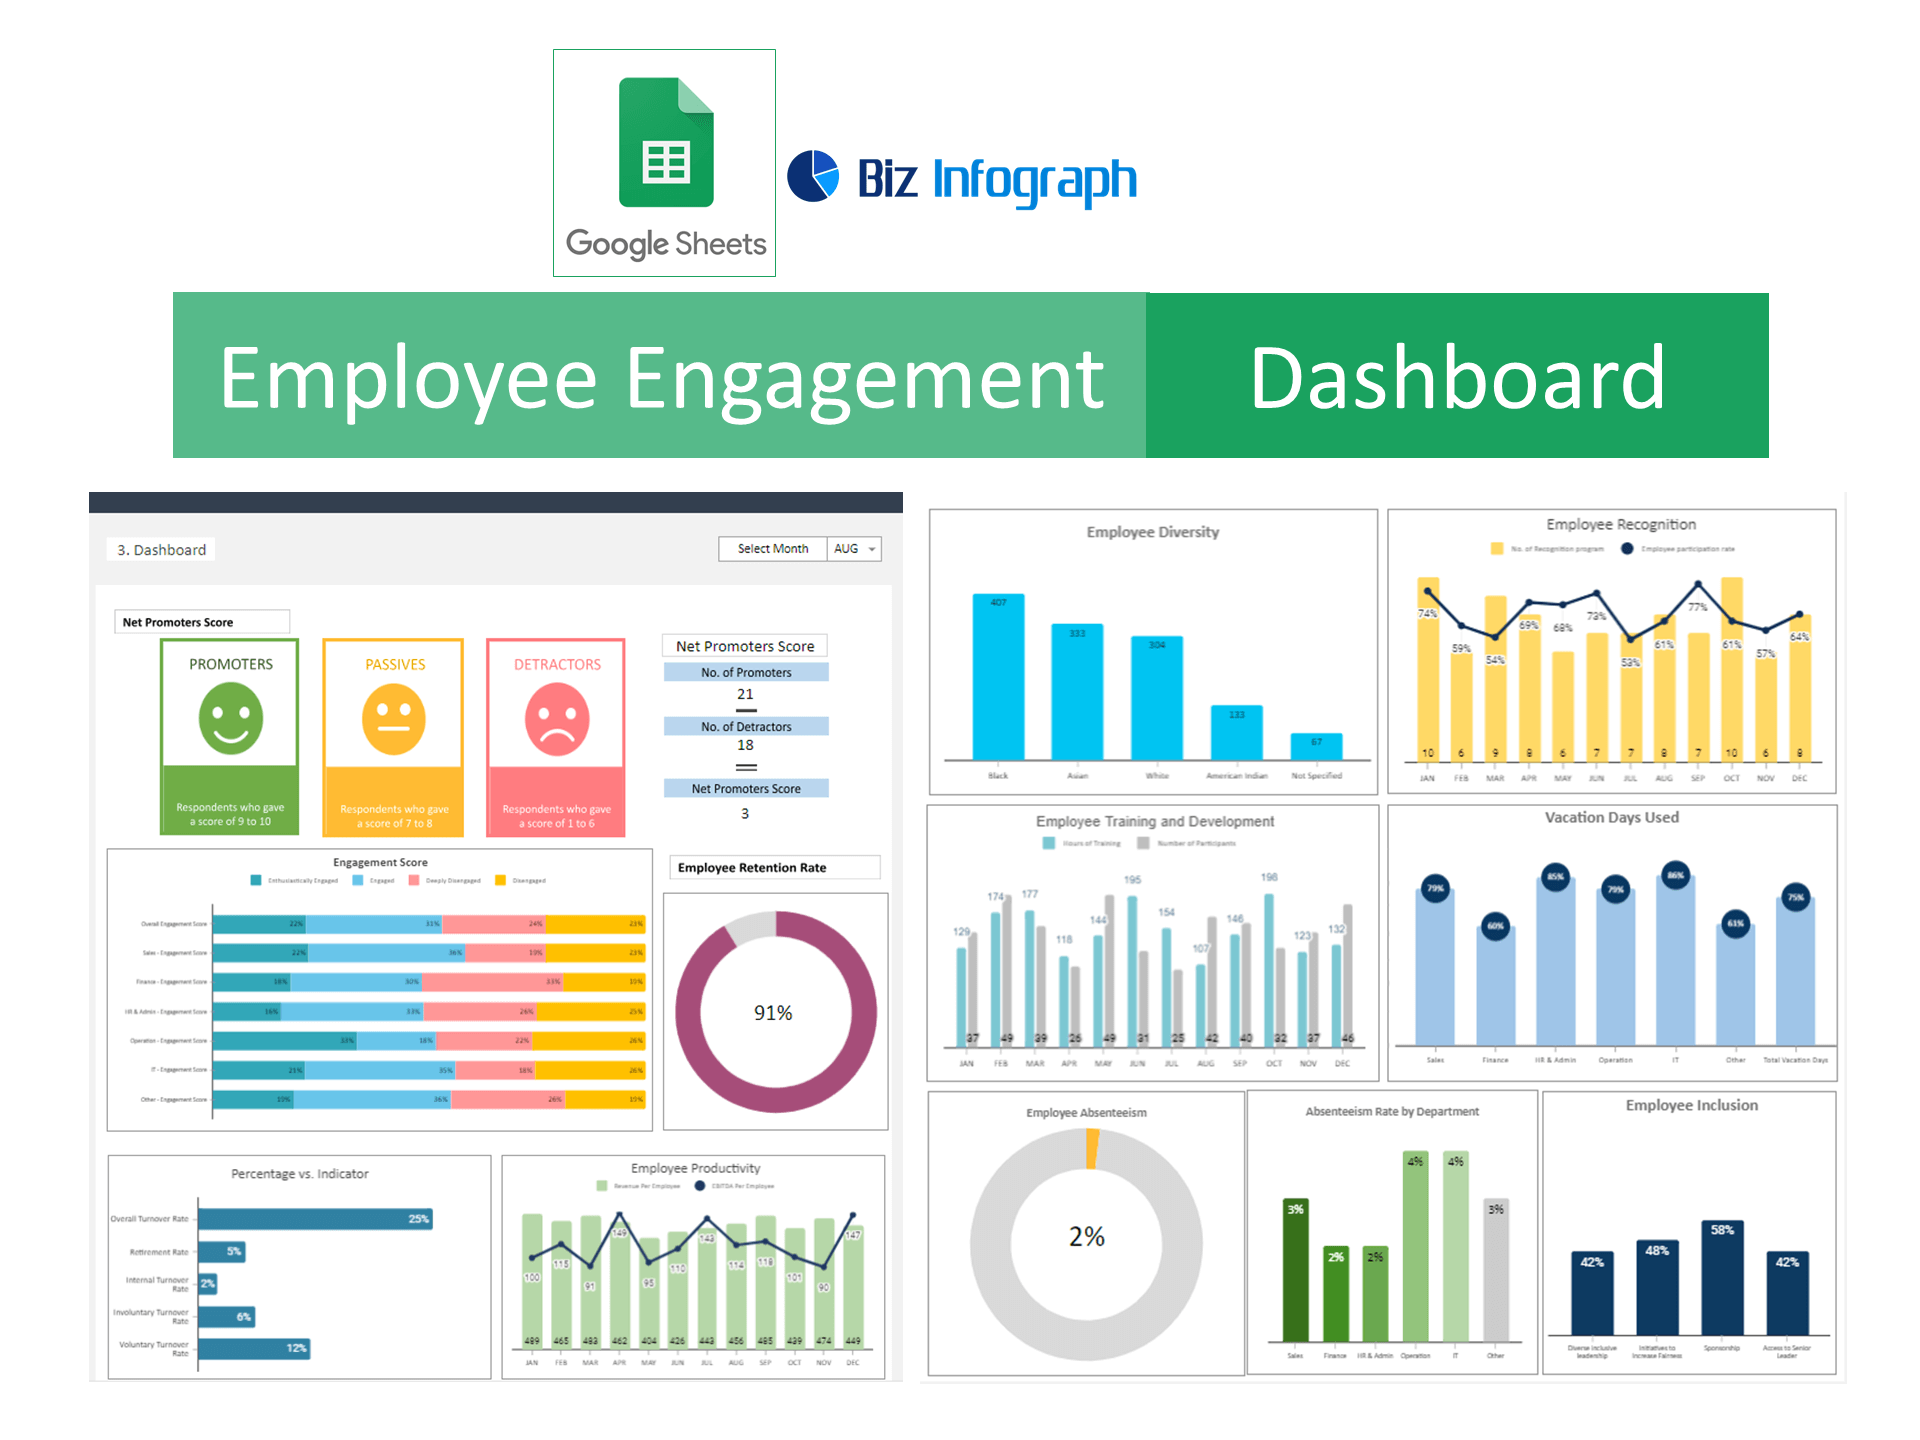
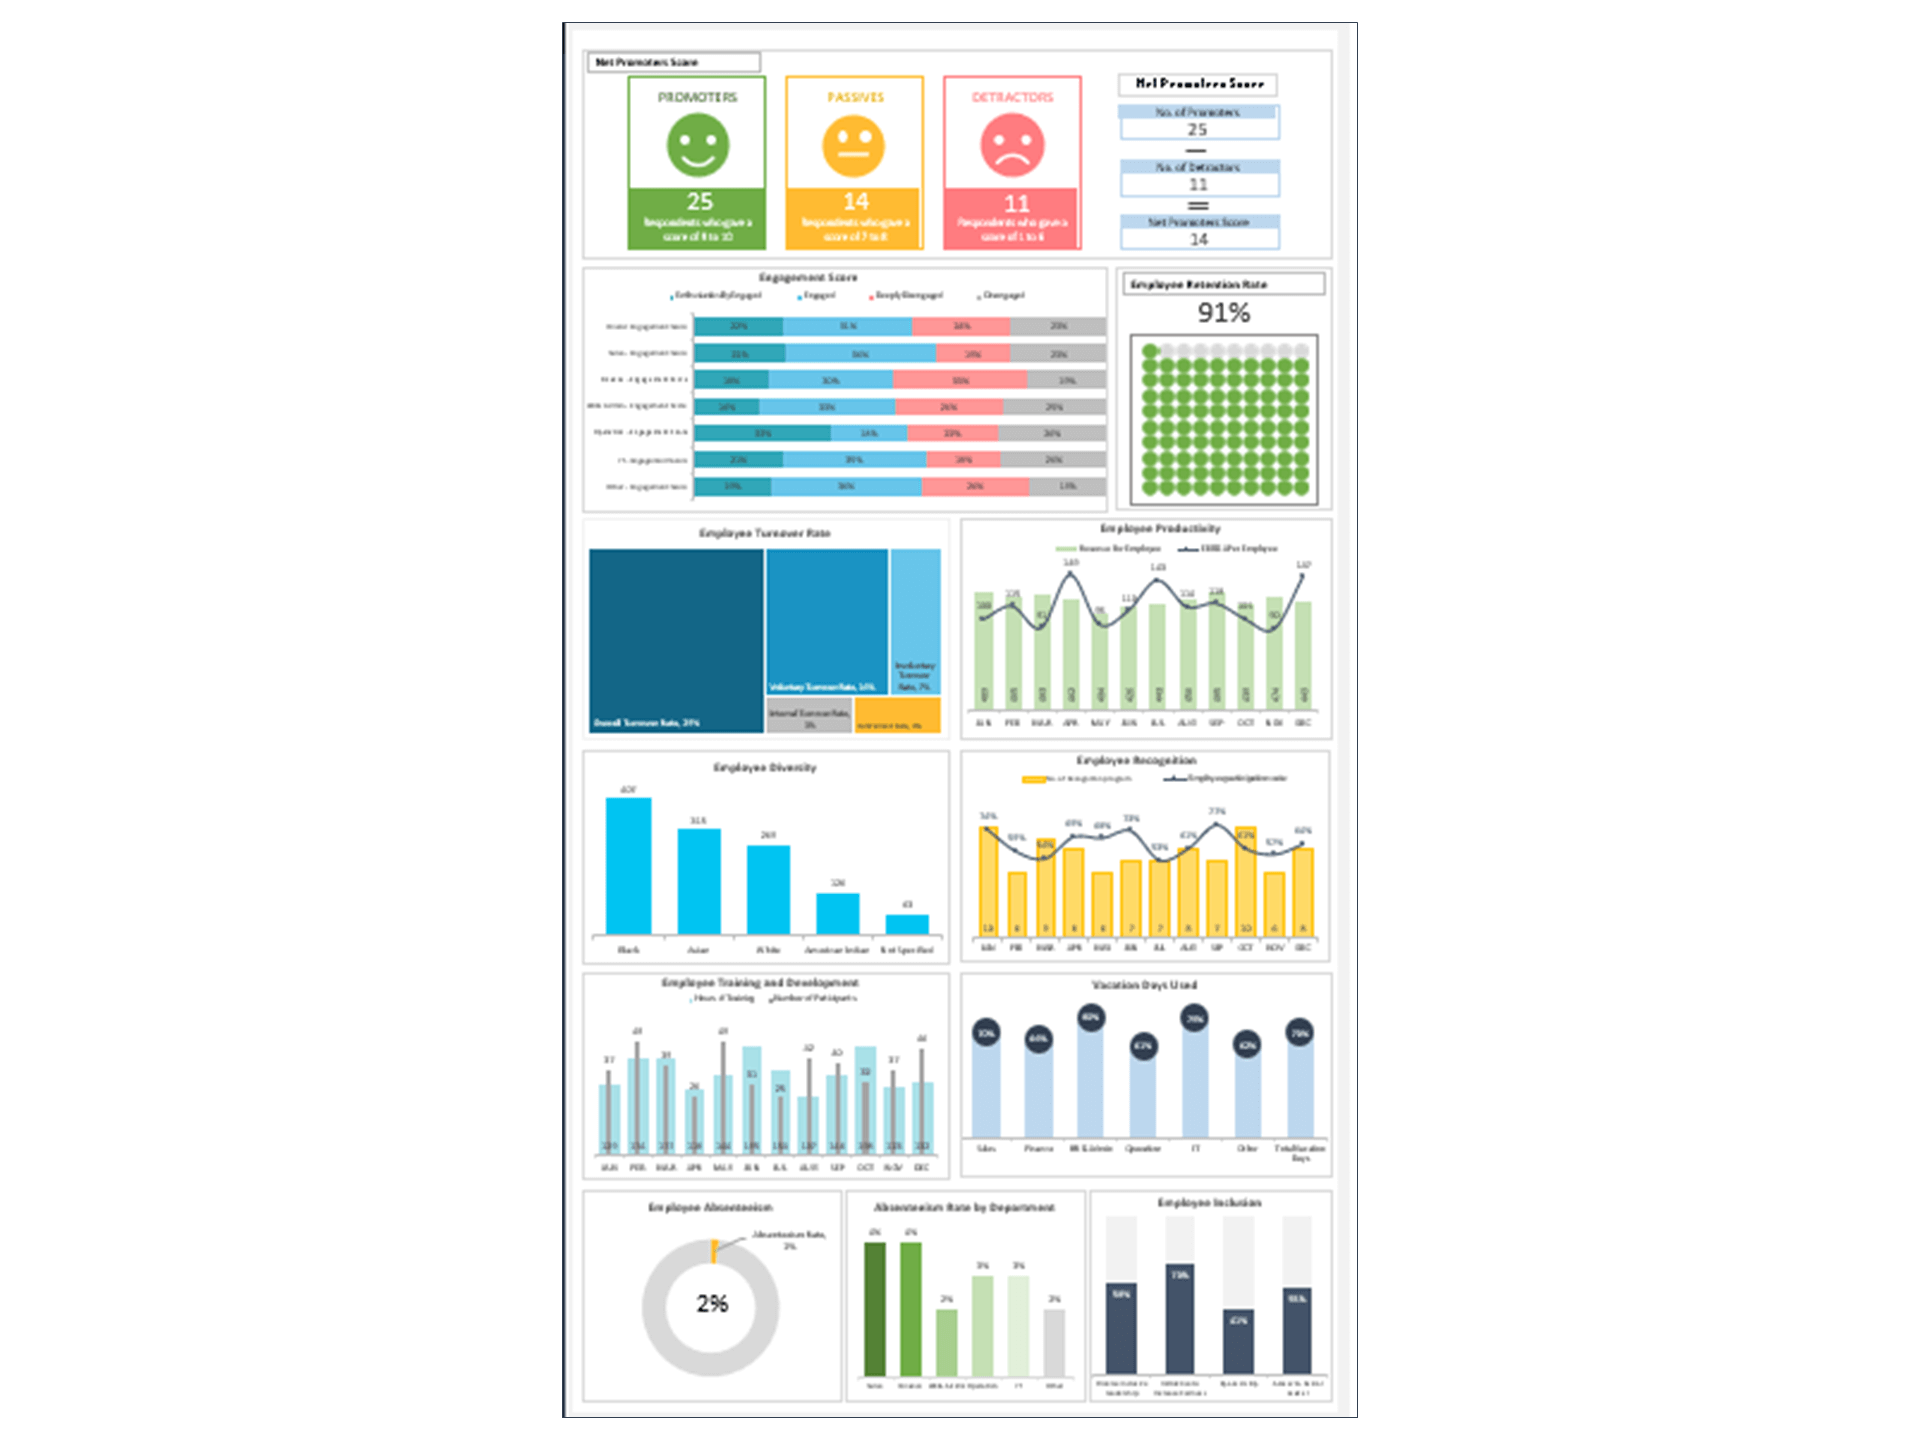
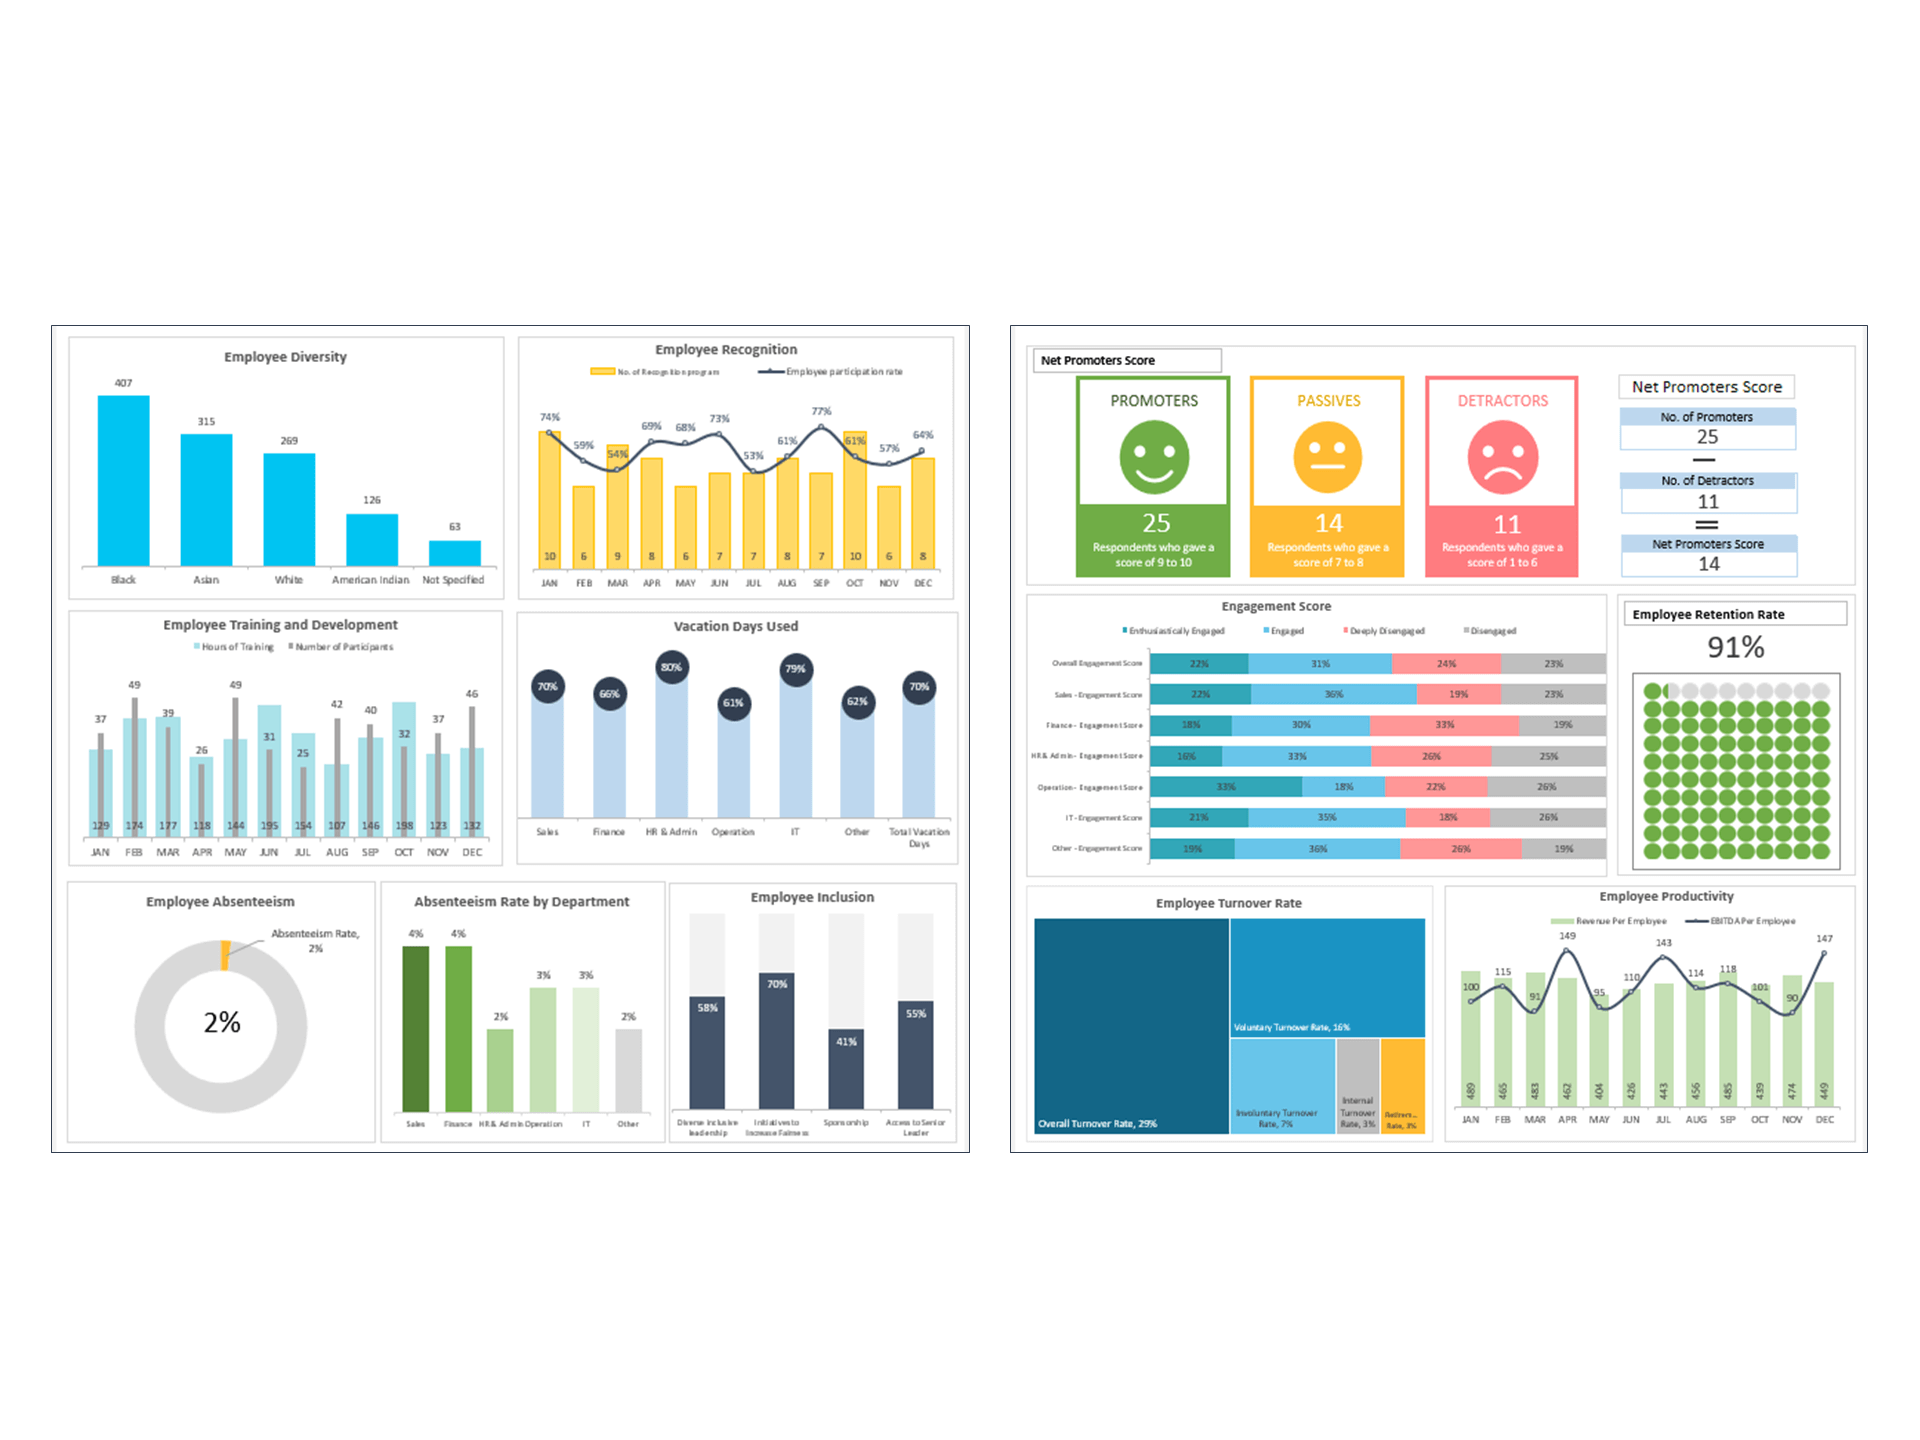
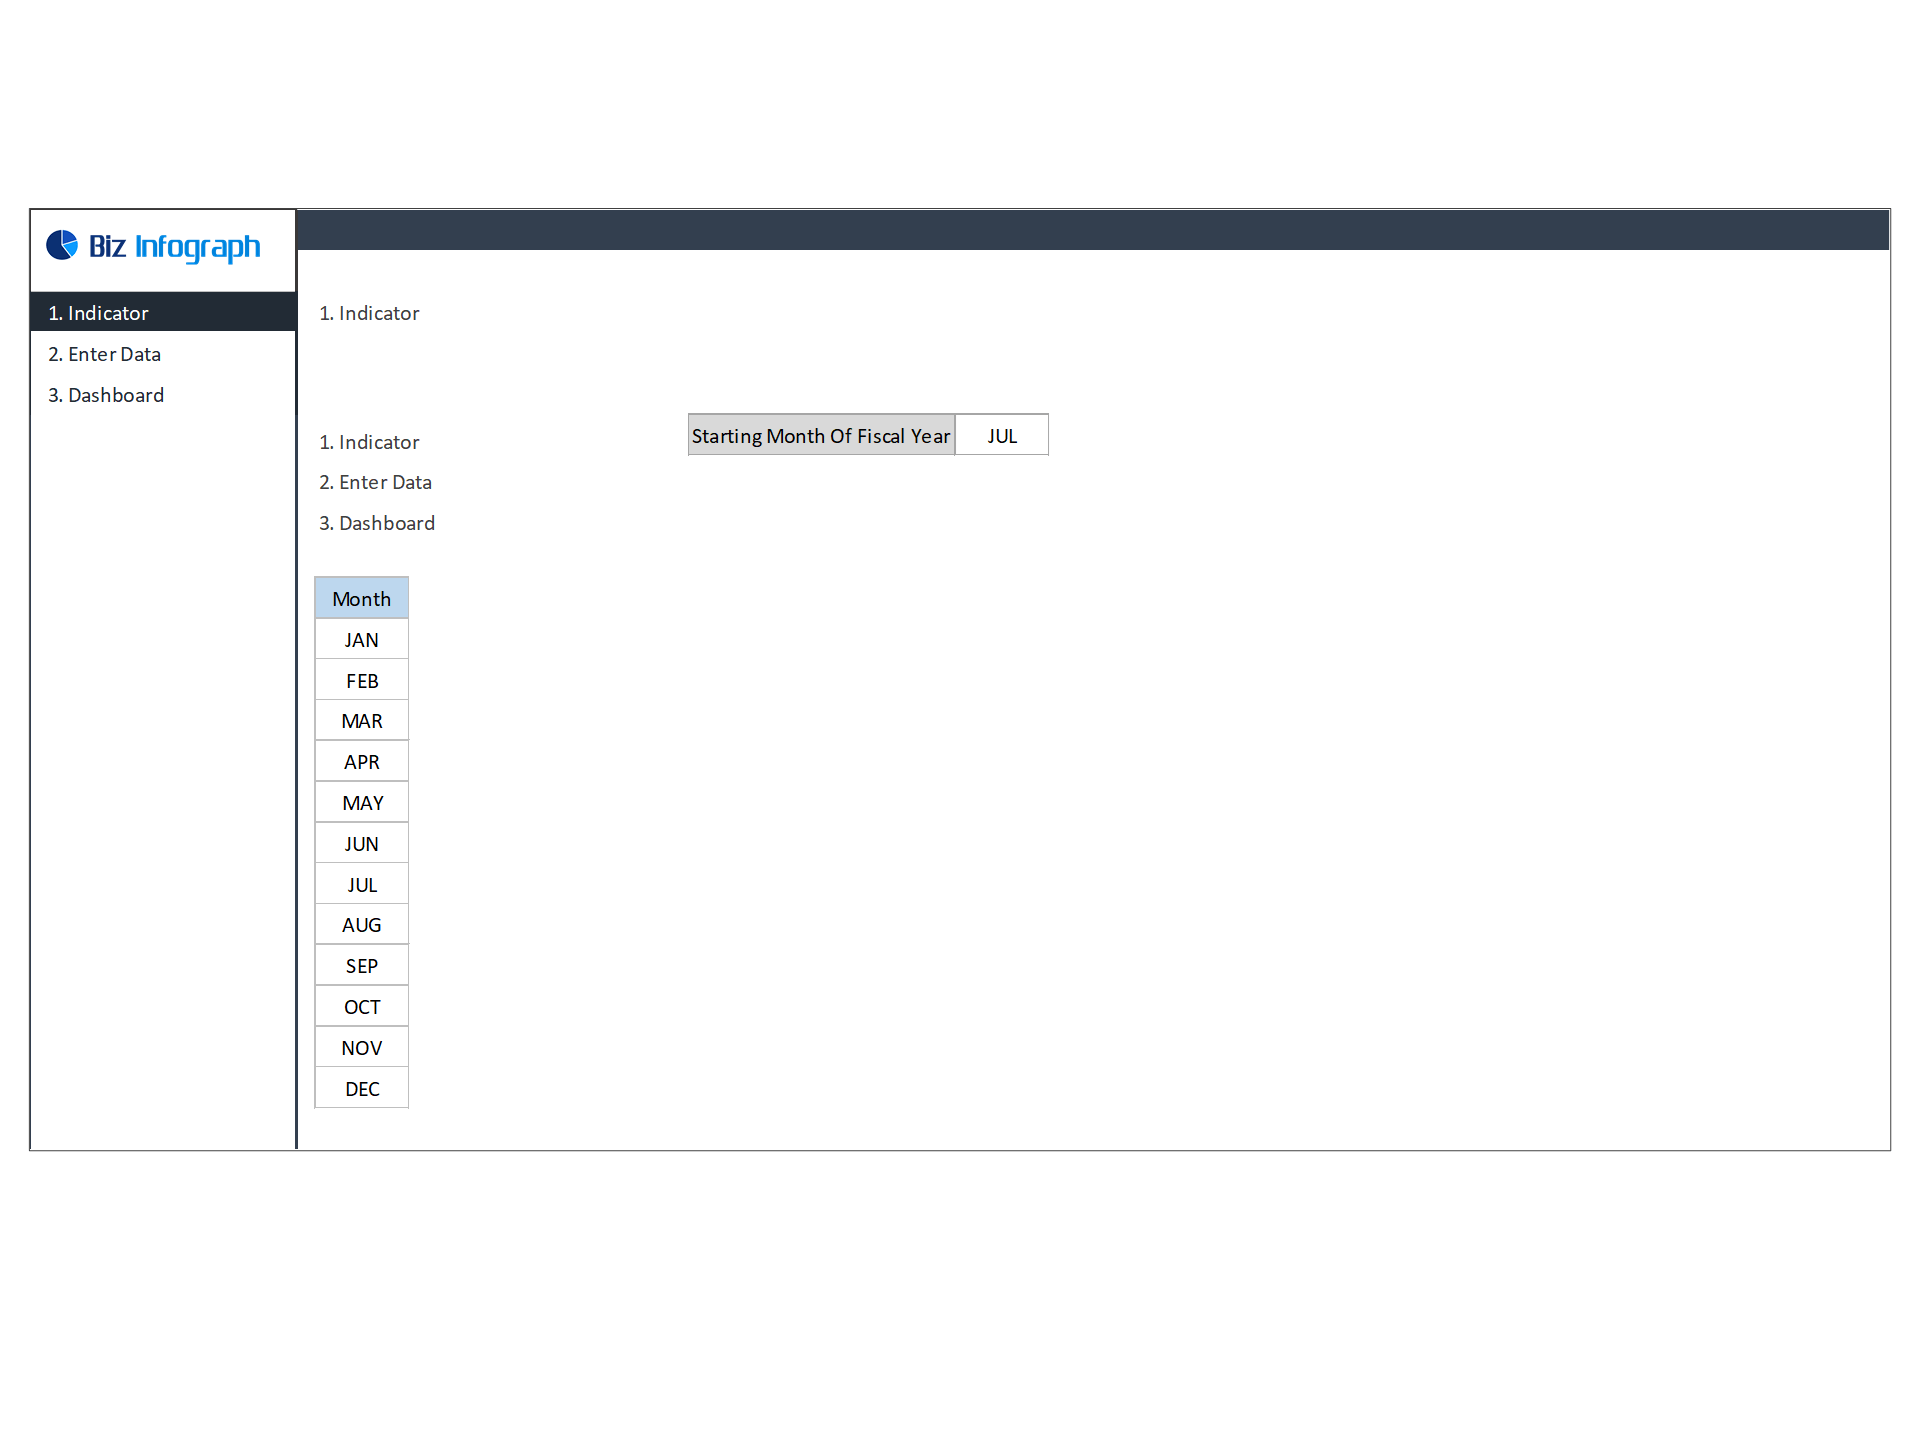
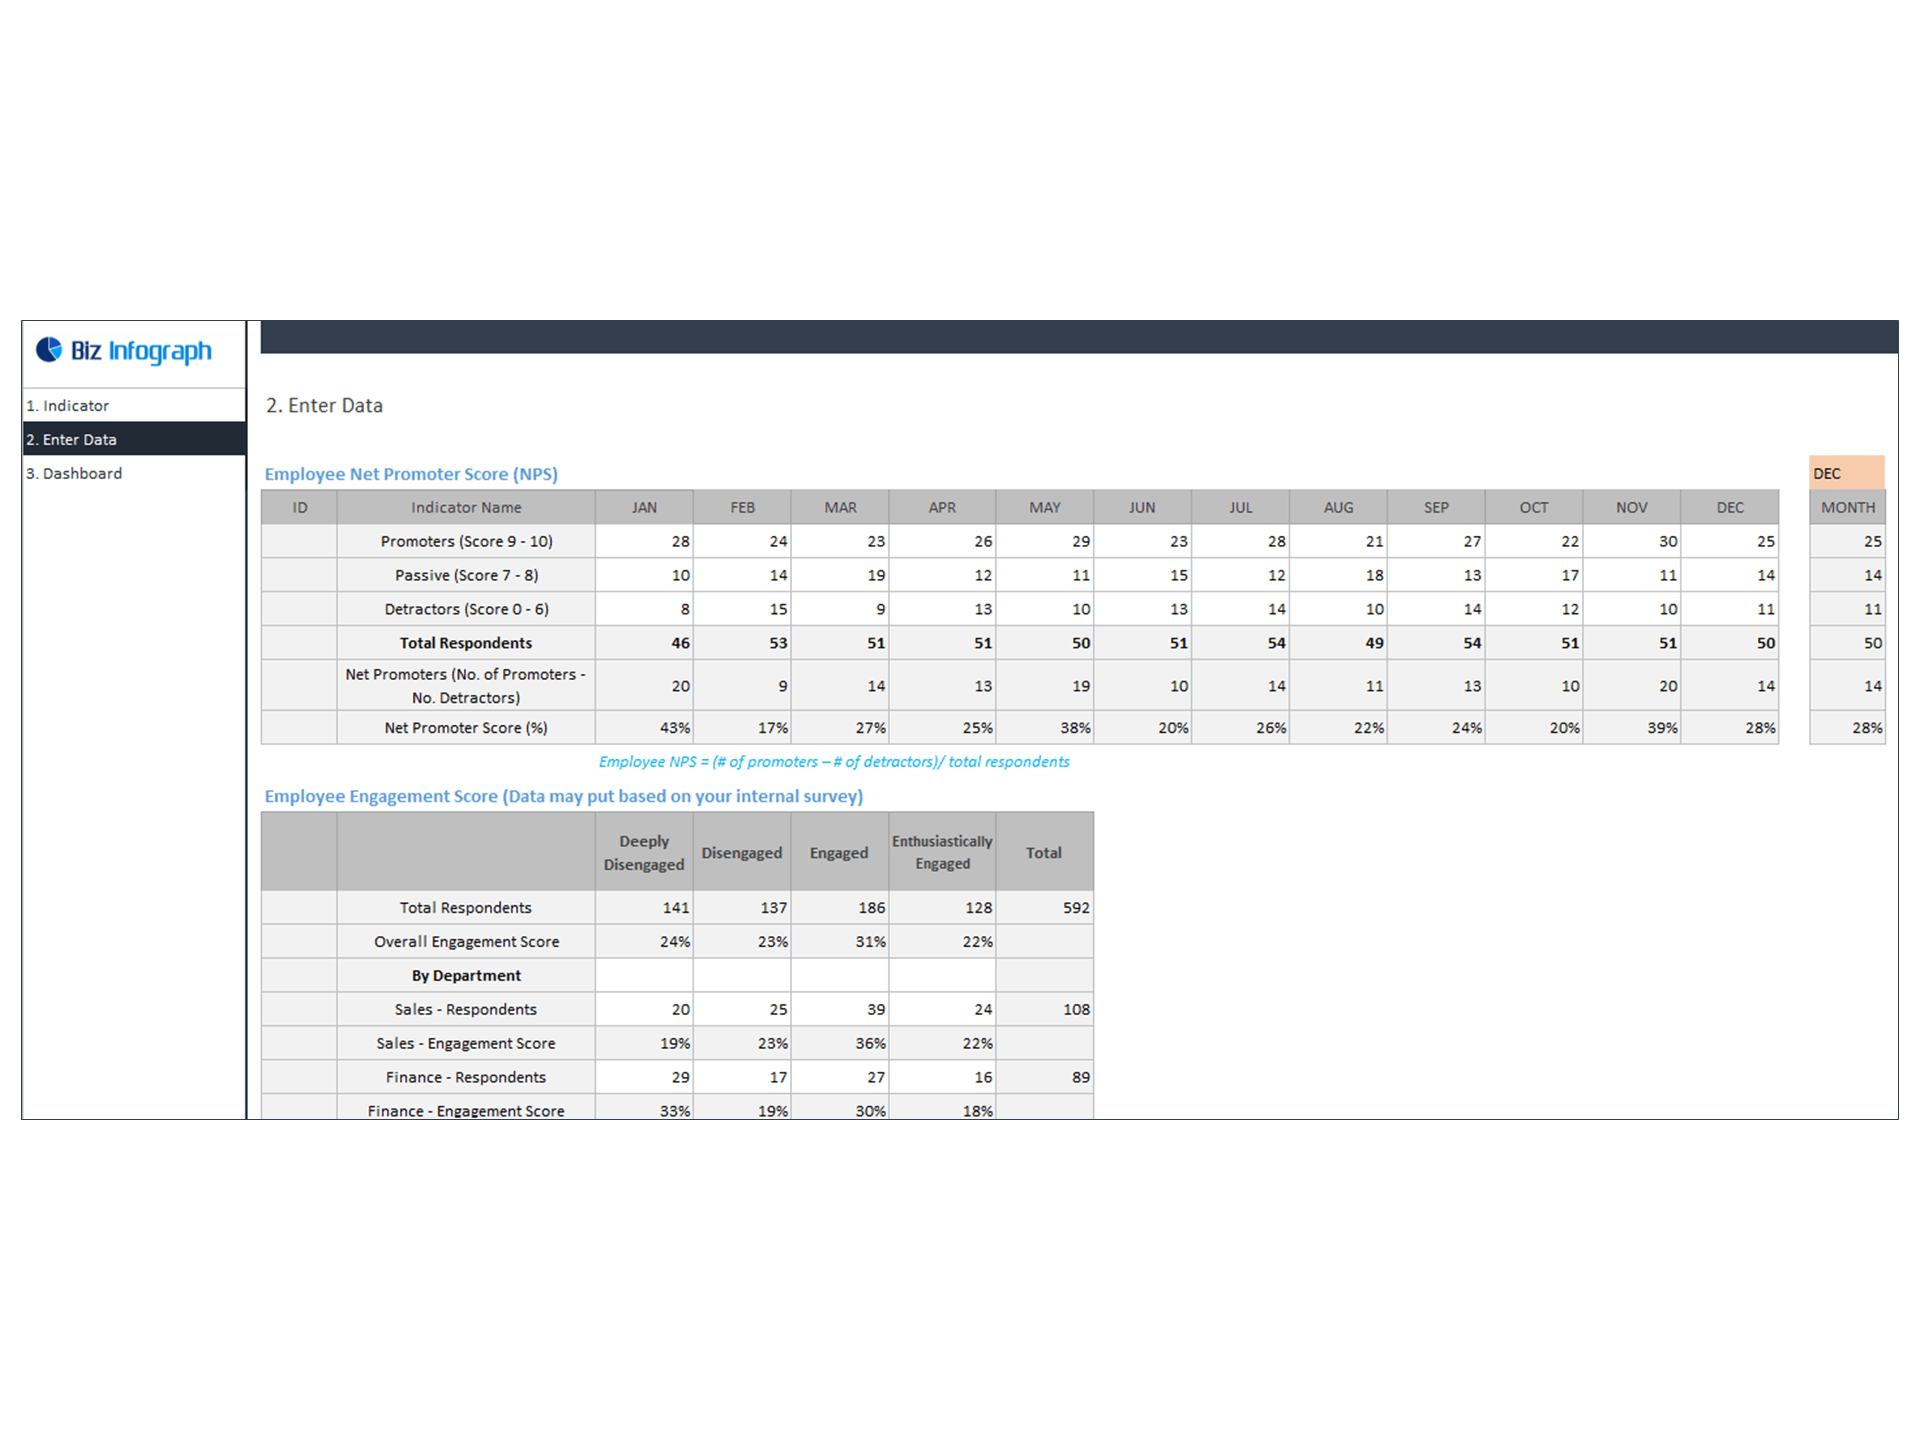
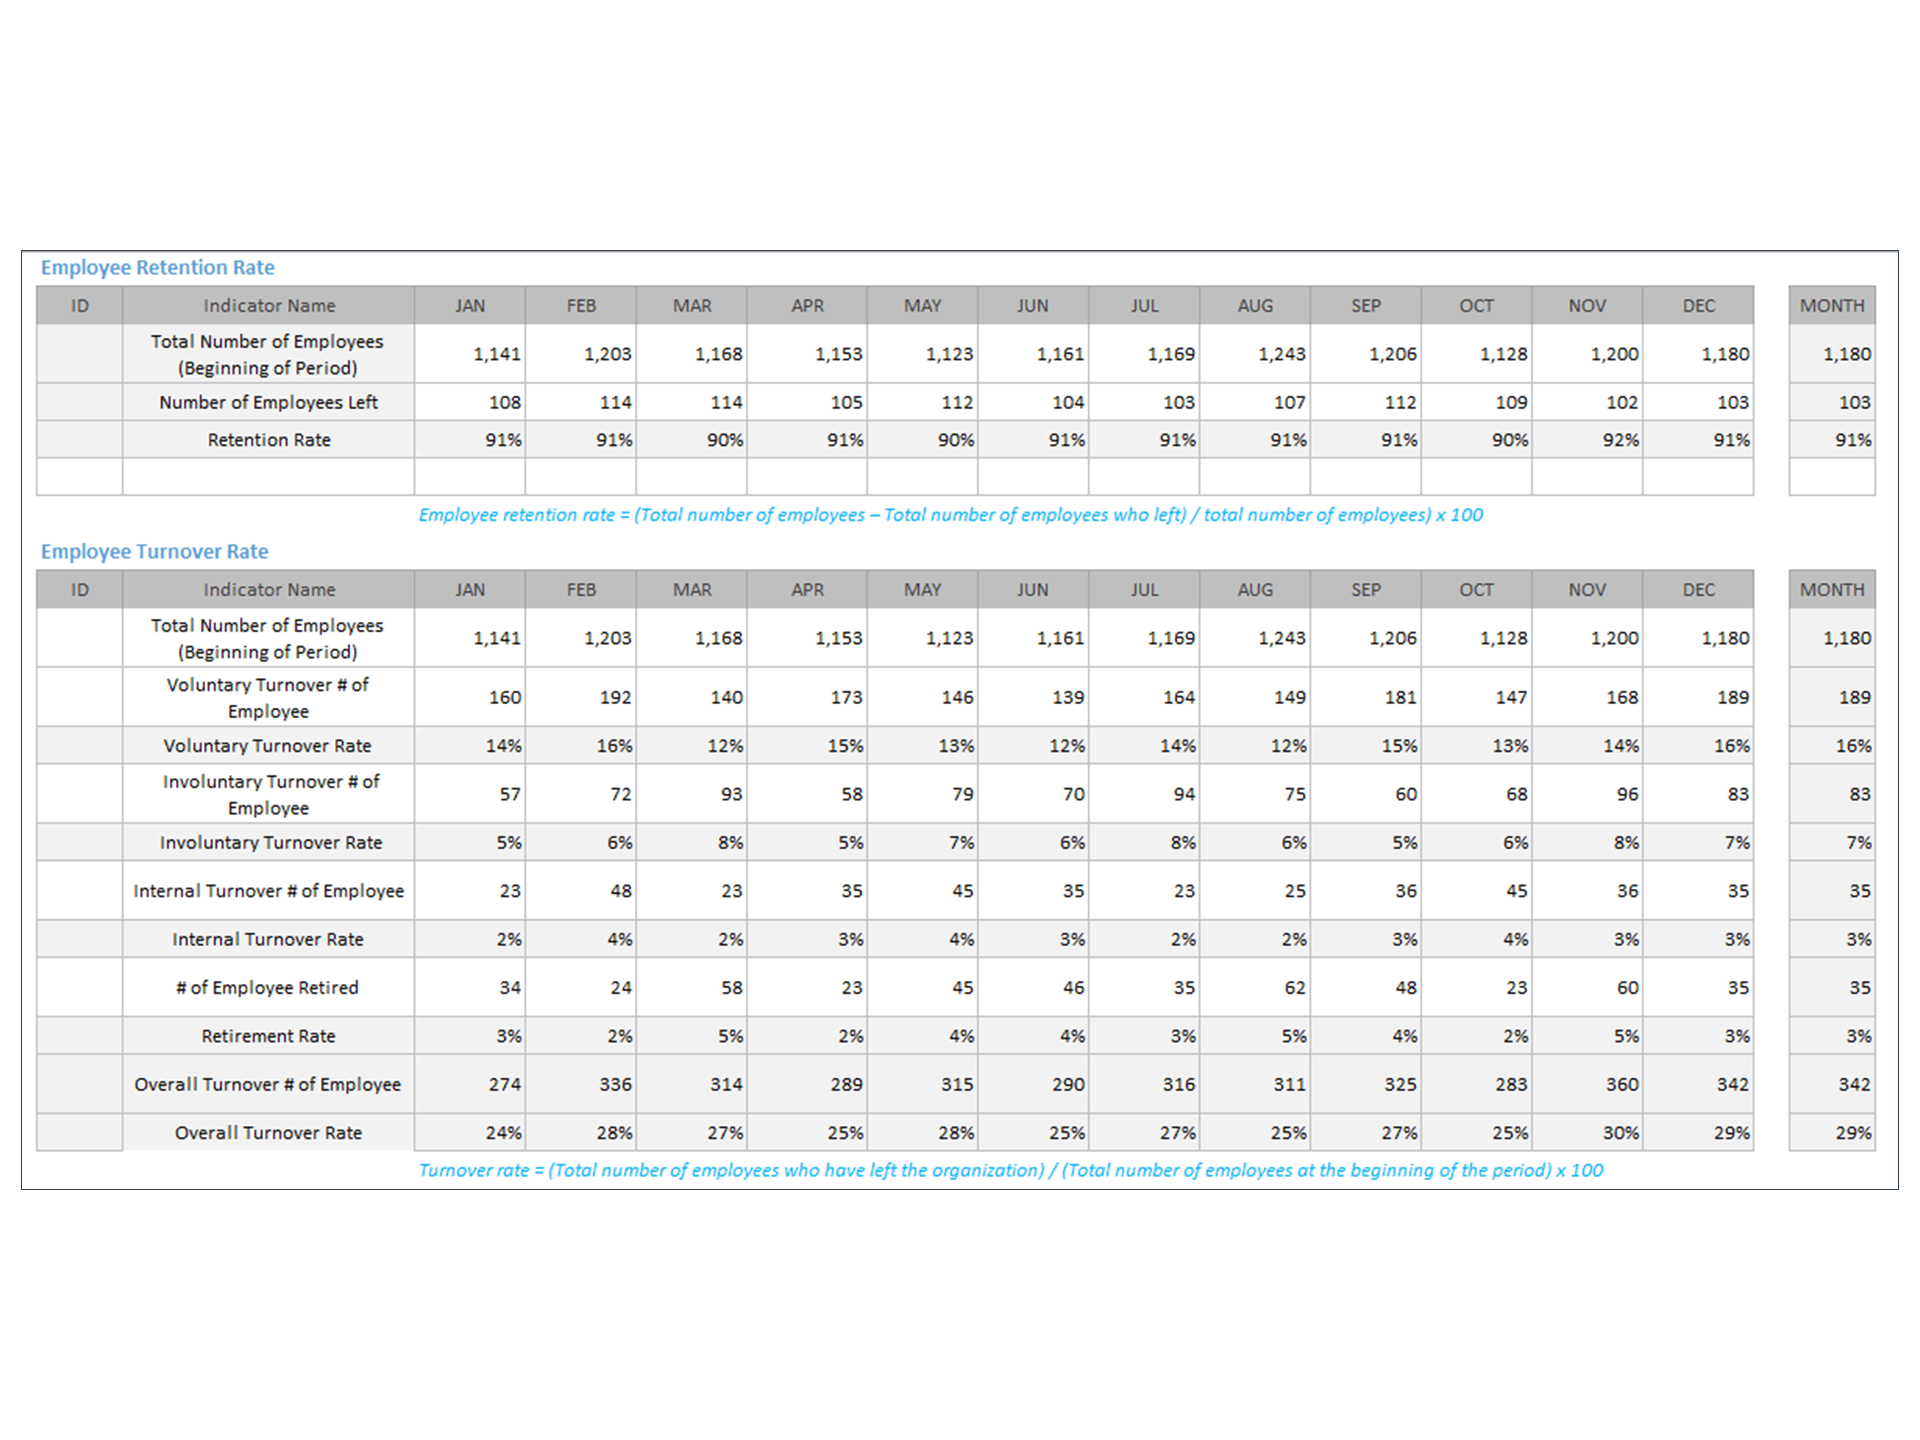
Employee Engagement Dashboard Template
Track Visualize HR Metrics. Fully Editable. No VBA/Macro. Our Employee Engagement Dashboard.
Biz Infograph is bringing clients a range of high-quality, well-designed, and easy-to-use professionally designed slides and dashboards.Follow 10
