
Originally published: 06/03/2024 13:09
Last version published: 11/03/2024 08:25
Publication number: ELQ-82020-2
View all versions & Certificate
Last version published: 11/03/2024 08:25
Publication number: ELQ-82020-2
View all versions & Certificate

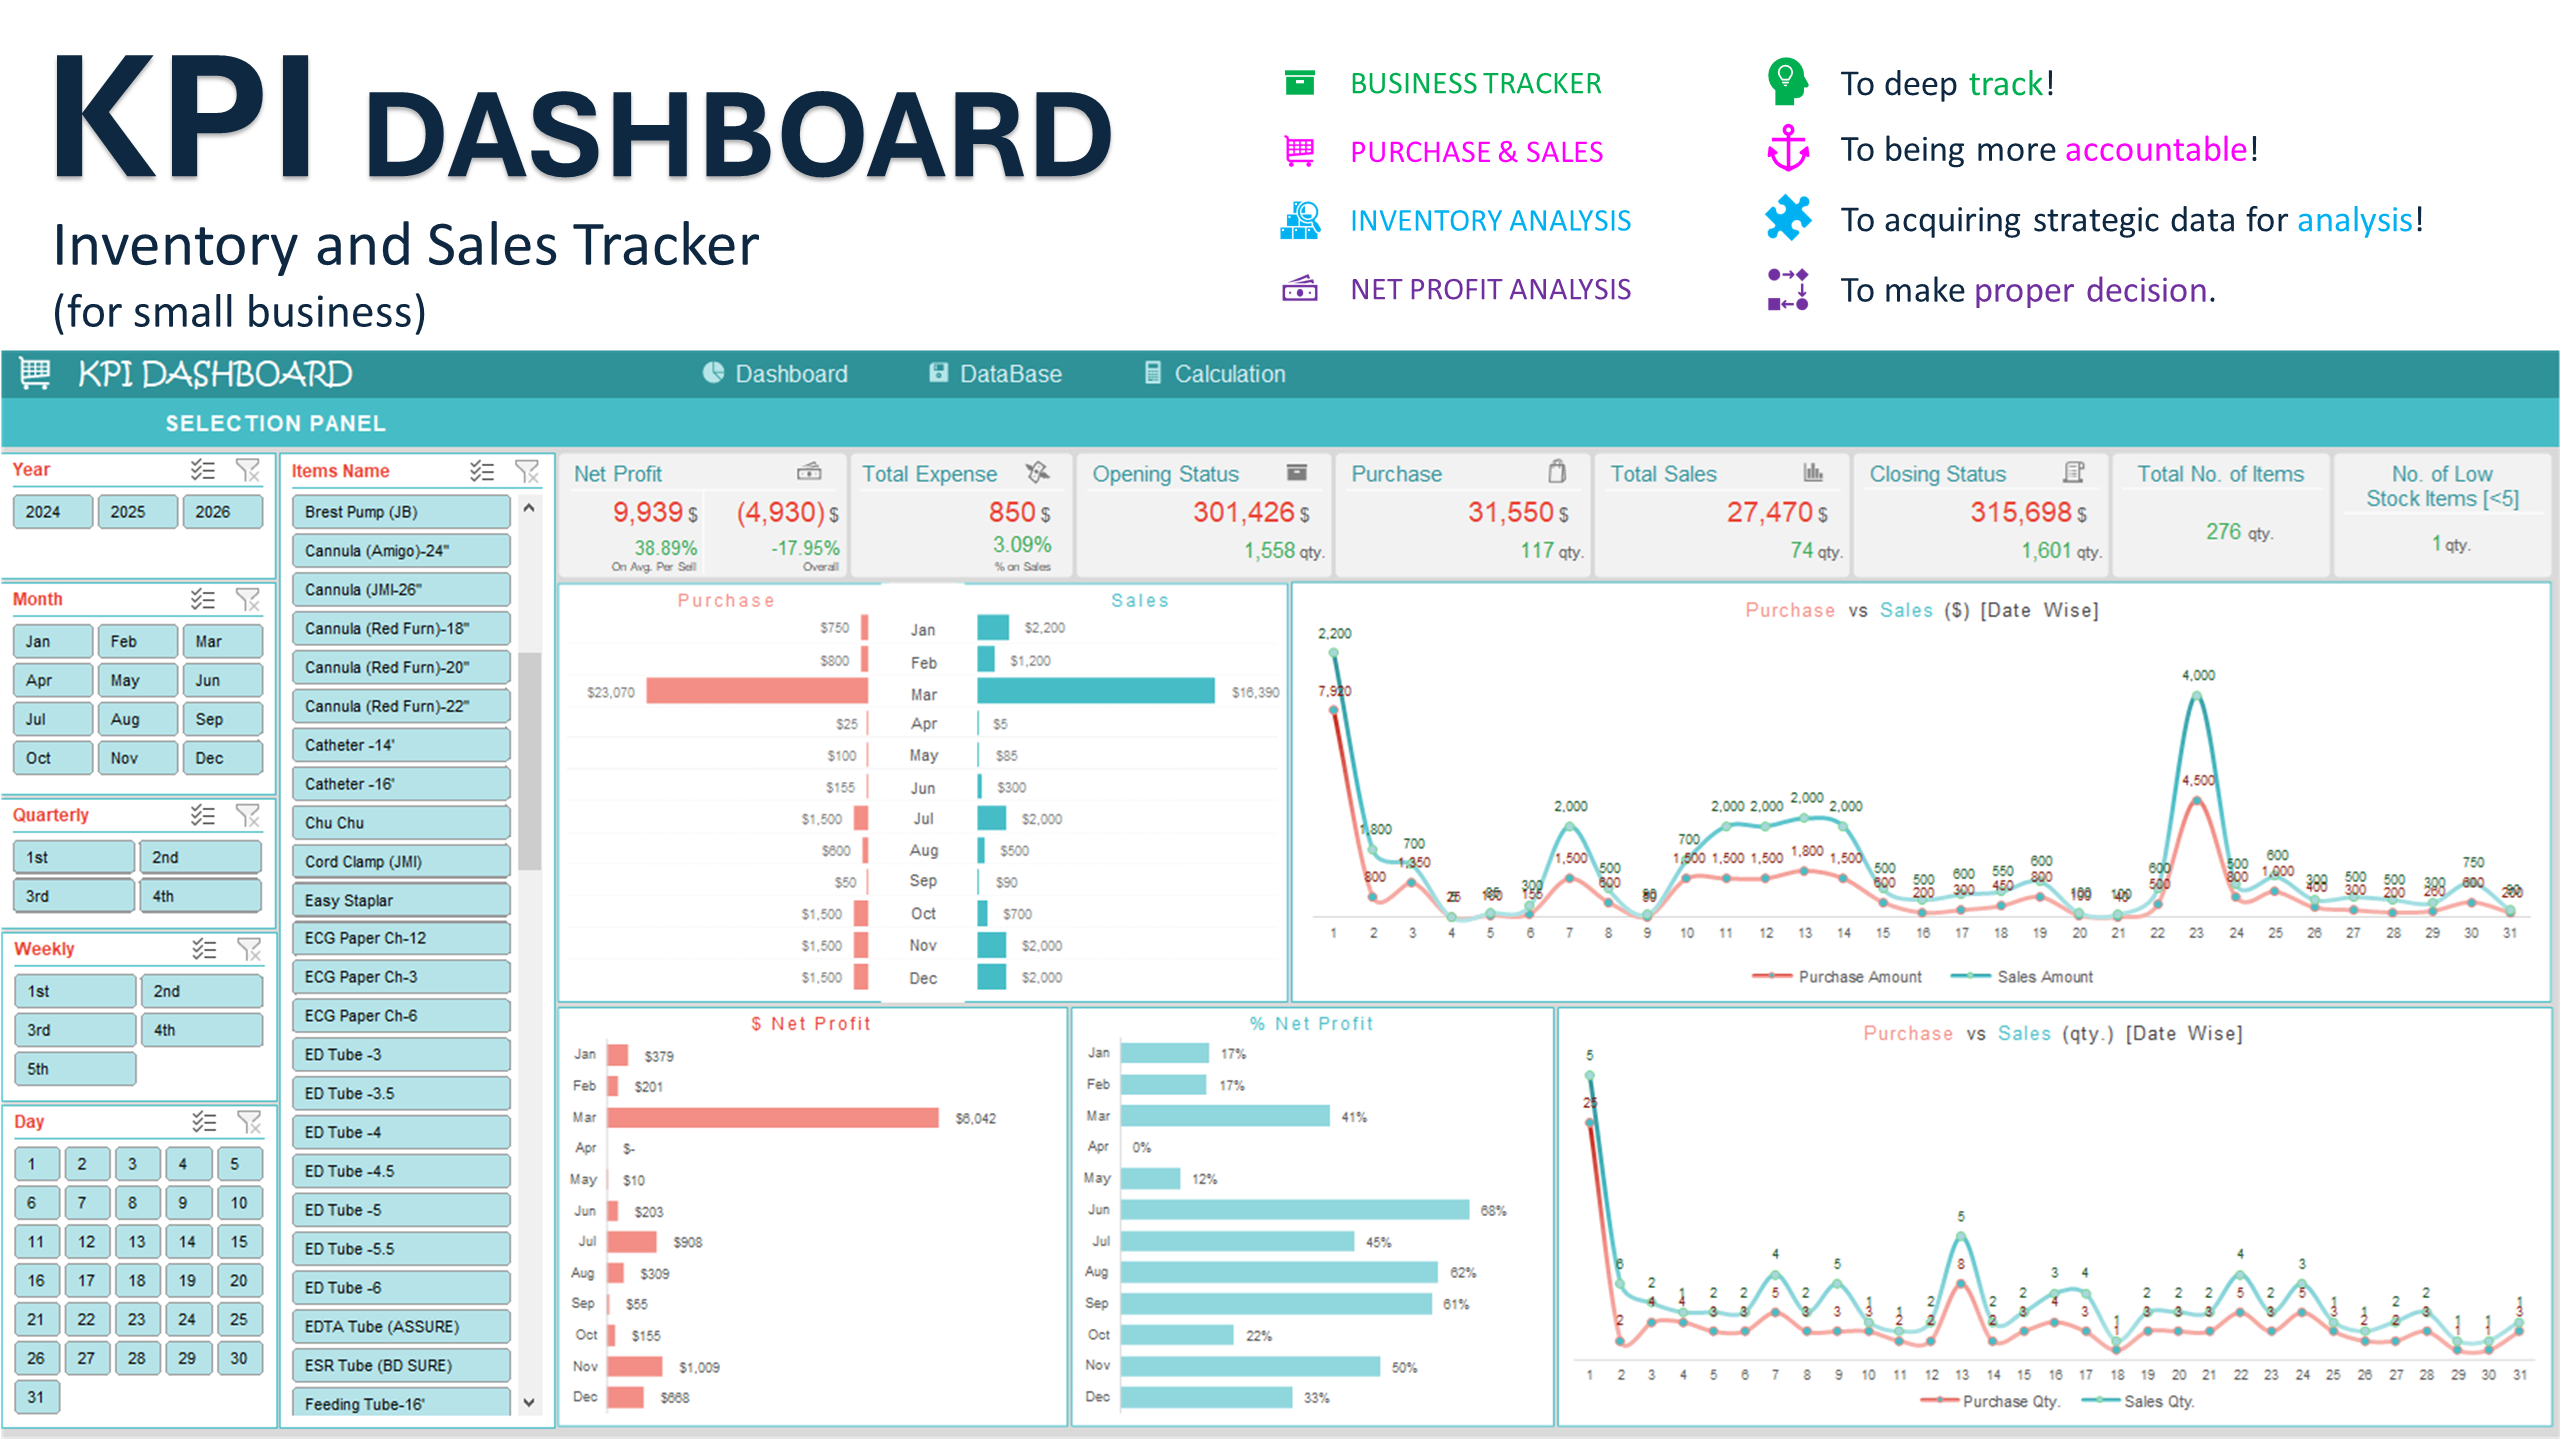
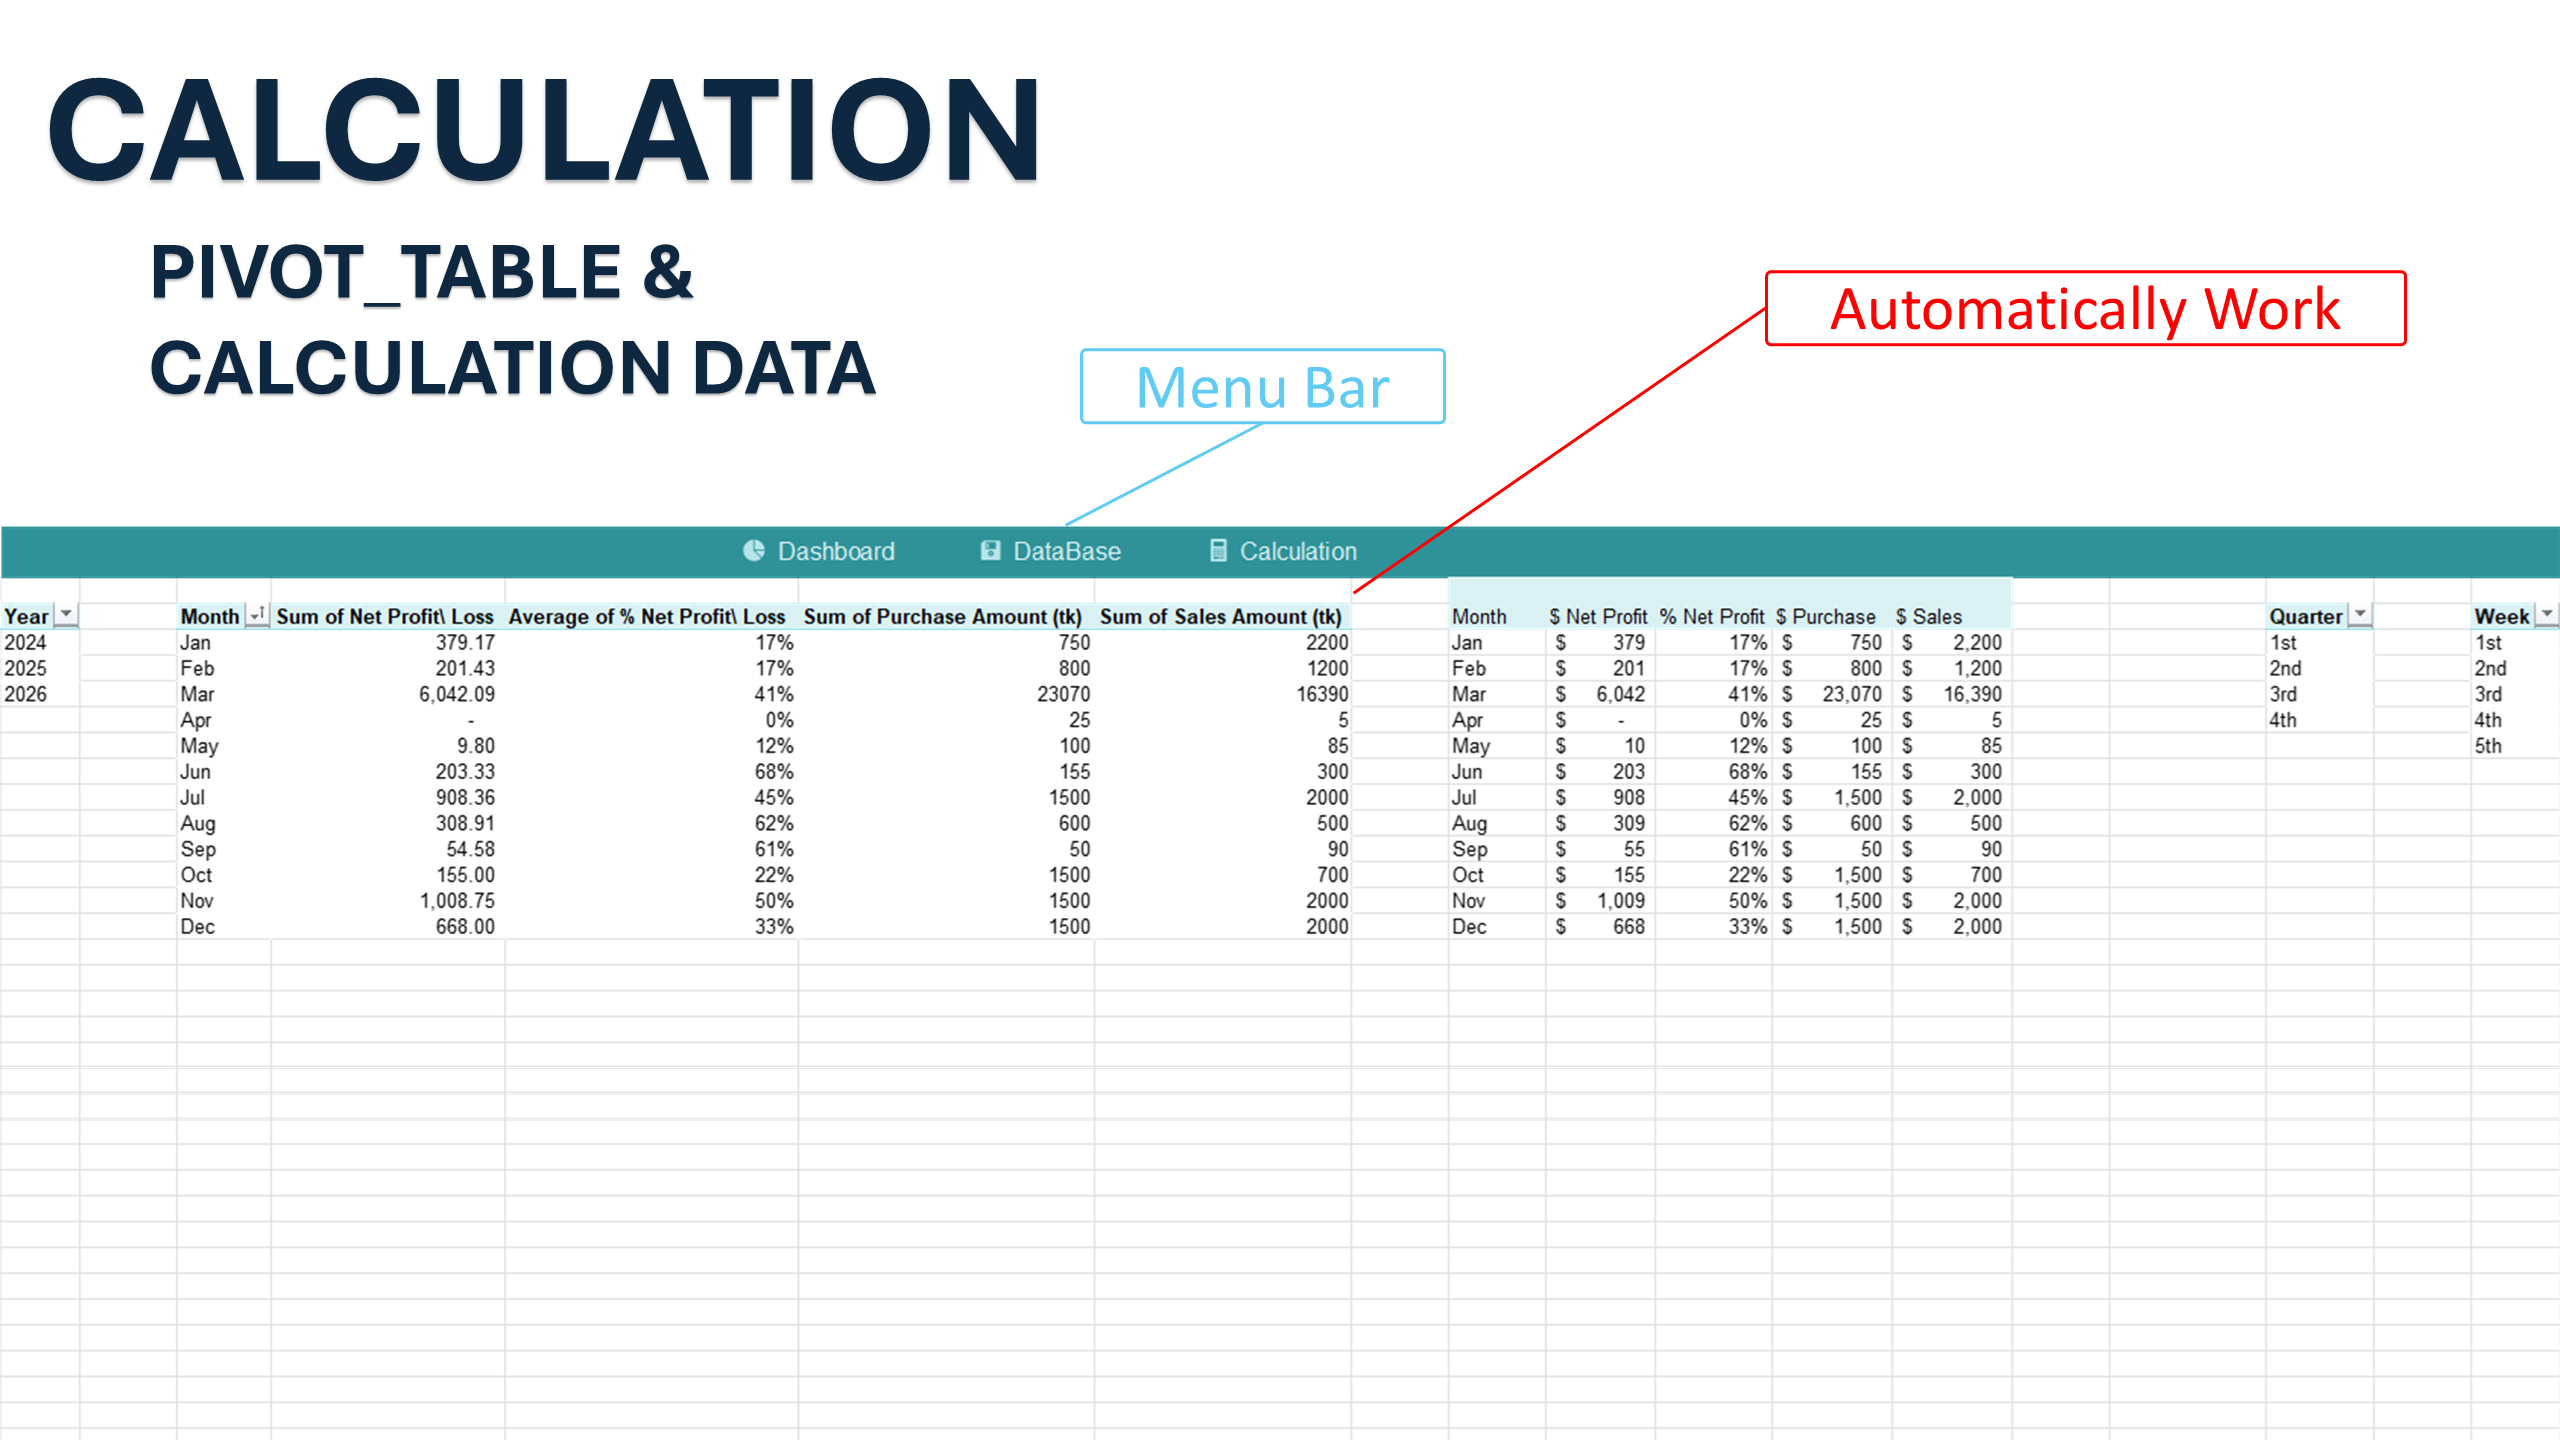
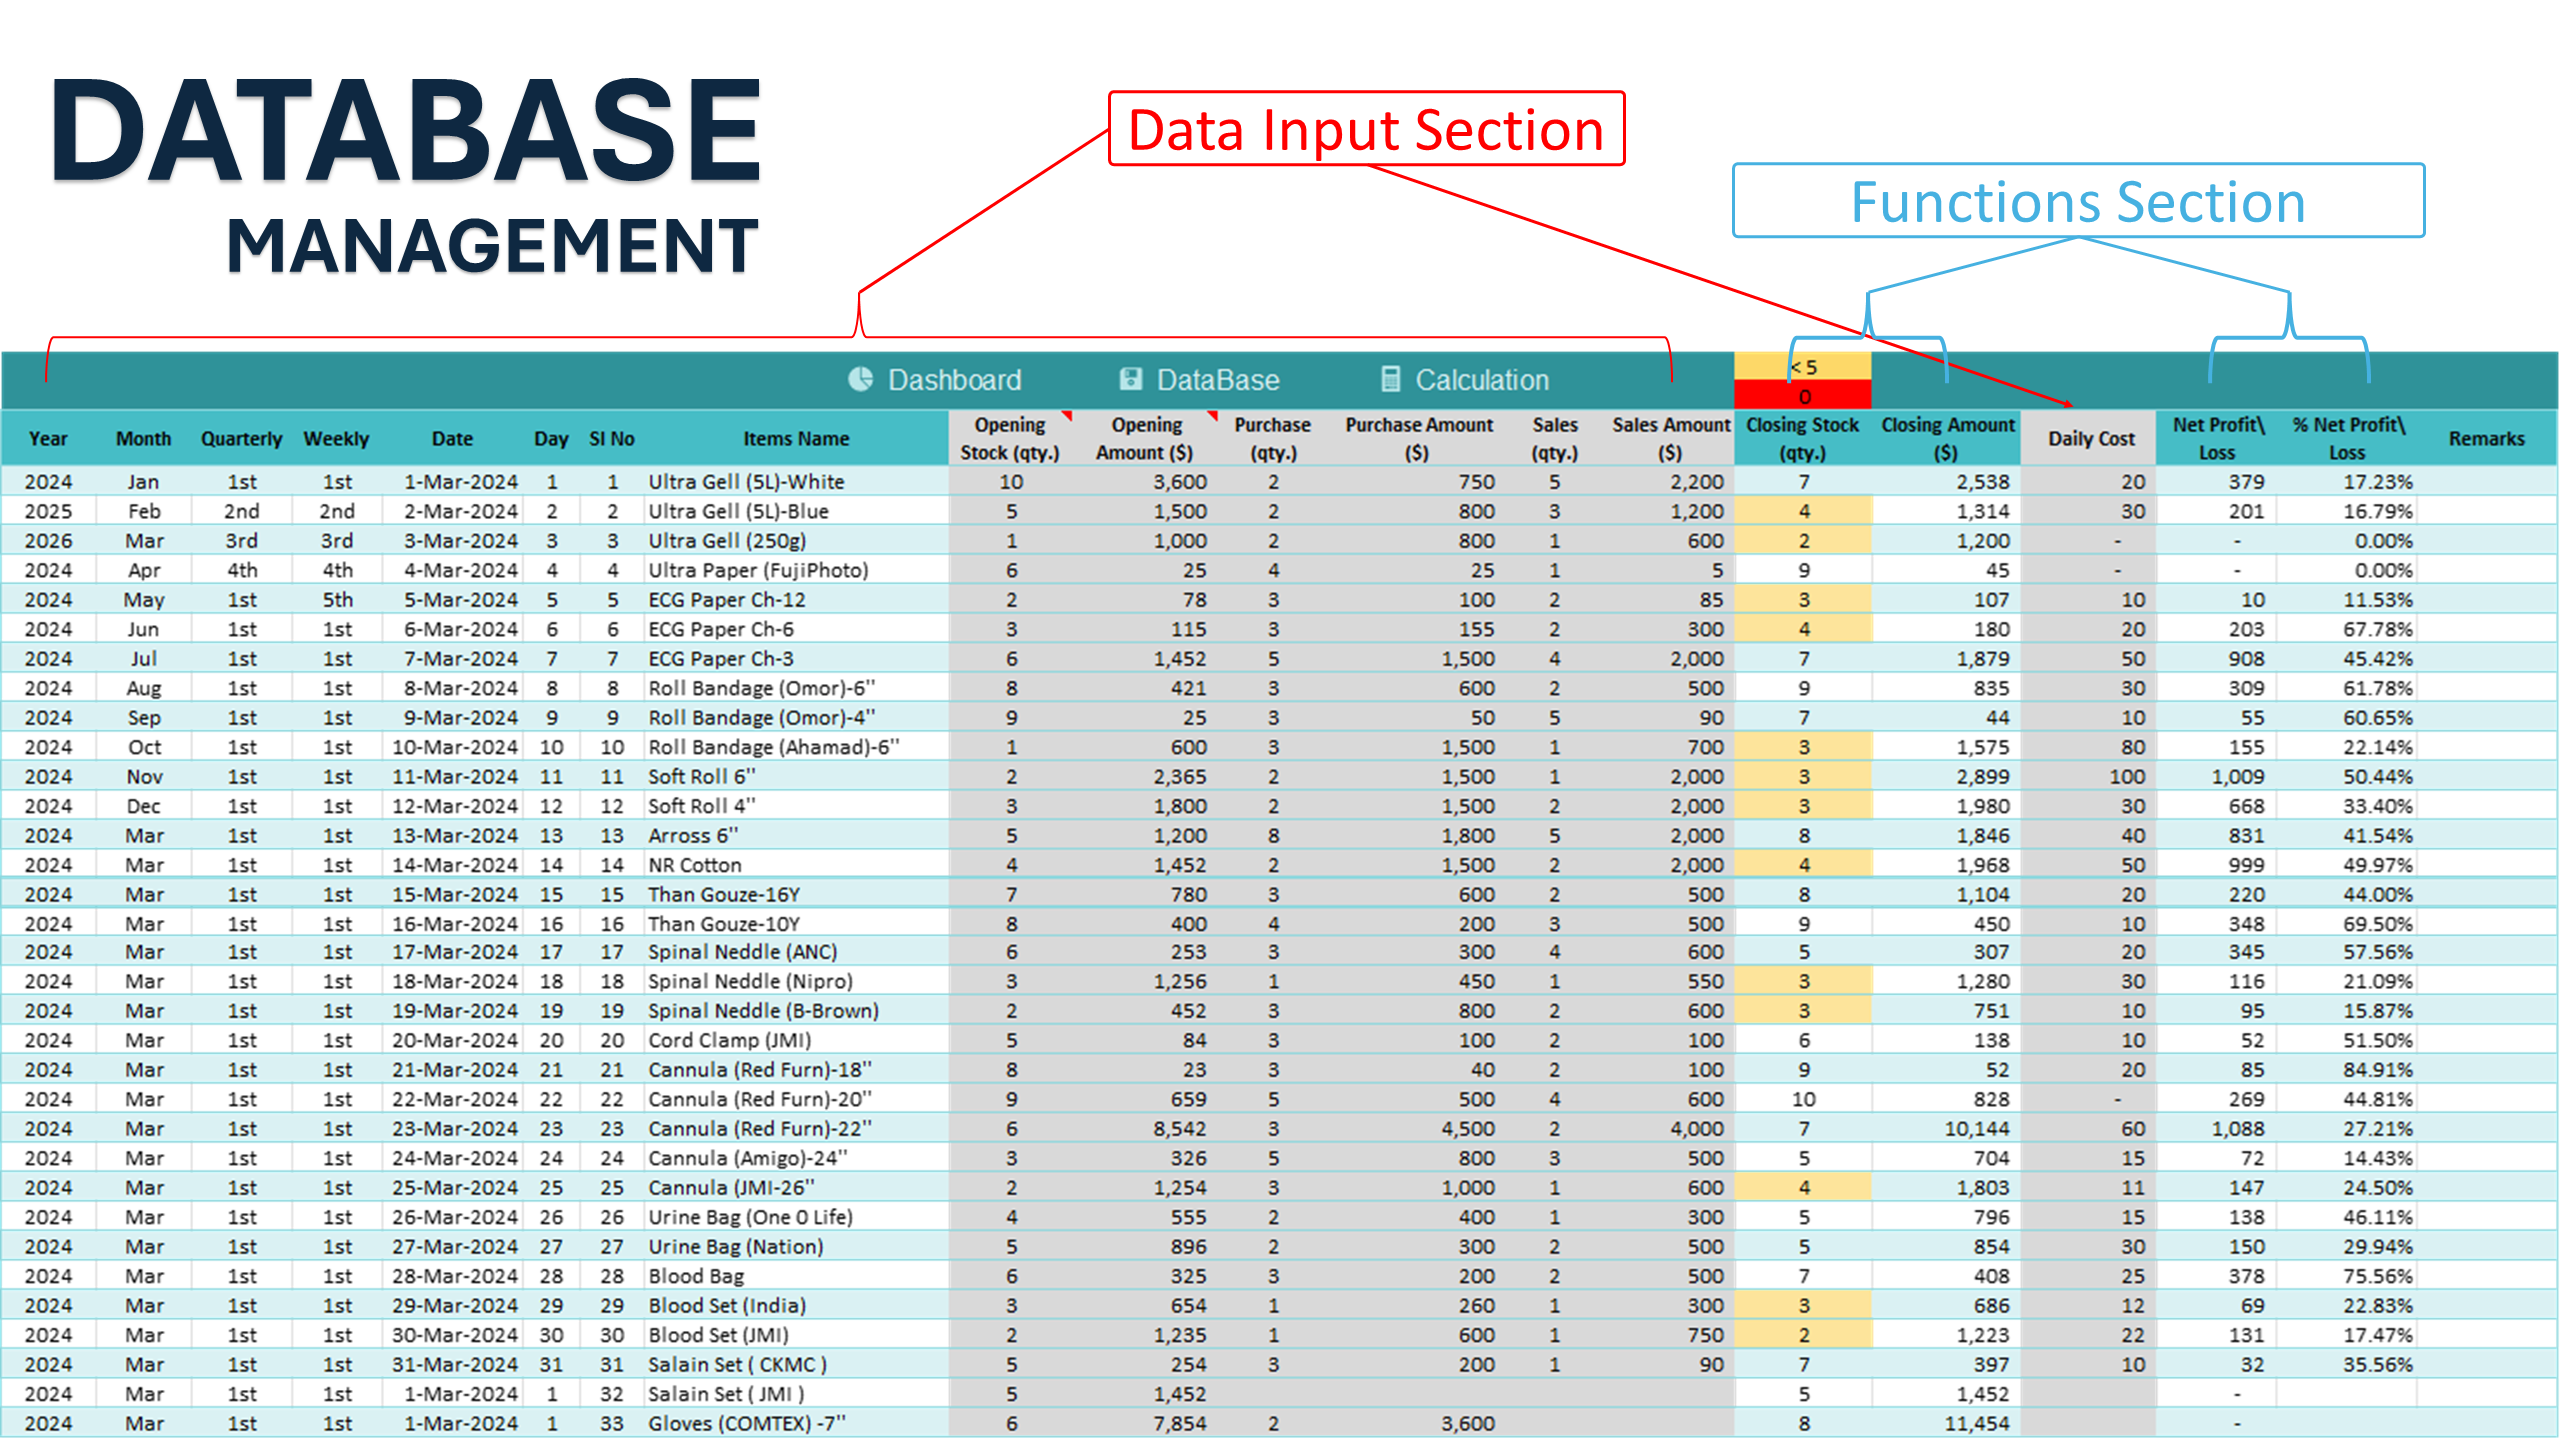
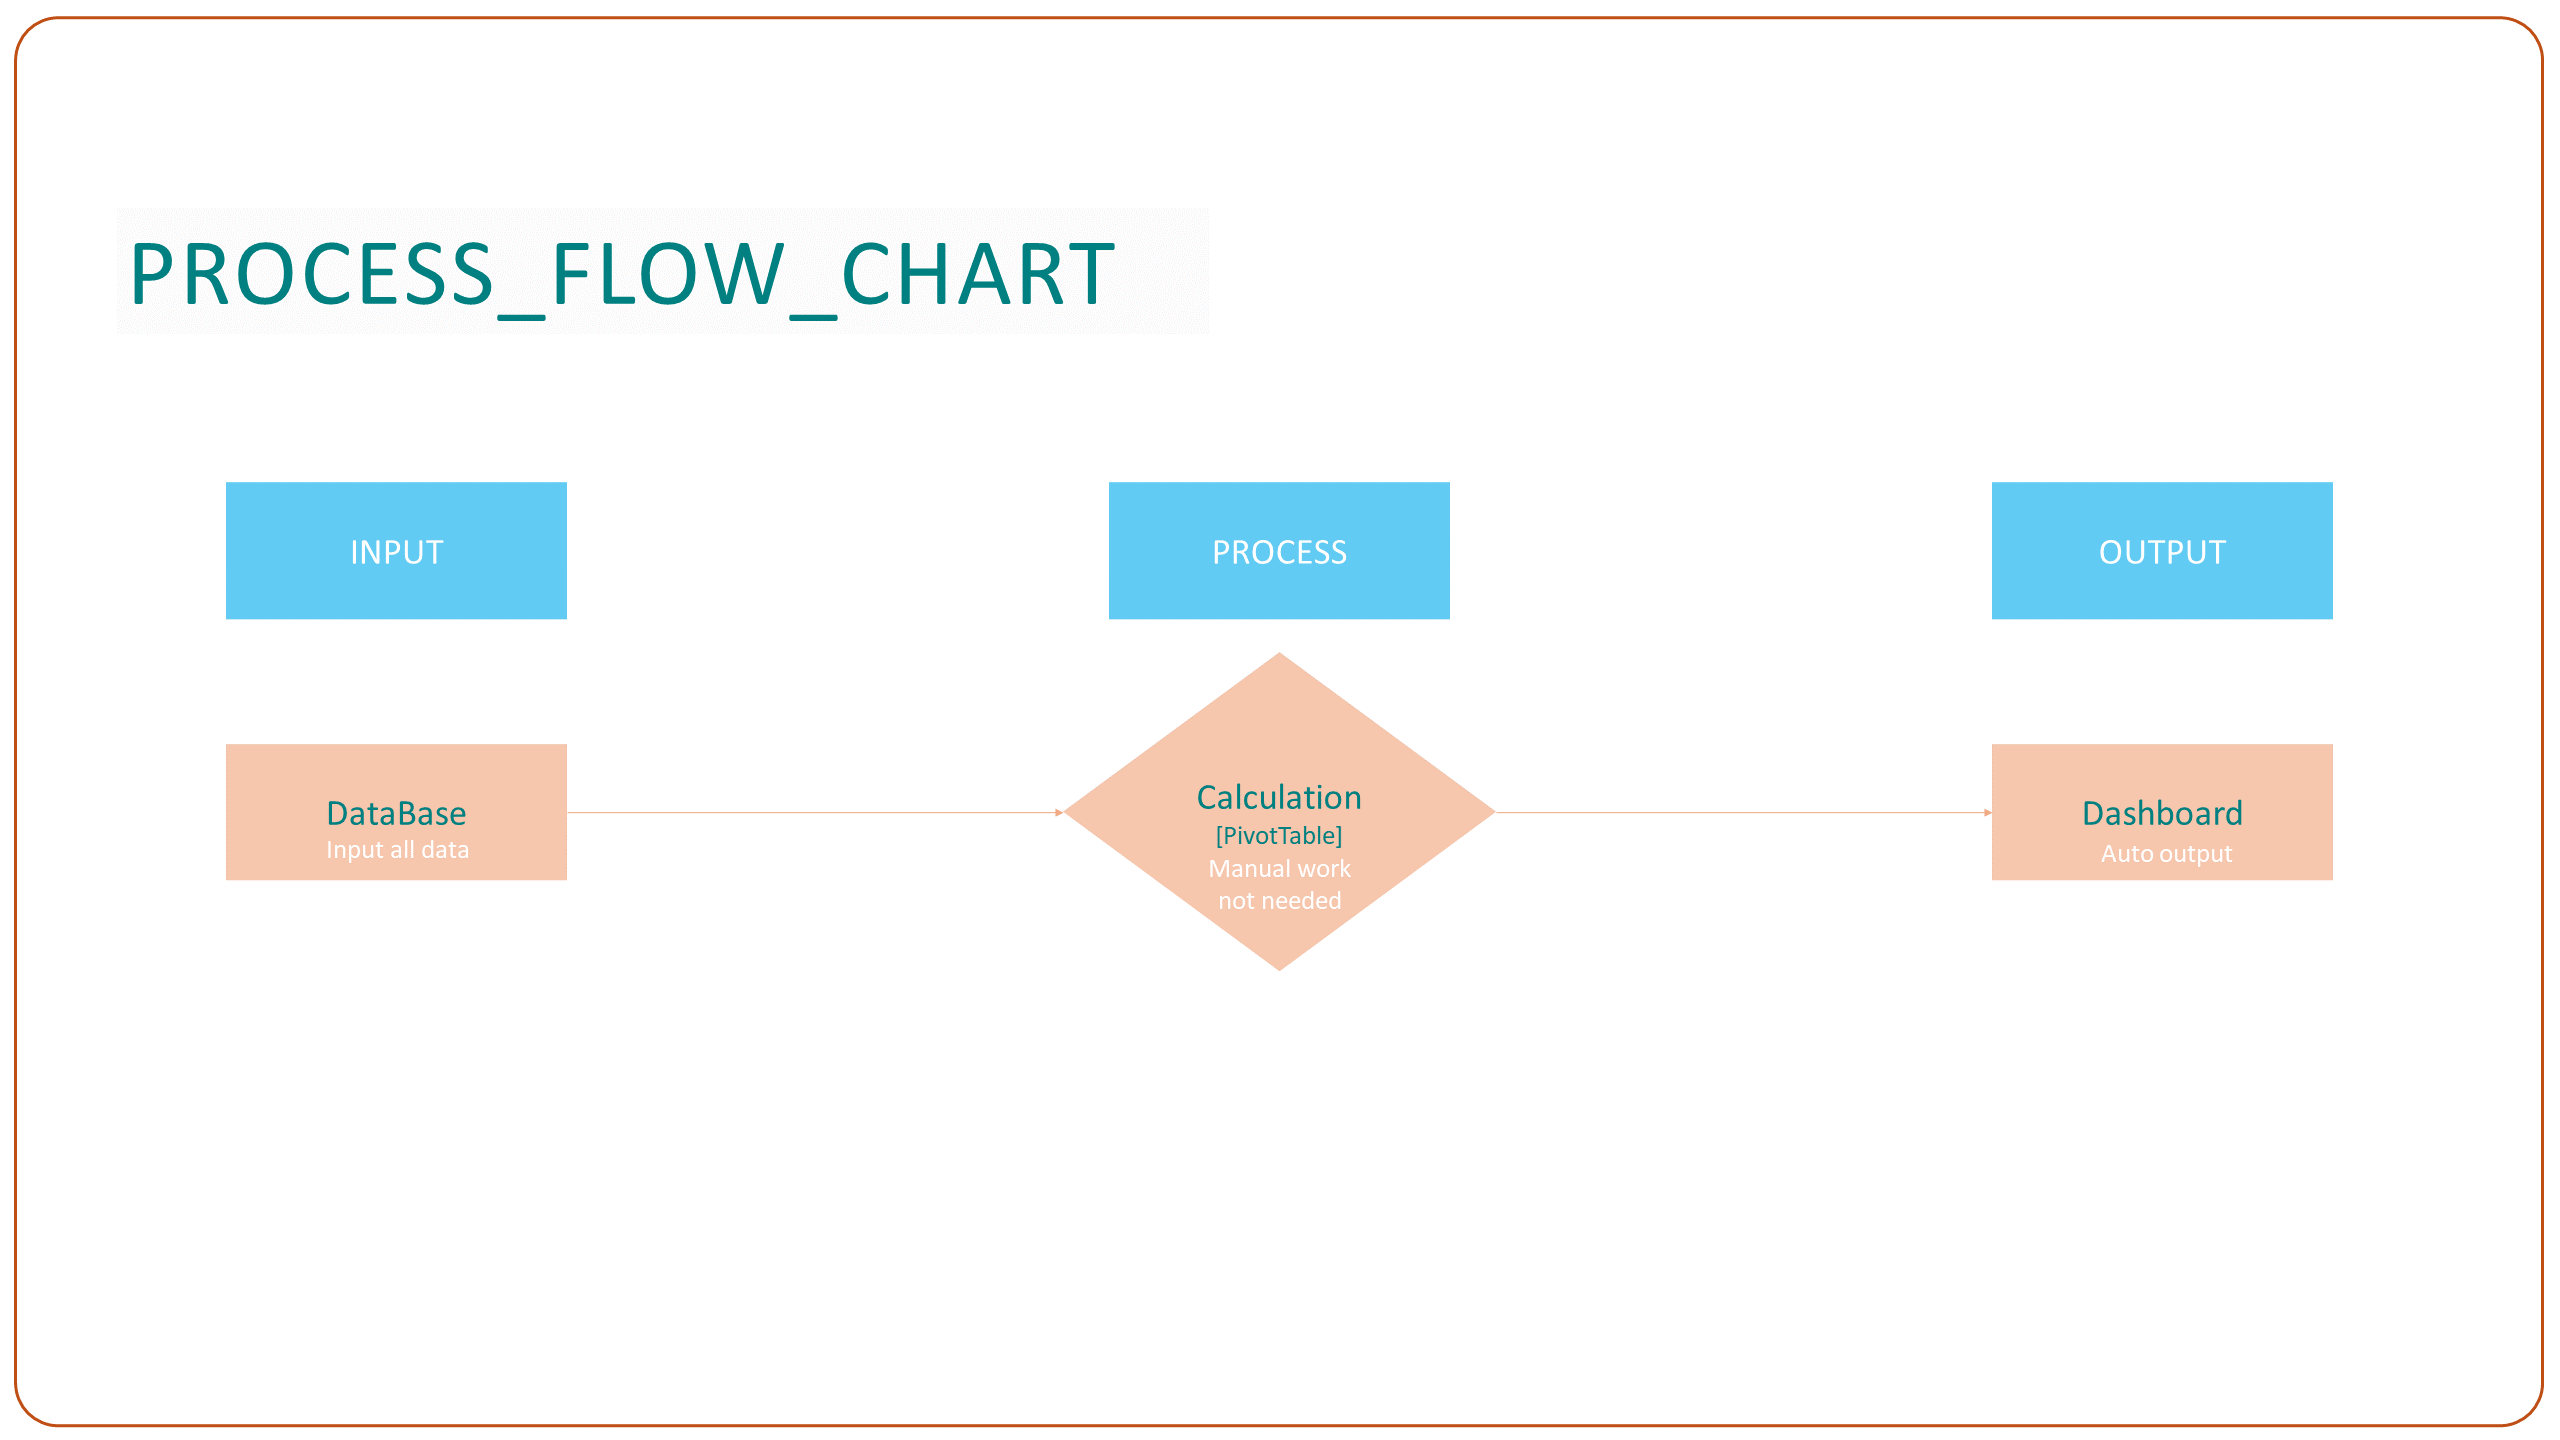
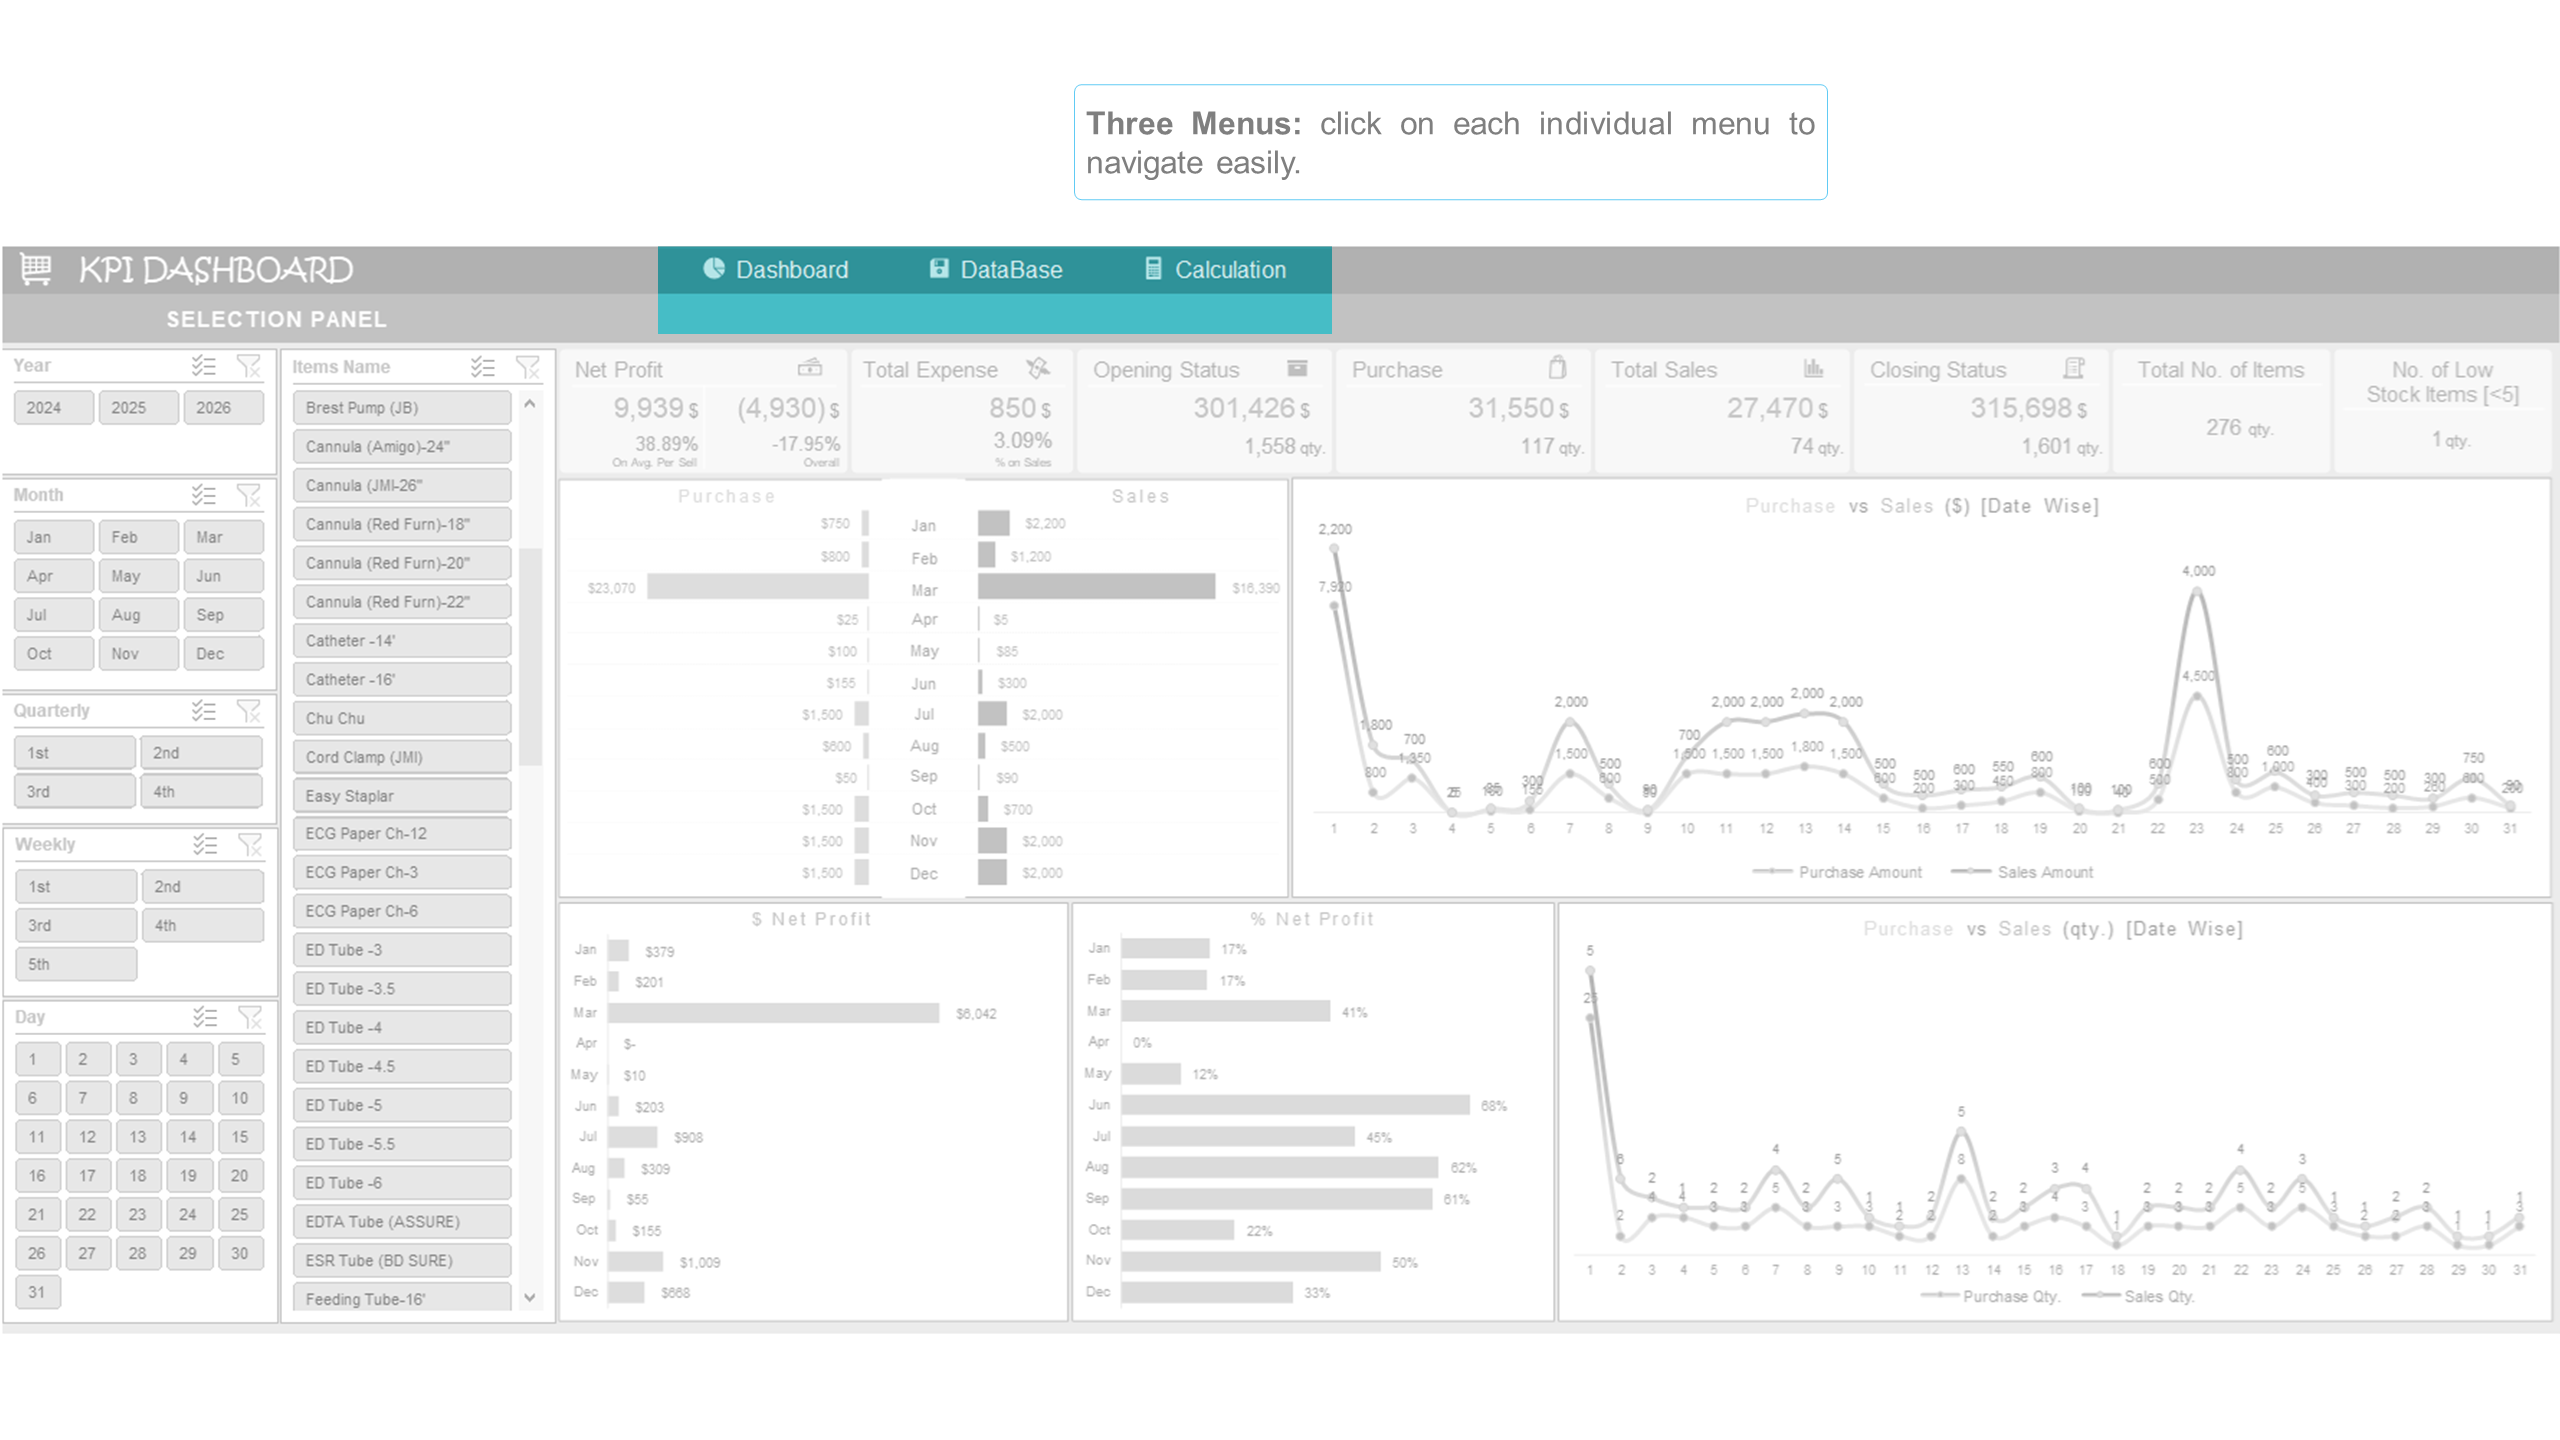
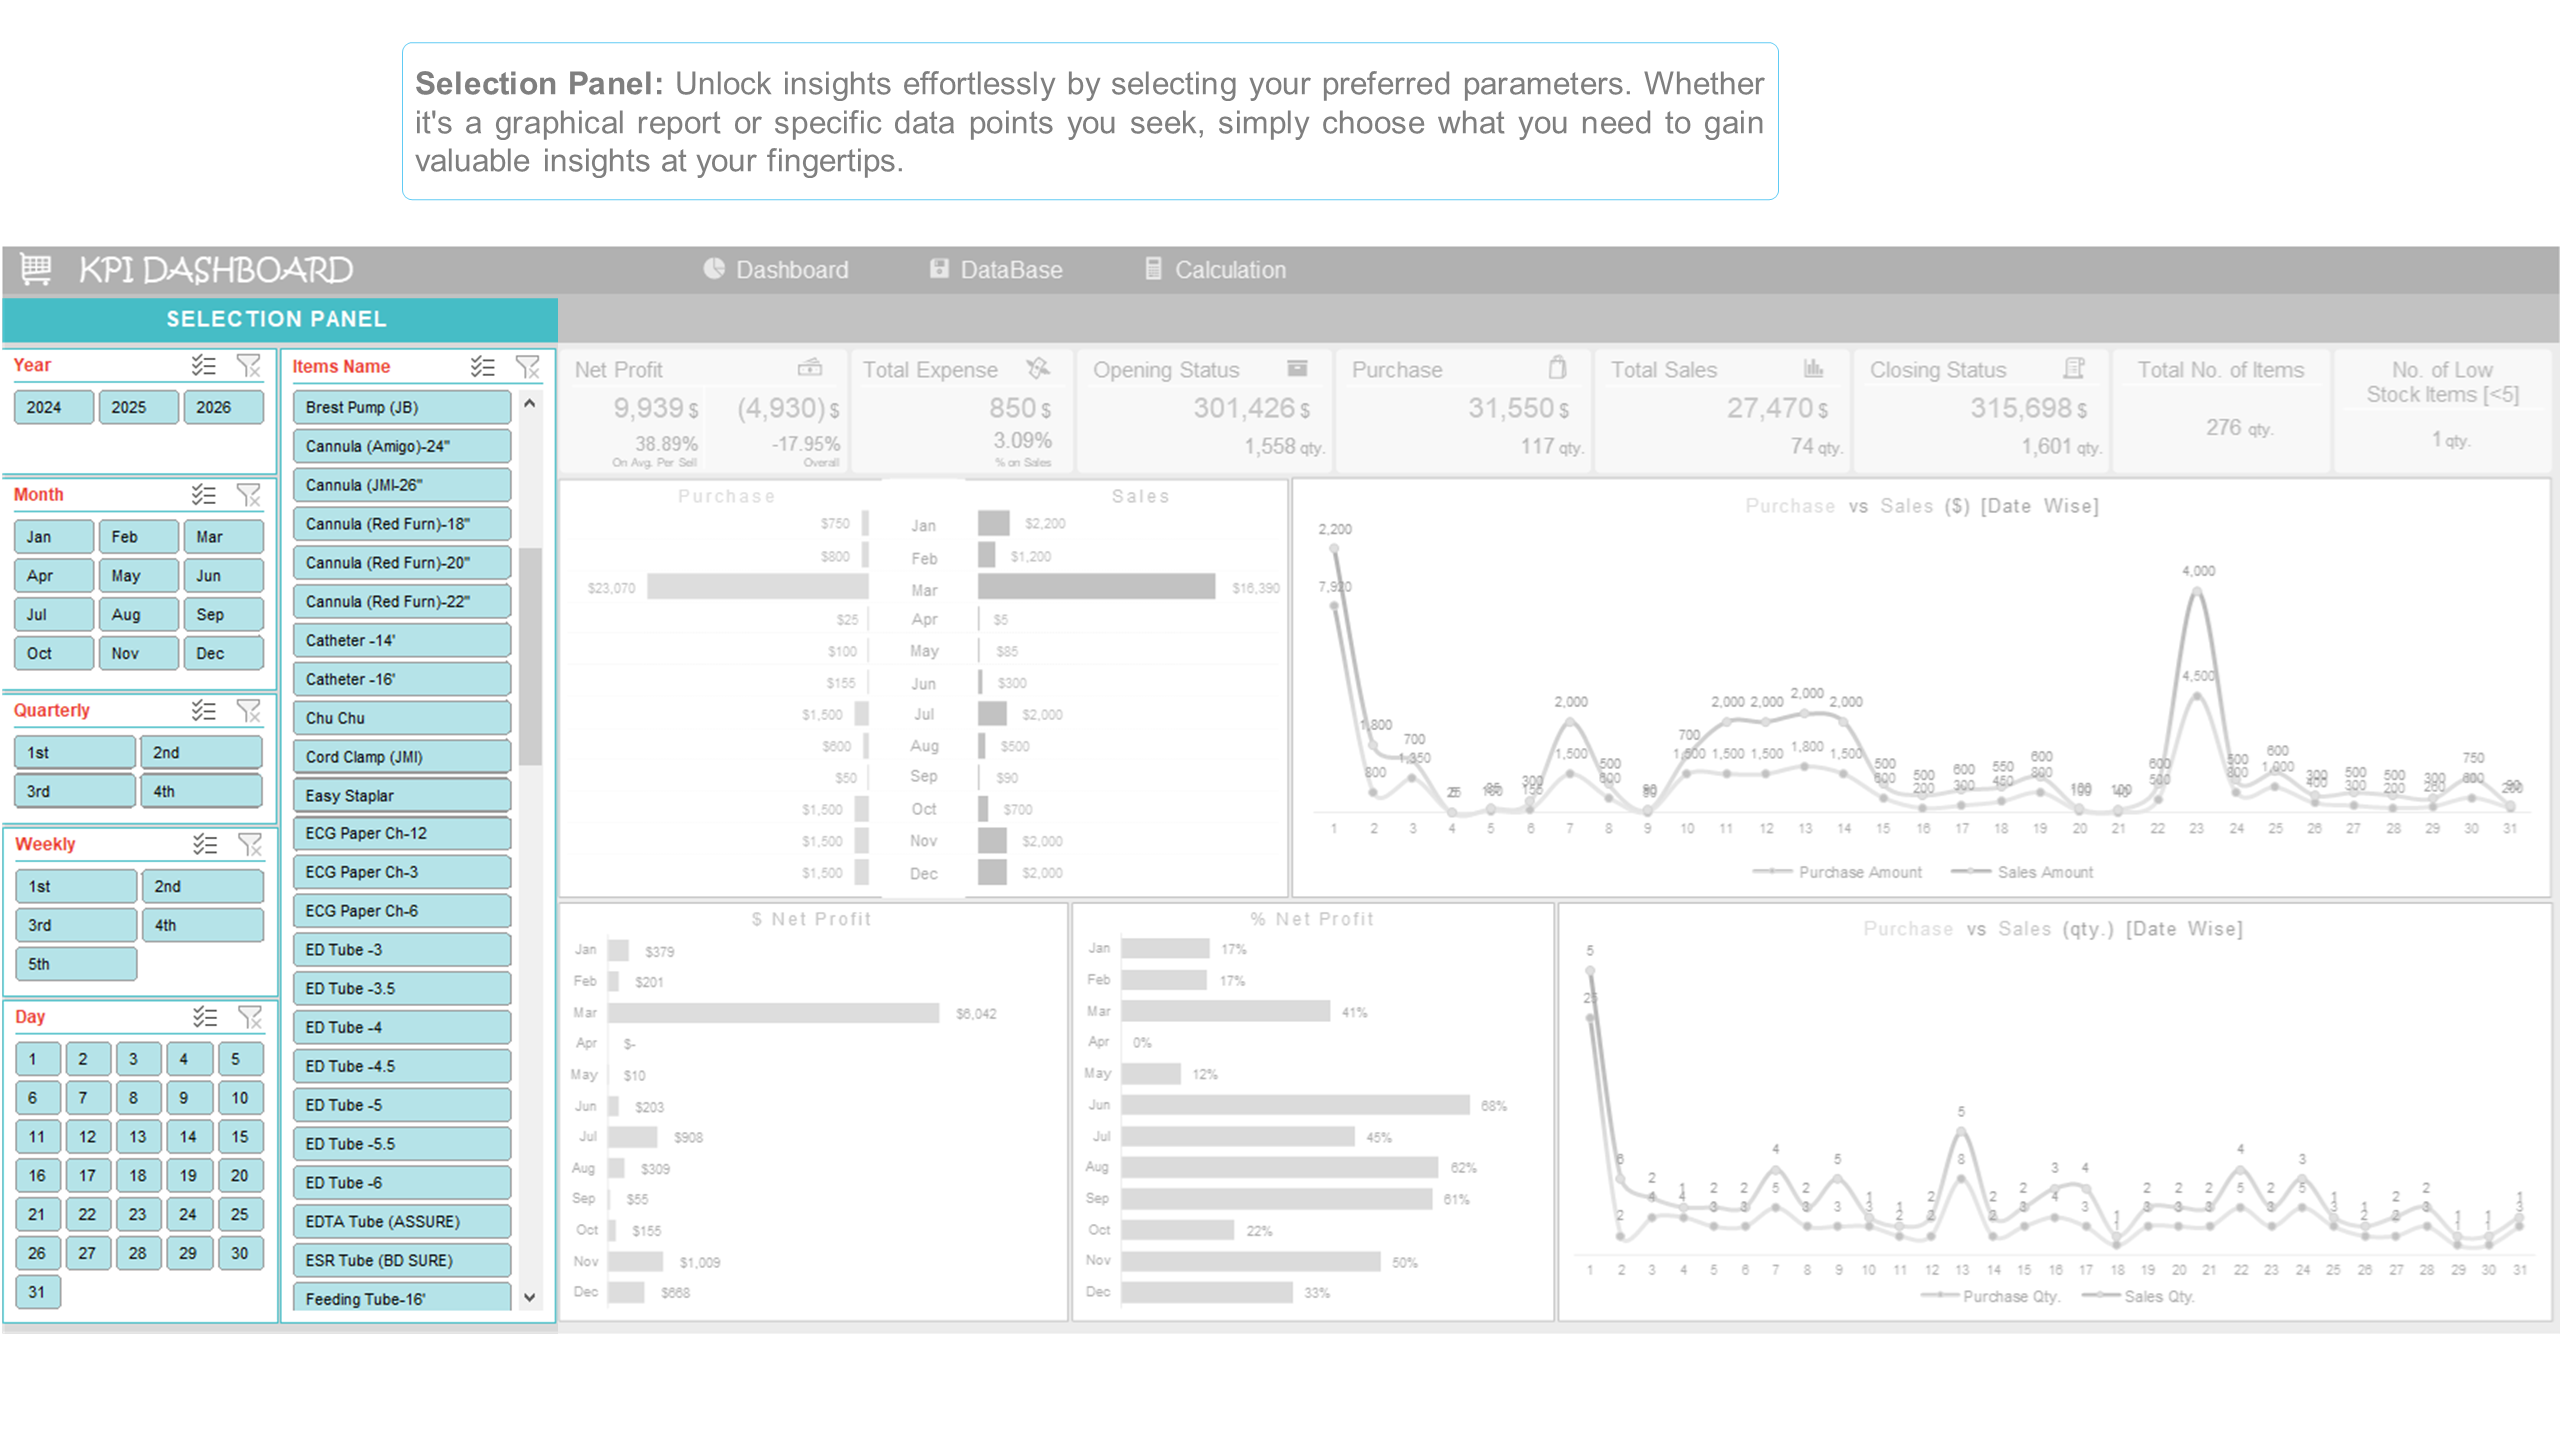
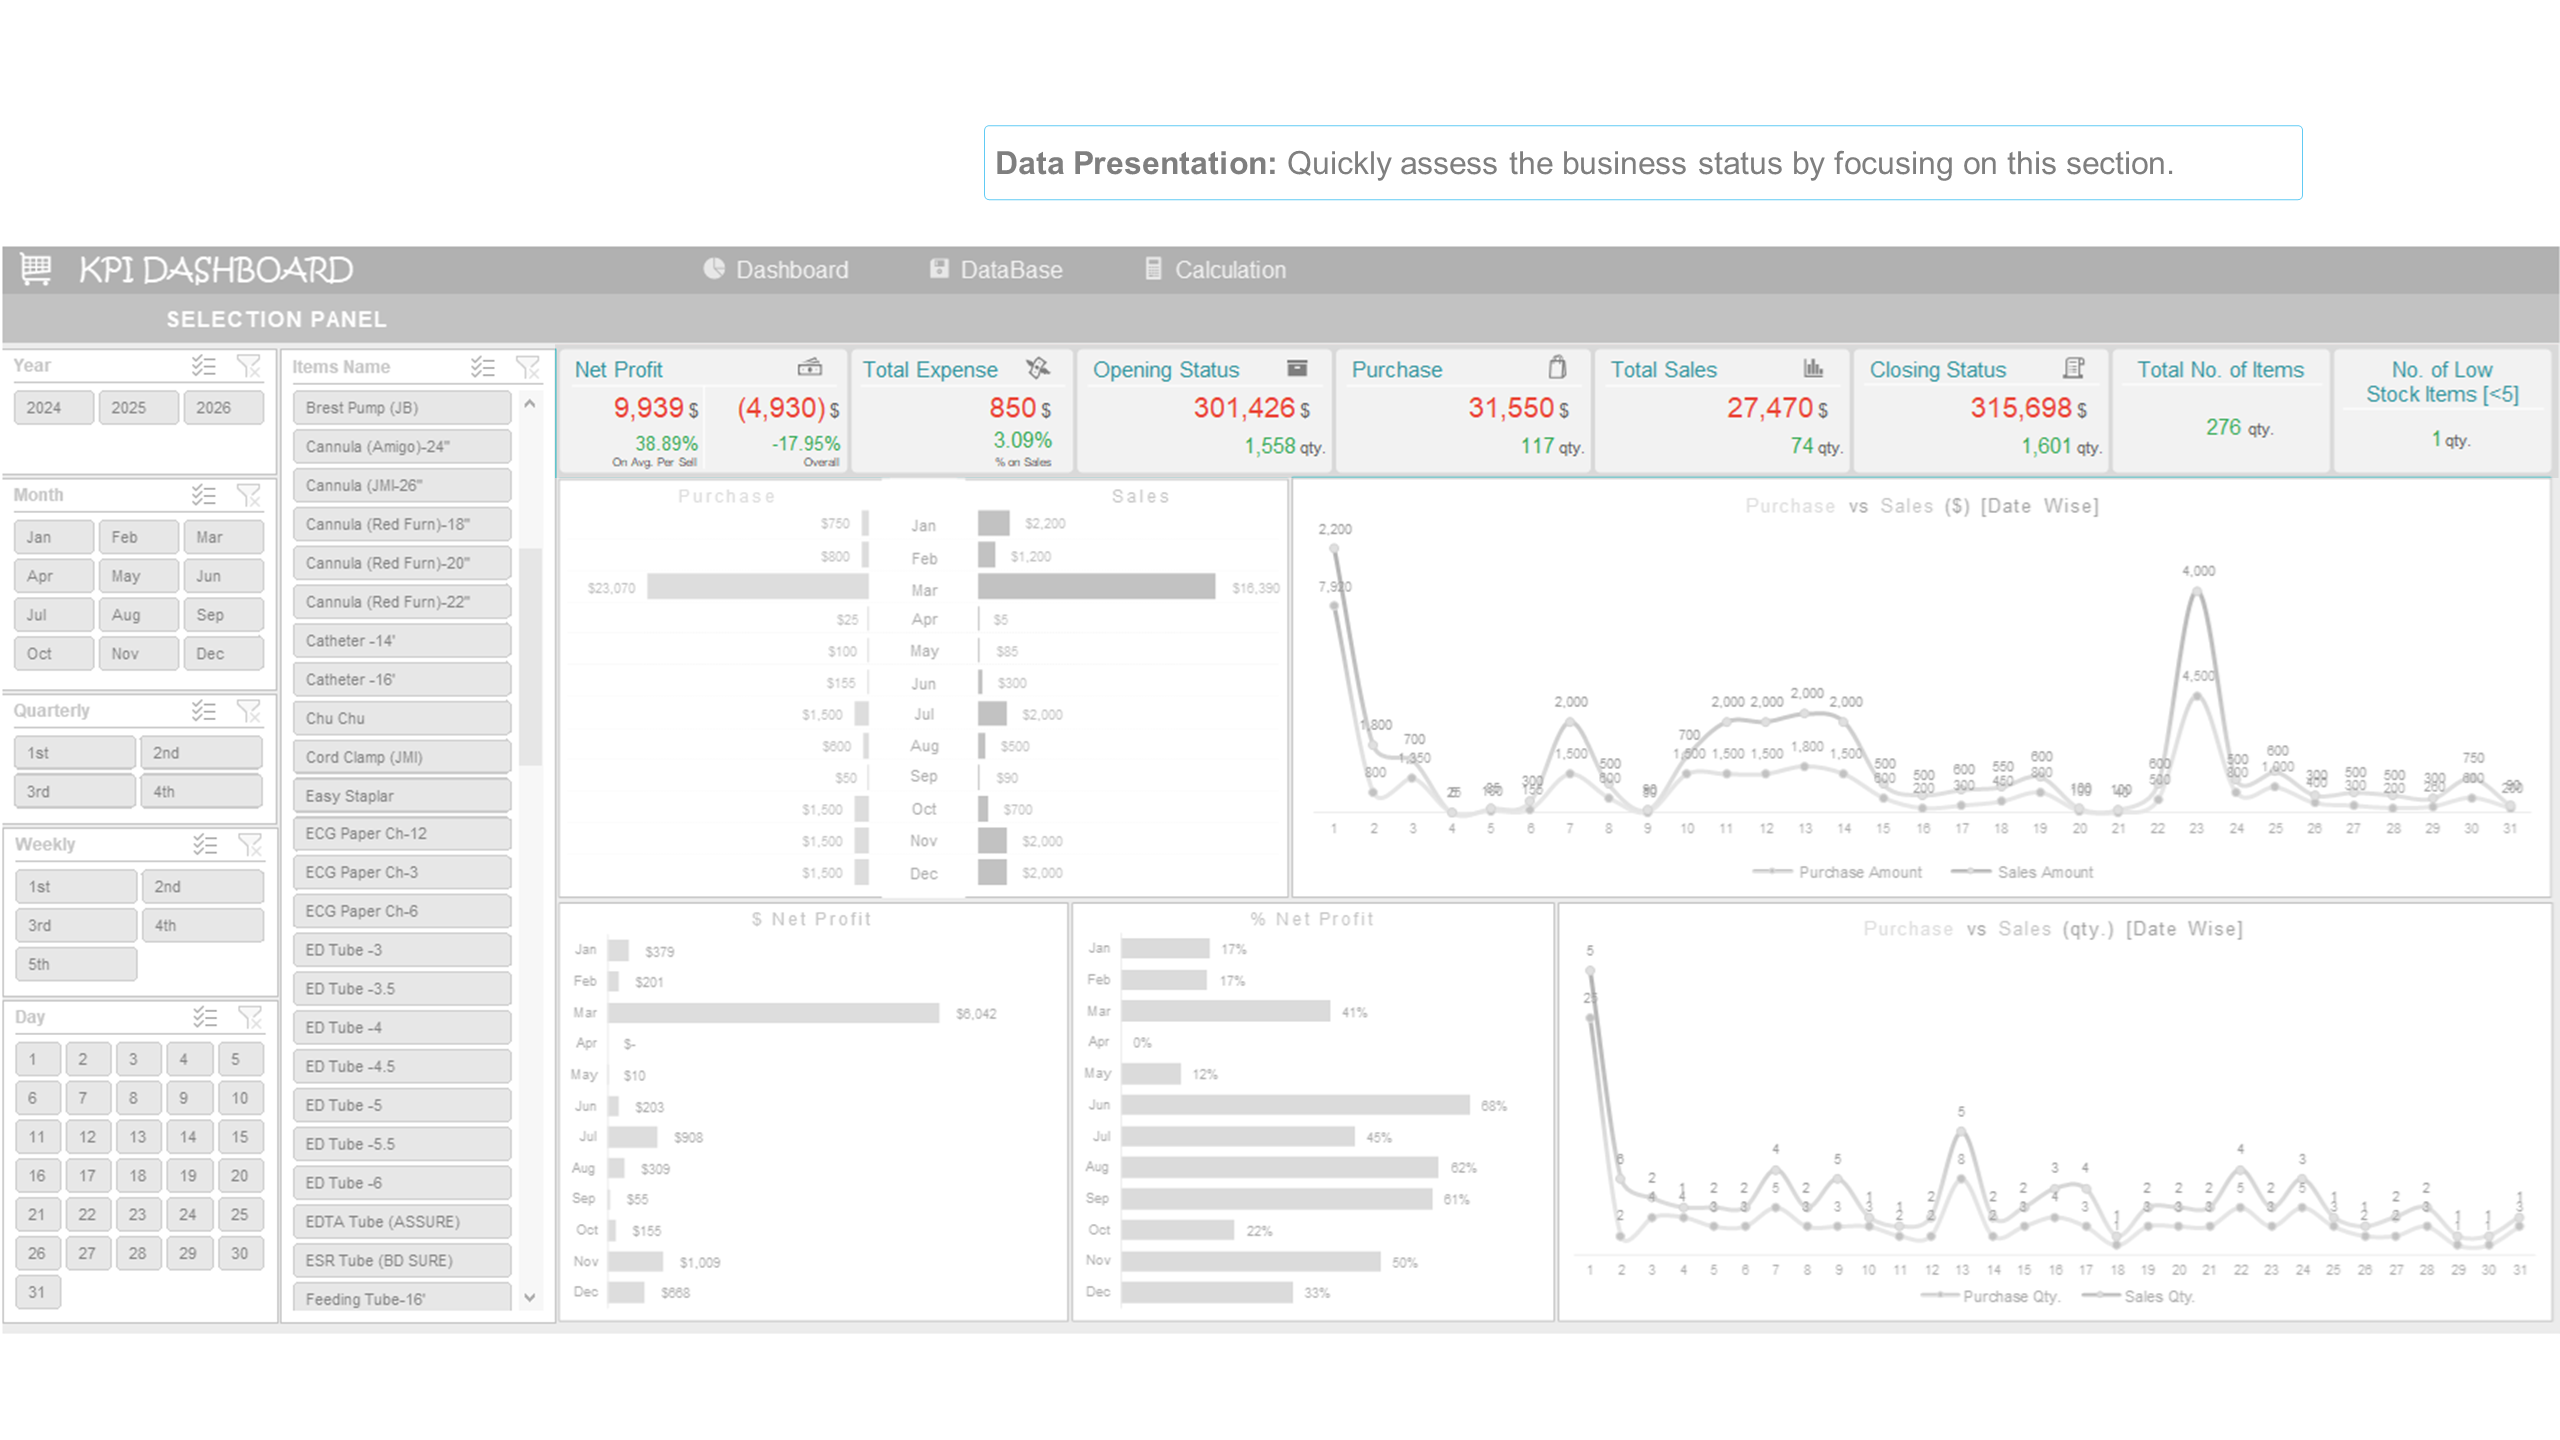
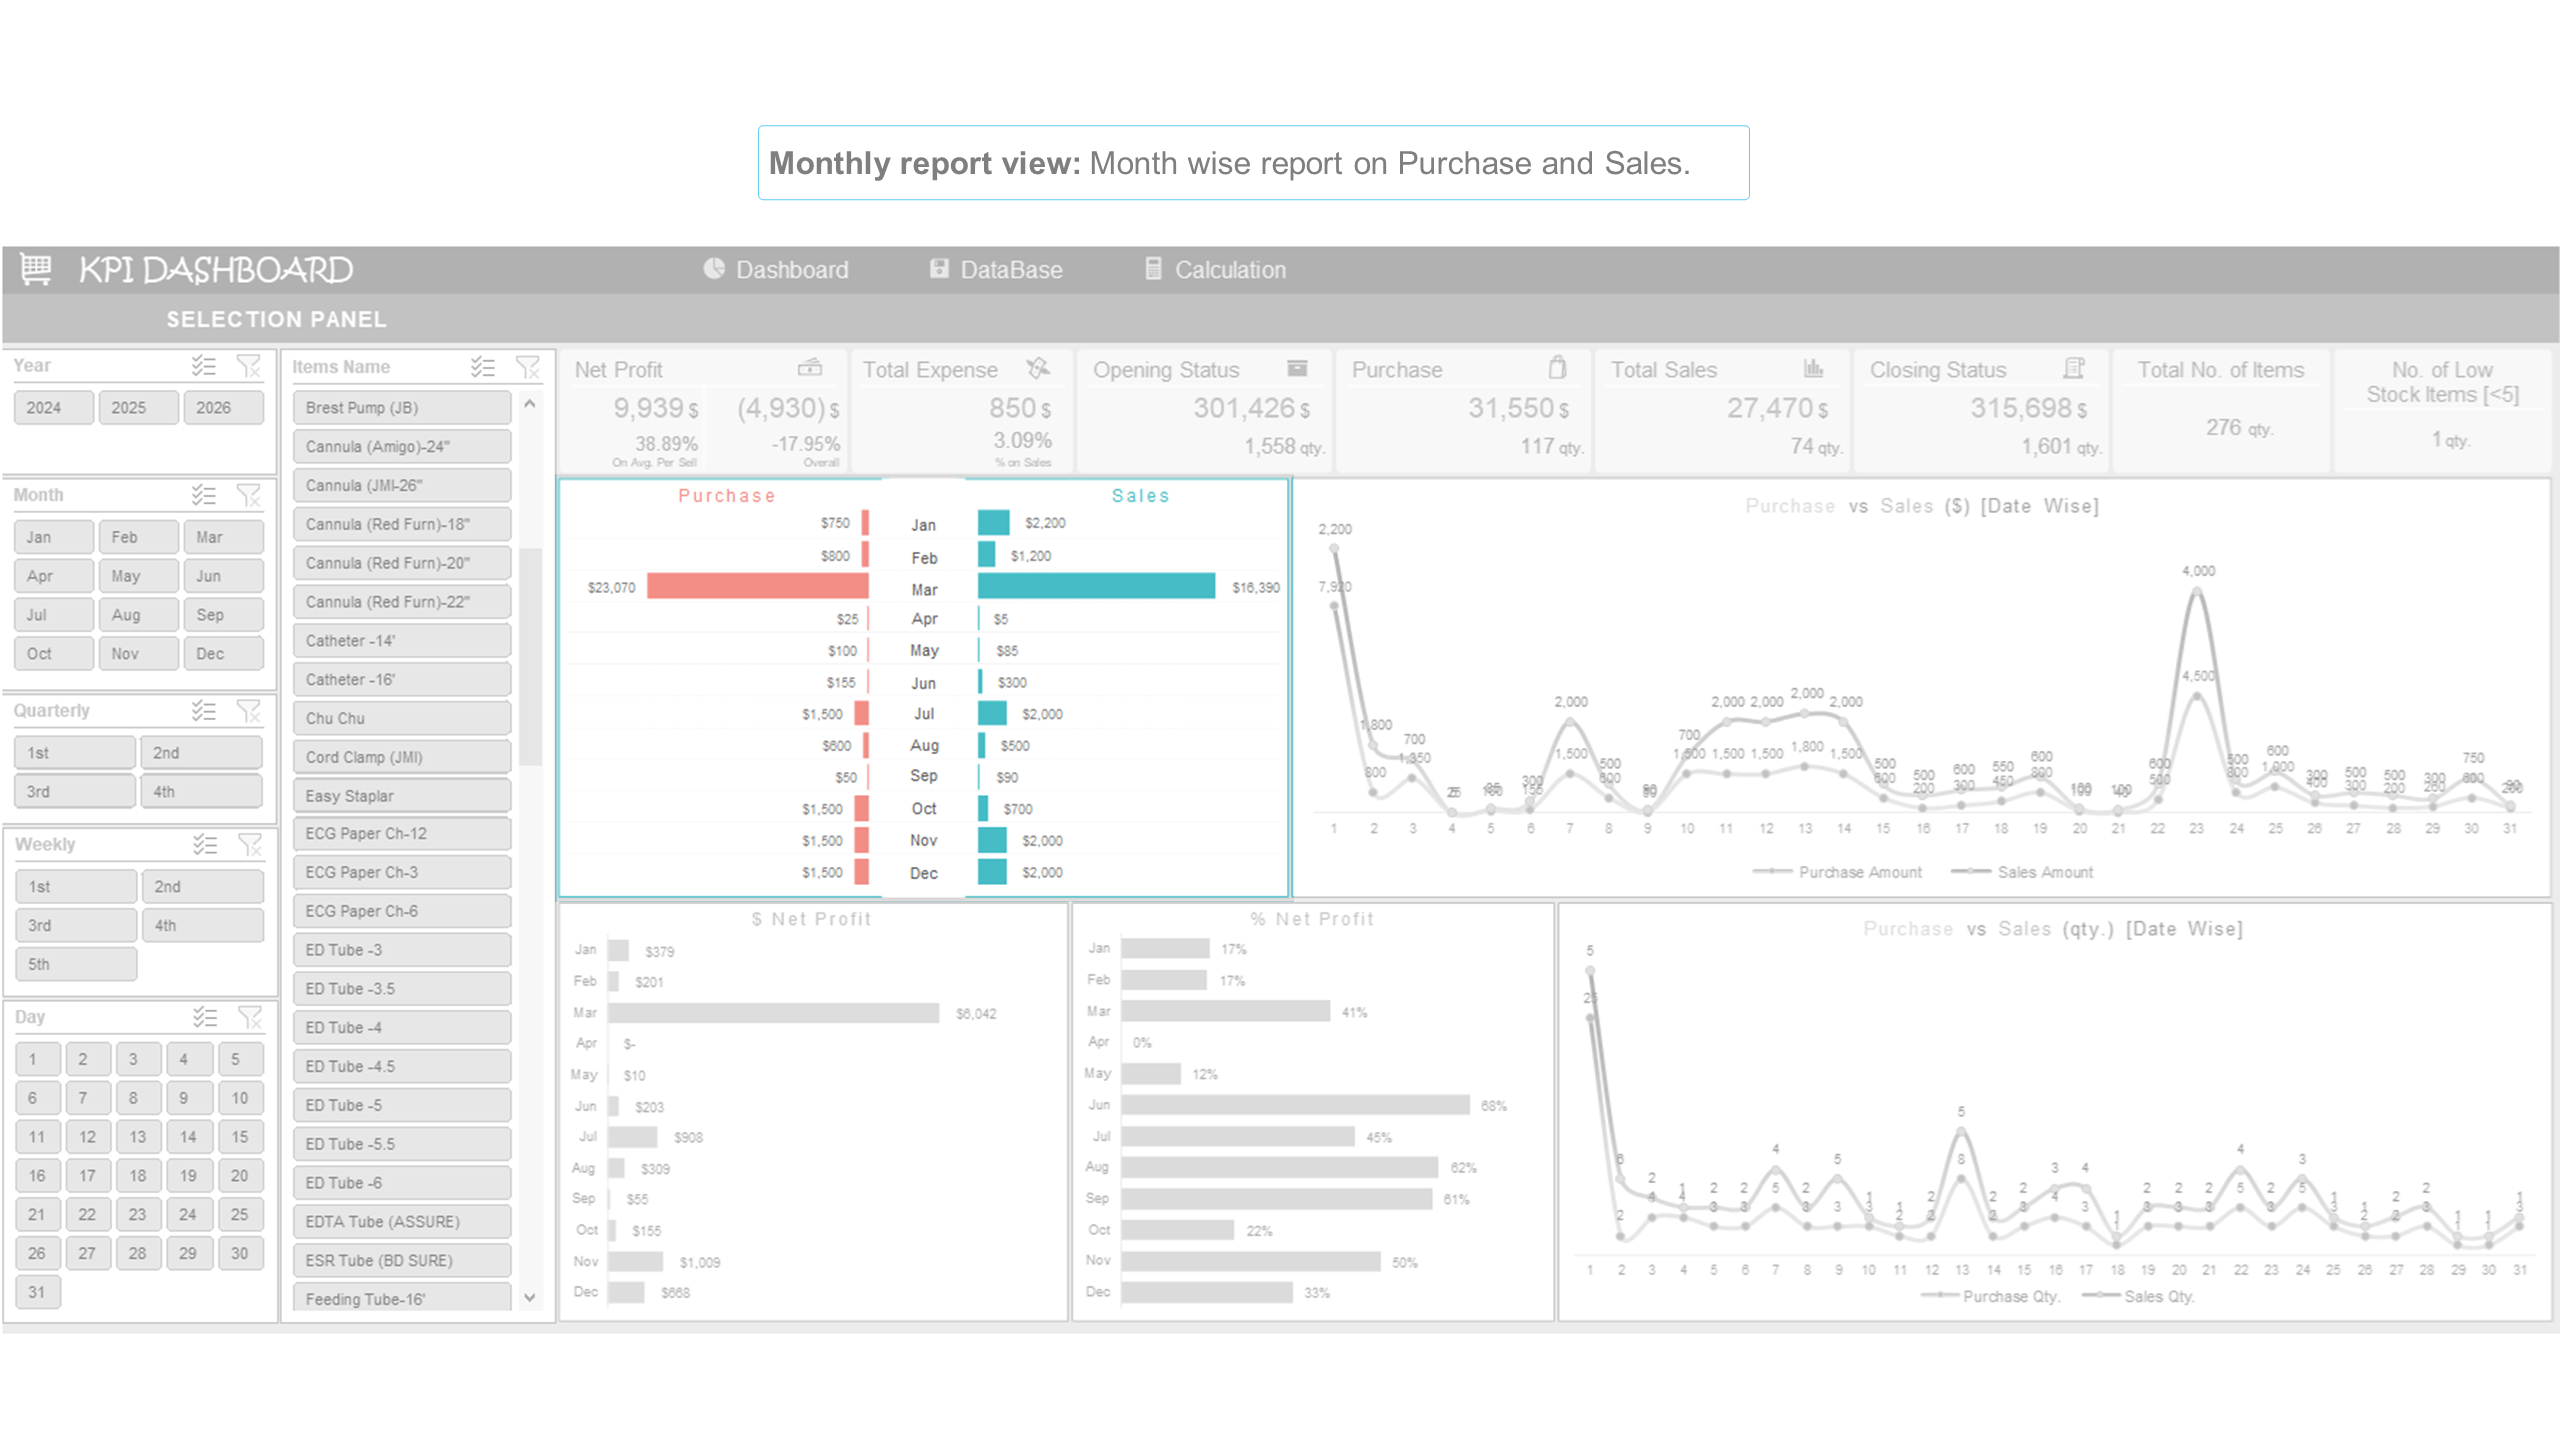
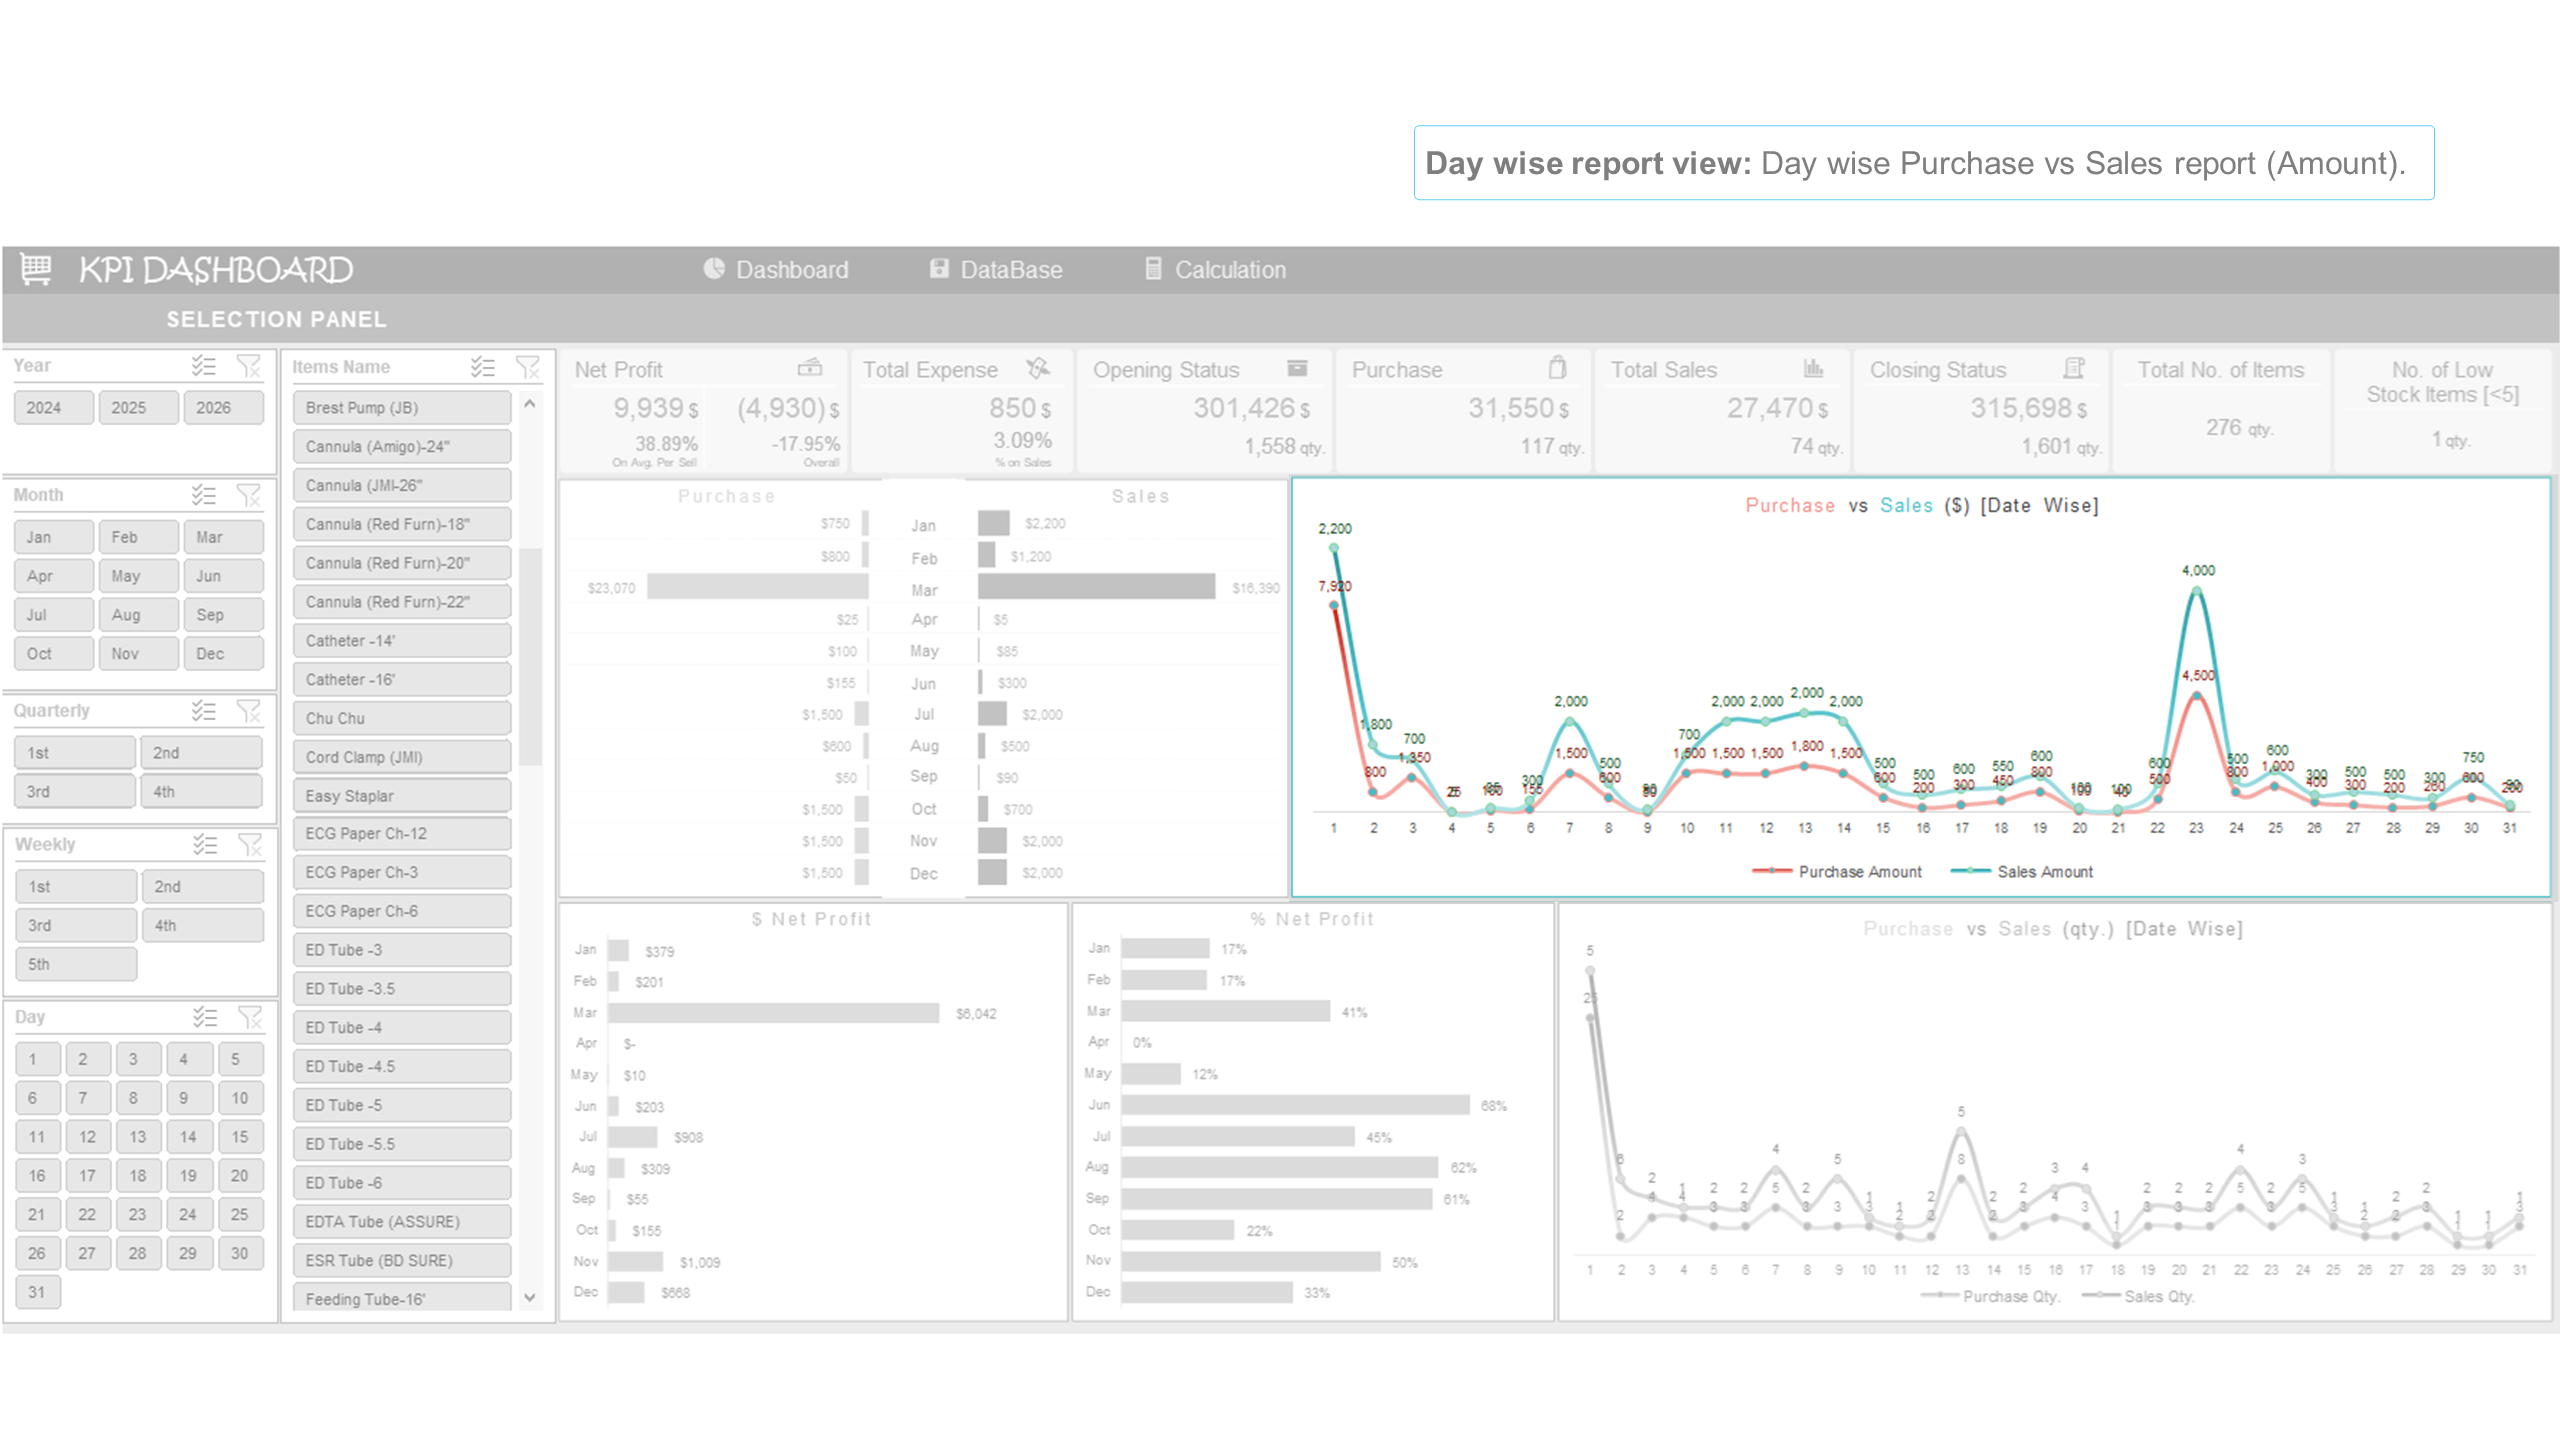
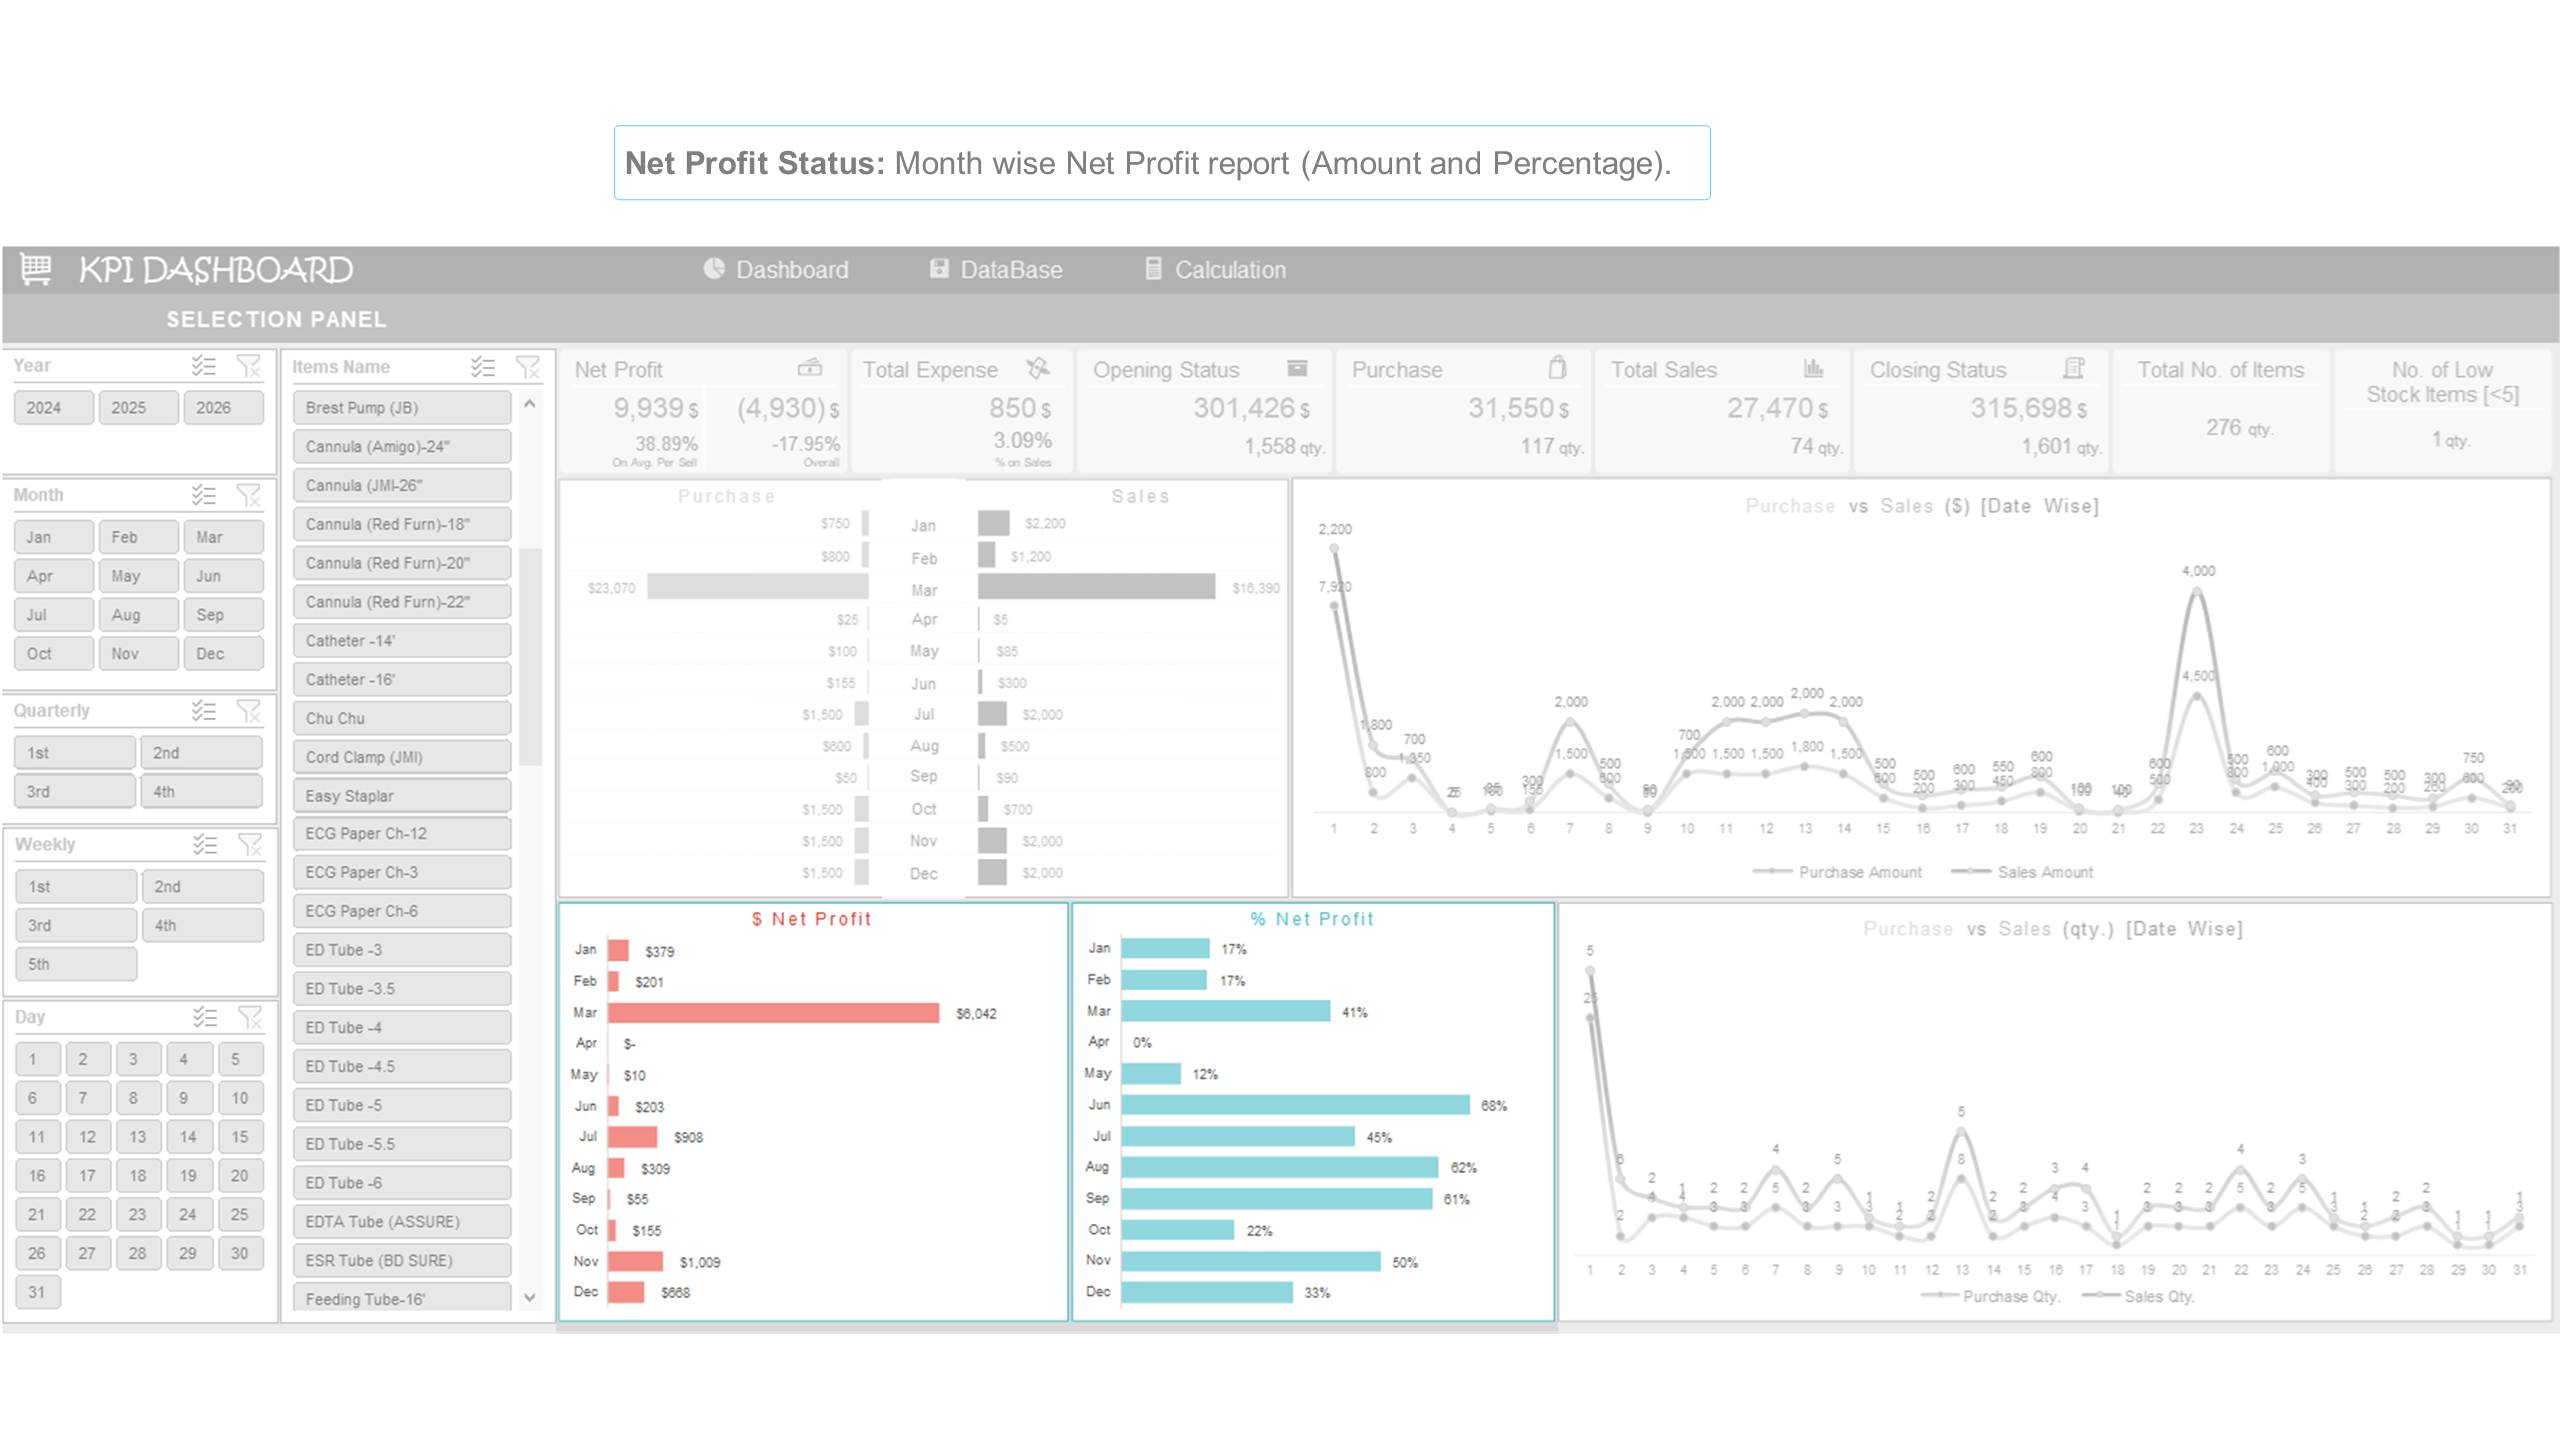
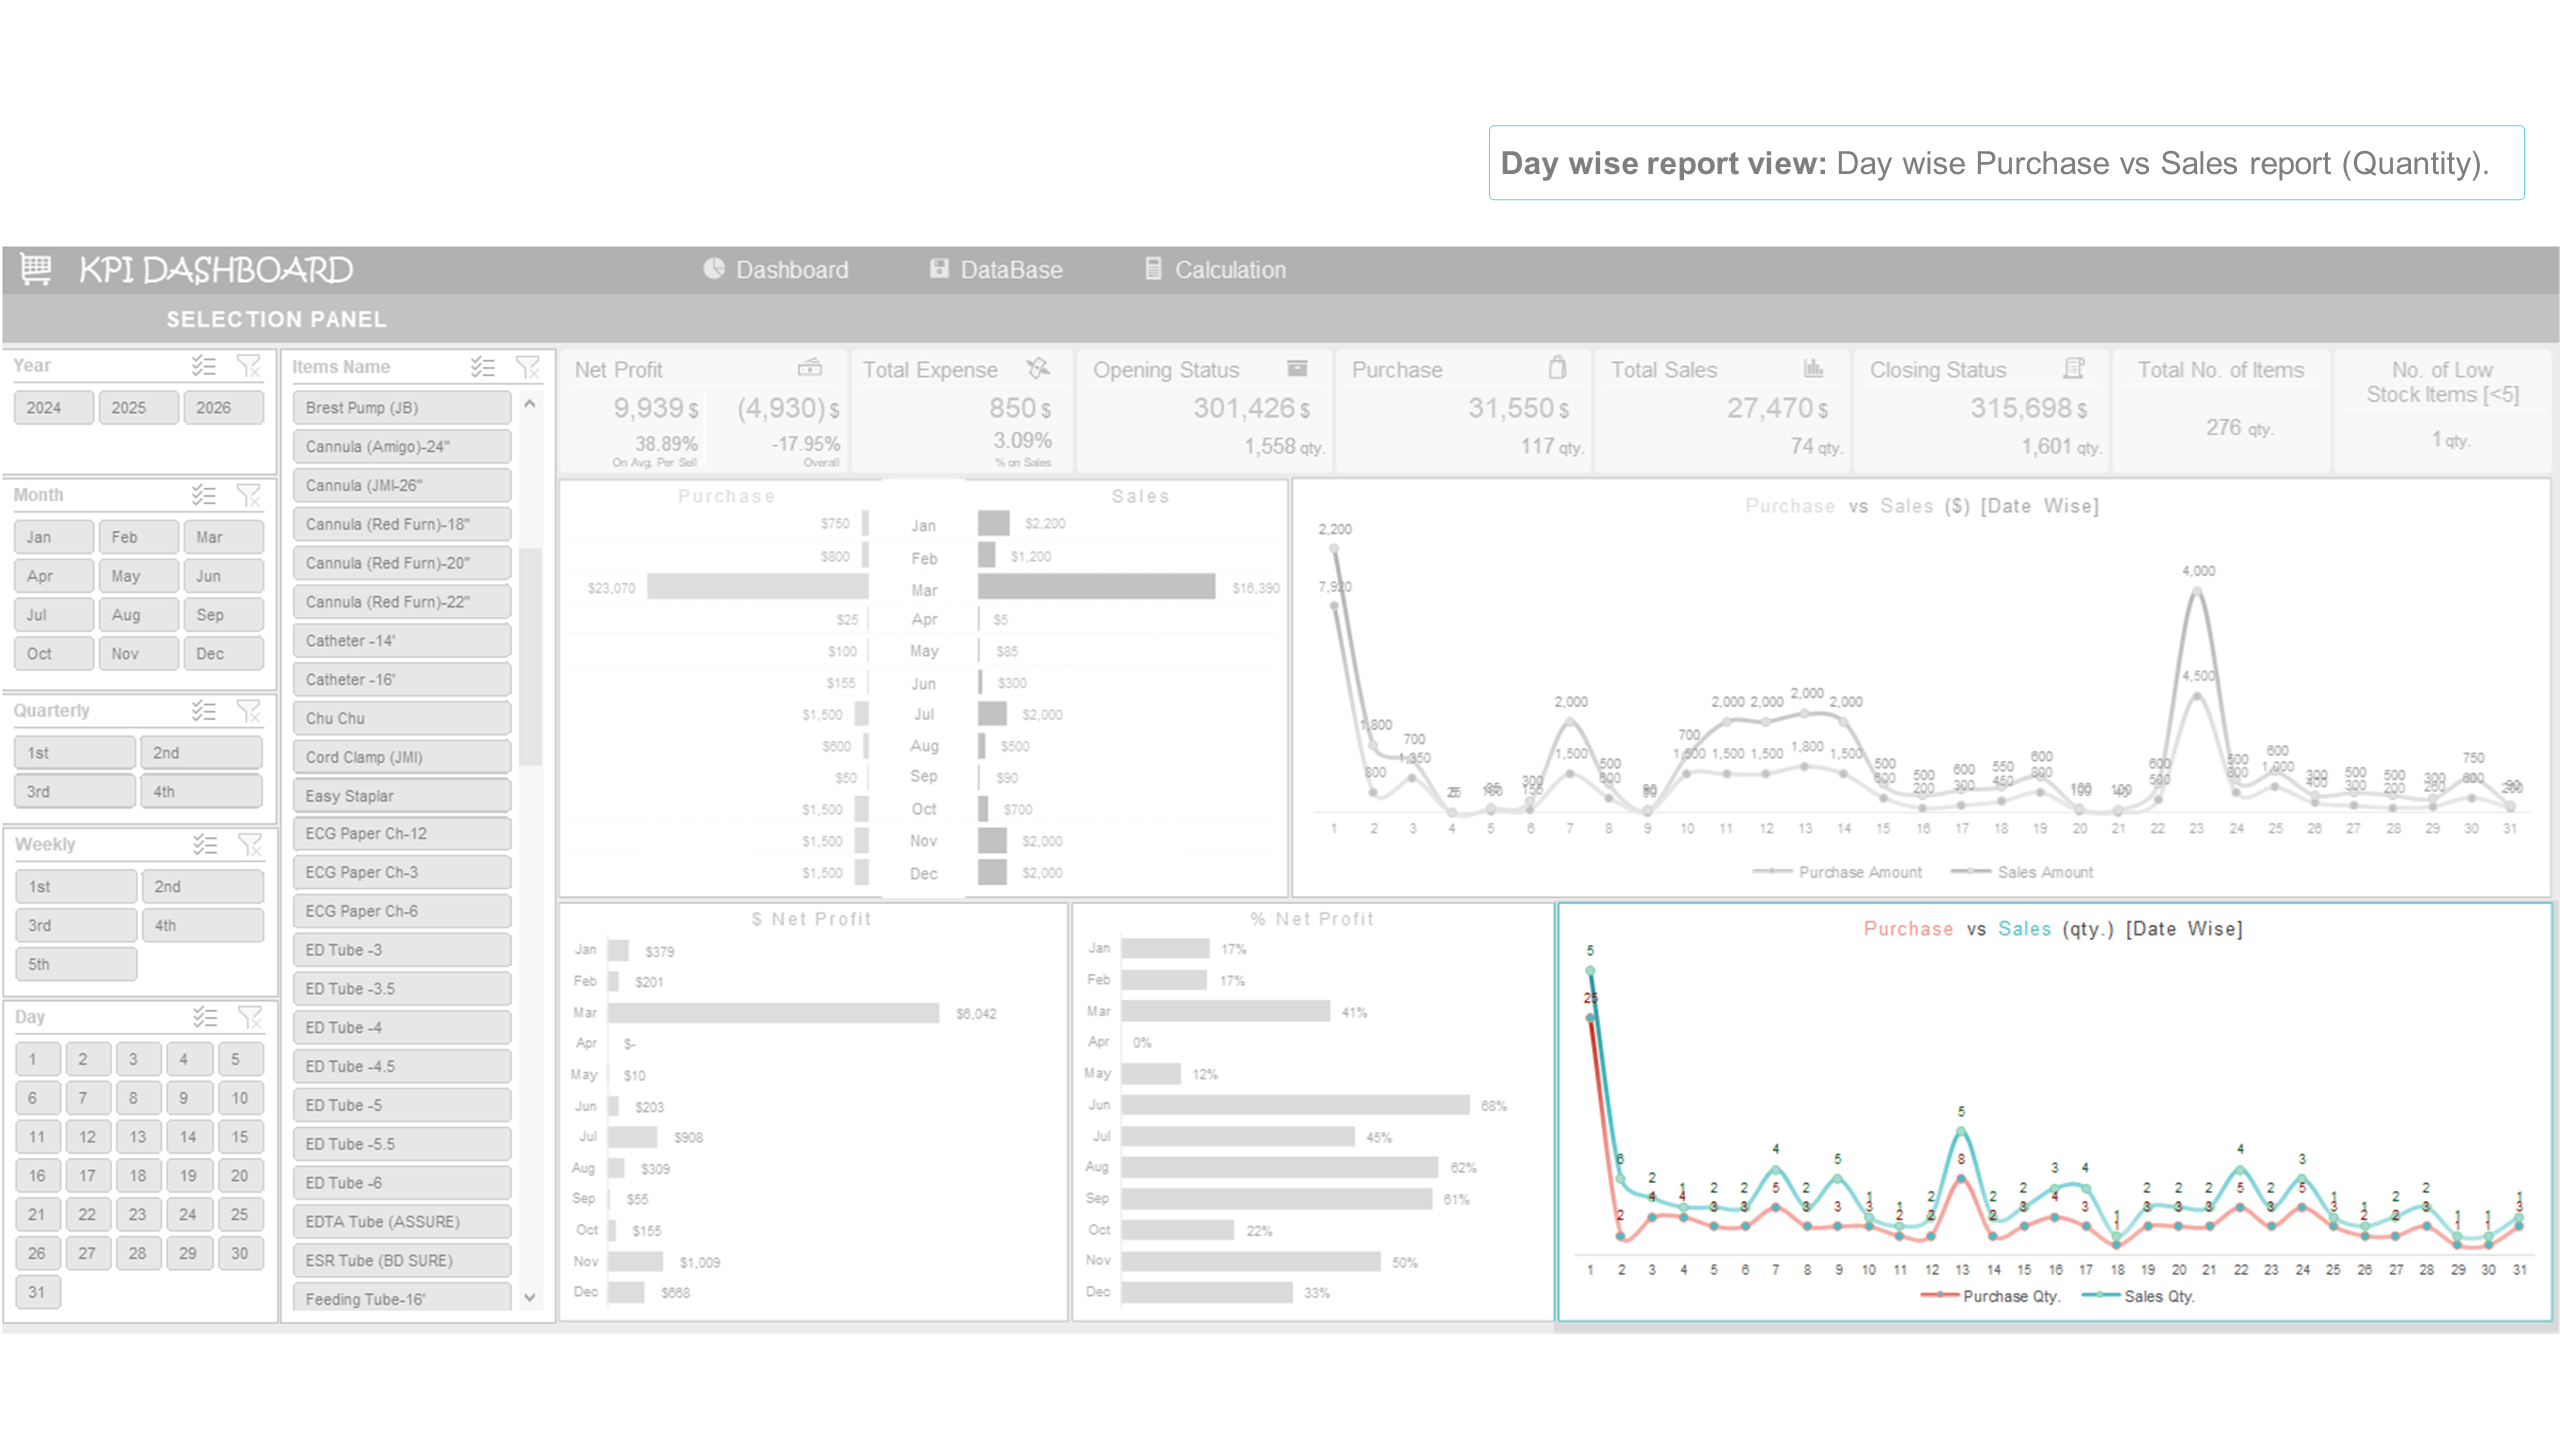
KPI Dashboard for Inventory and Sales Management using MS Excel!!
User-friendly template and very easy to use! [sales and inventory analysis in one template]
Management Tools Design & Develop | HR Generalist | Business Analyst | - Helping People in their Professional Activity.Follow
