
Originally published: 03/11/2019 21:25
Last version published: 06/09/2022 14:22
Publication number: ELQ-29192-2
View all versions & Certificate
Last version published: 06/09/2022 14:22
Publication number: ELQ-29192-2
View all versions & Certificate

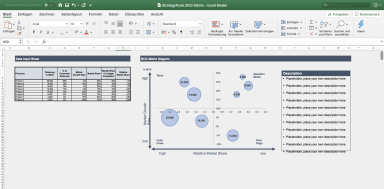
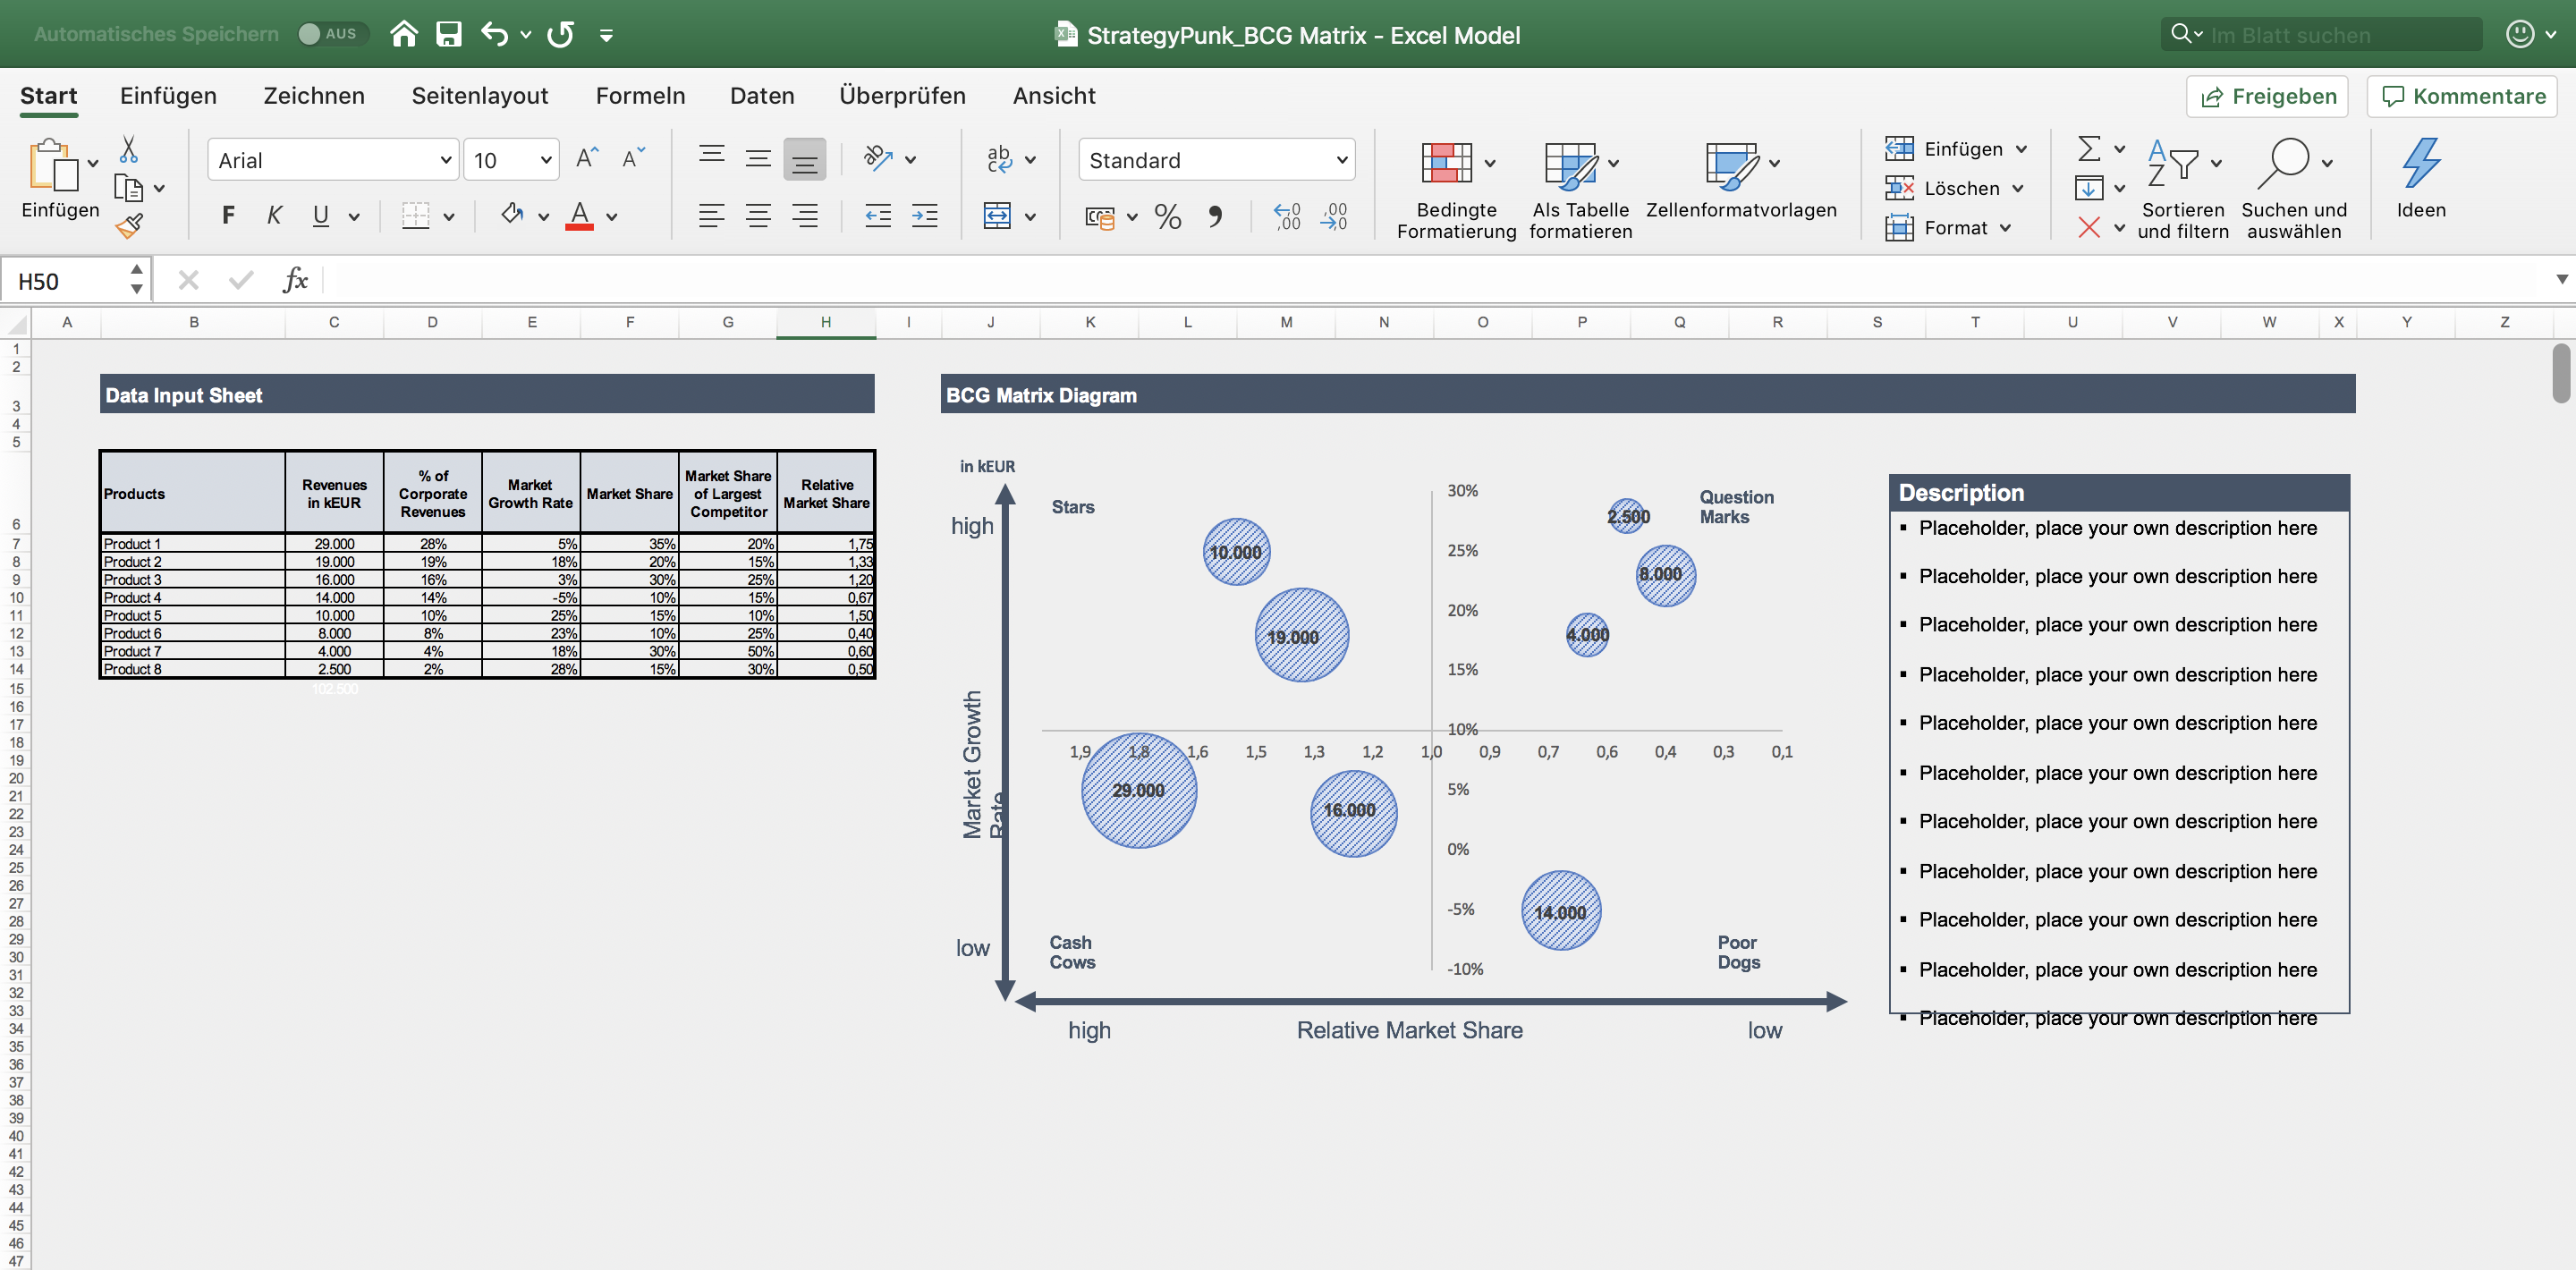
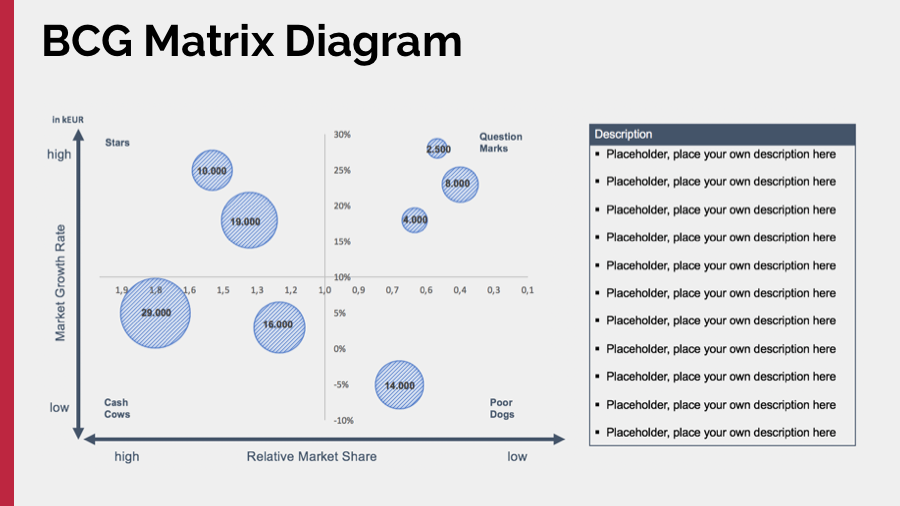
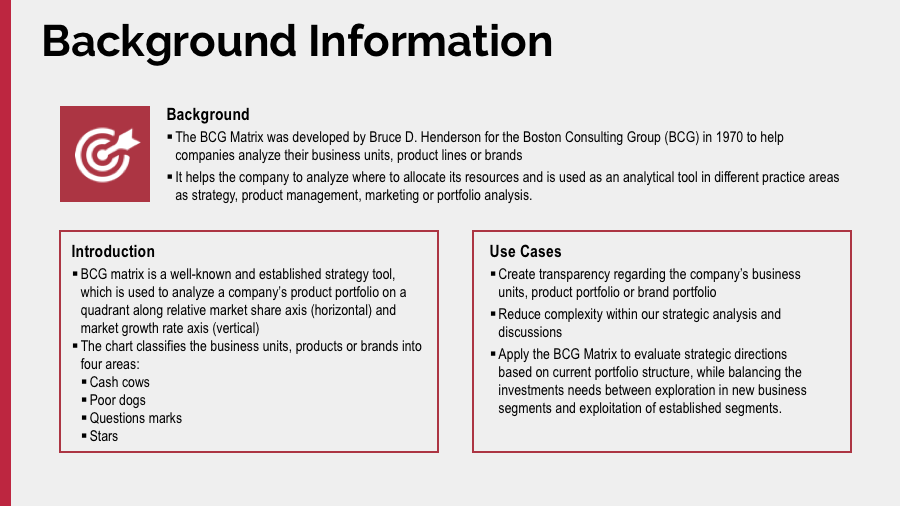
BCG Matrix Excel Template
Easy to use BCG (Boston Consulting Group) Excel Template
Every Organization Needs a Strategy. Unlock Free Insights and Templates to Master Yours.Follow 104
