
Resort Development Financial Model
Originally published: 15/09/2025 20:56
Publication number: ELQ-90904-1
View all versions & Certificate
certified

Resort Development Financial Model

10-year resort financial model with monthly & annual forecasts, capturing costs, revenues, and returns for feasibility & investment analysis.

Description
This financial model is designed to evaluate the investment feasibility, operating performance, and return metrics of a resort development project. The model incorporates monthly forecasts across the full 10-year horizon, with the option to roll into annual summaries for long-term reporting. The structure captures land acquisition, construction outlays, pre-opening expenses, ramp-up after opening, and eventual stabilization, ensuring both short-term operational detail and long-term financial visibility.


Model Structure – 5 Main Sections

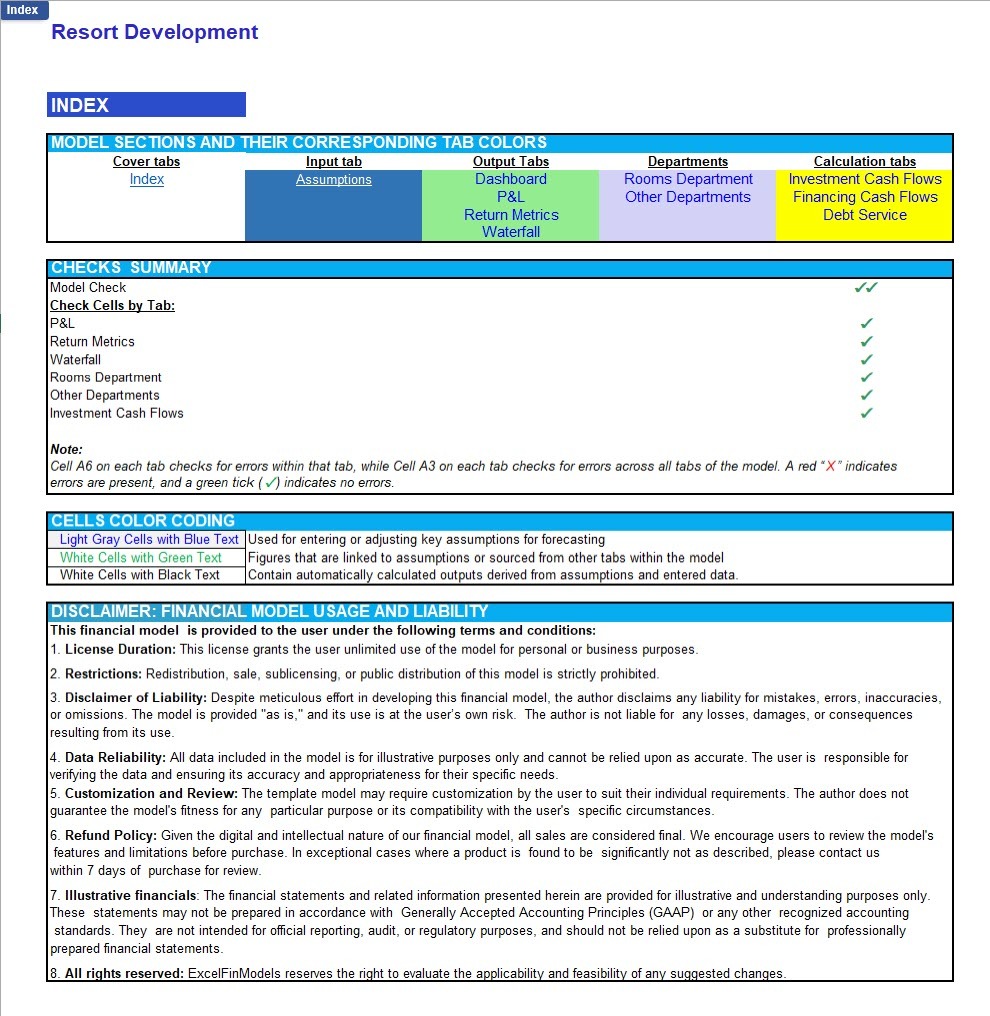
1. Index Section

  • Provides a centralized navigation and summary interface.
  • Includes cell color-coding guidelines, tab color-coding for user orientation, a checks summary showing the error status across different tabs, and a disclaimer regarding the intended use of the model.
  • Cell A1 in every tab links directly back to this Index tab.
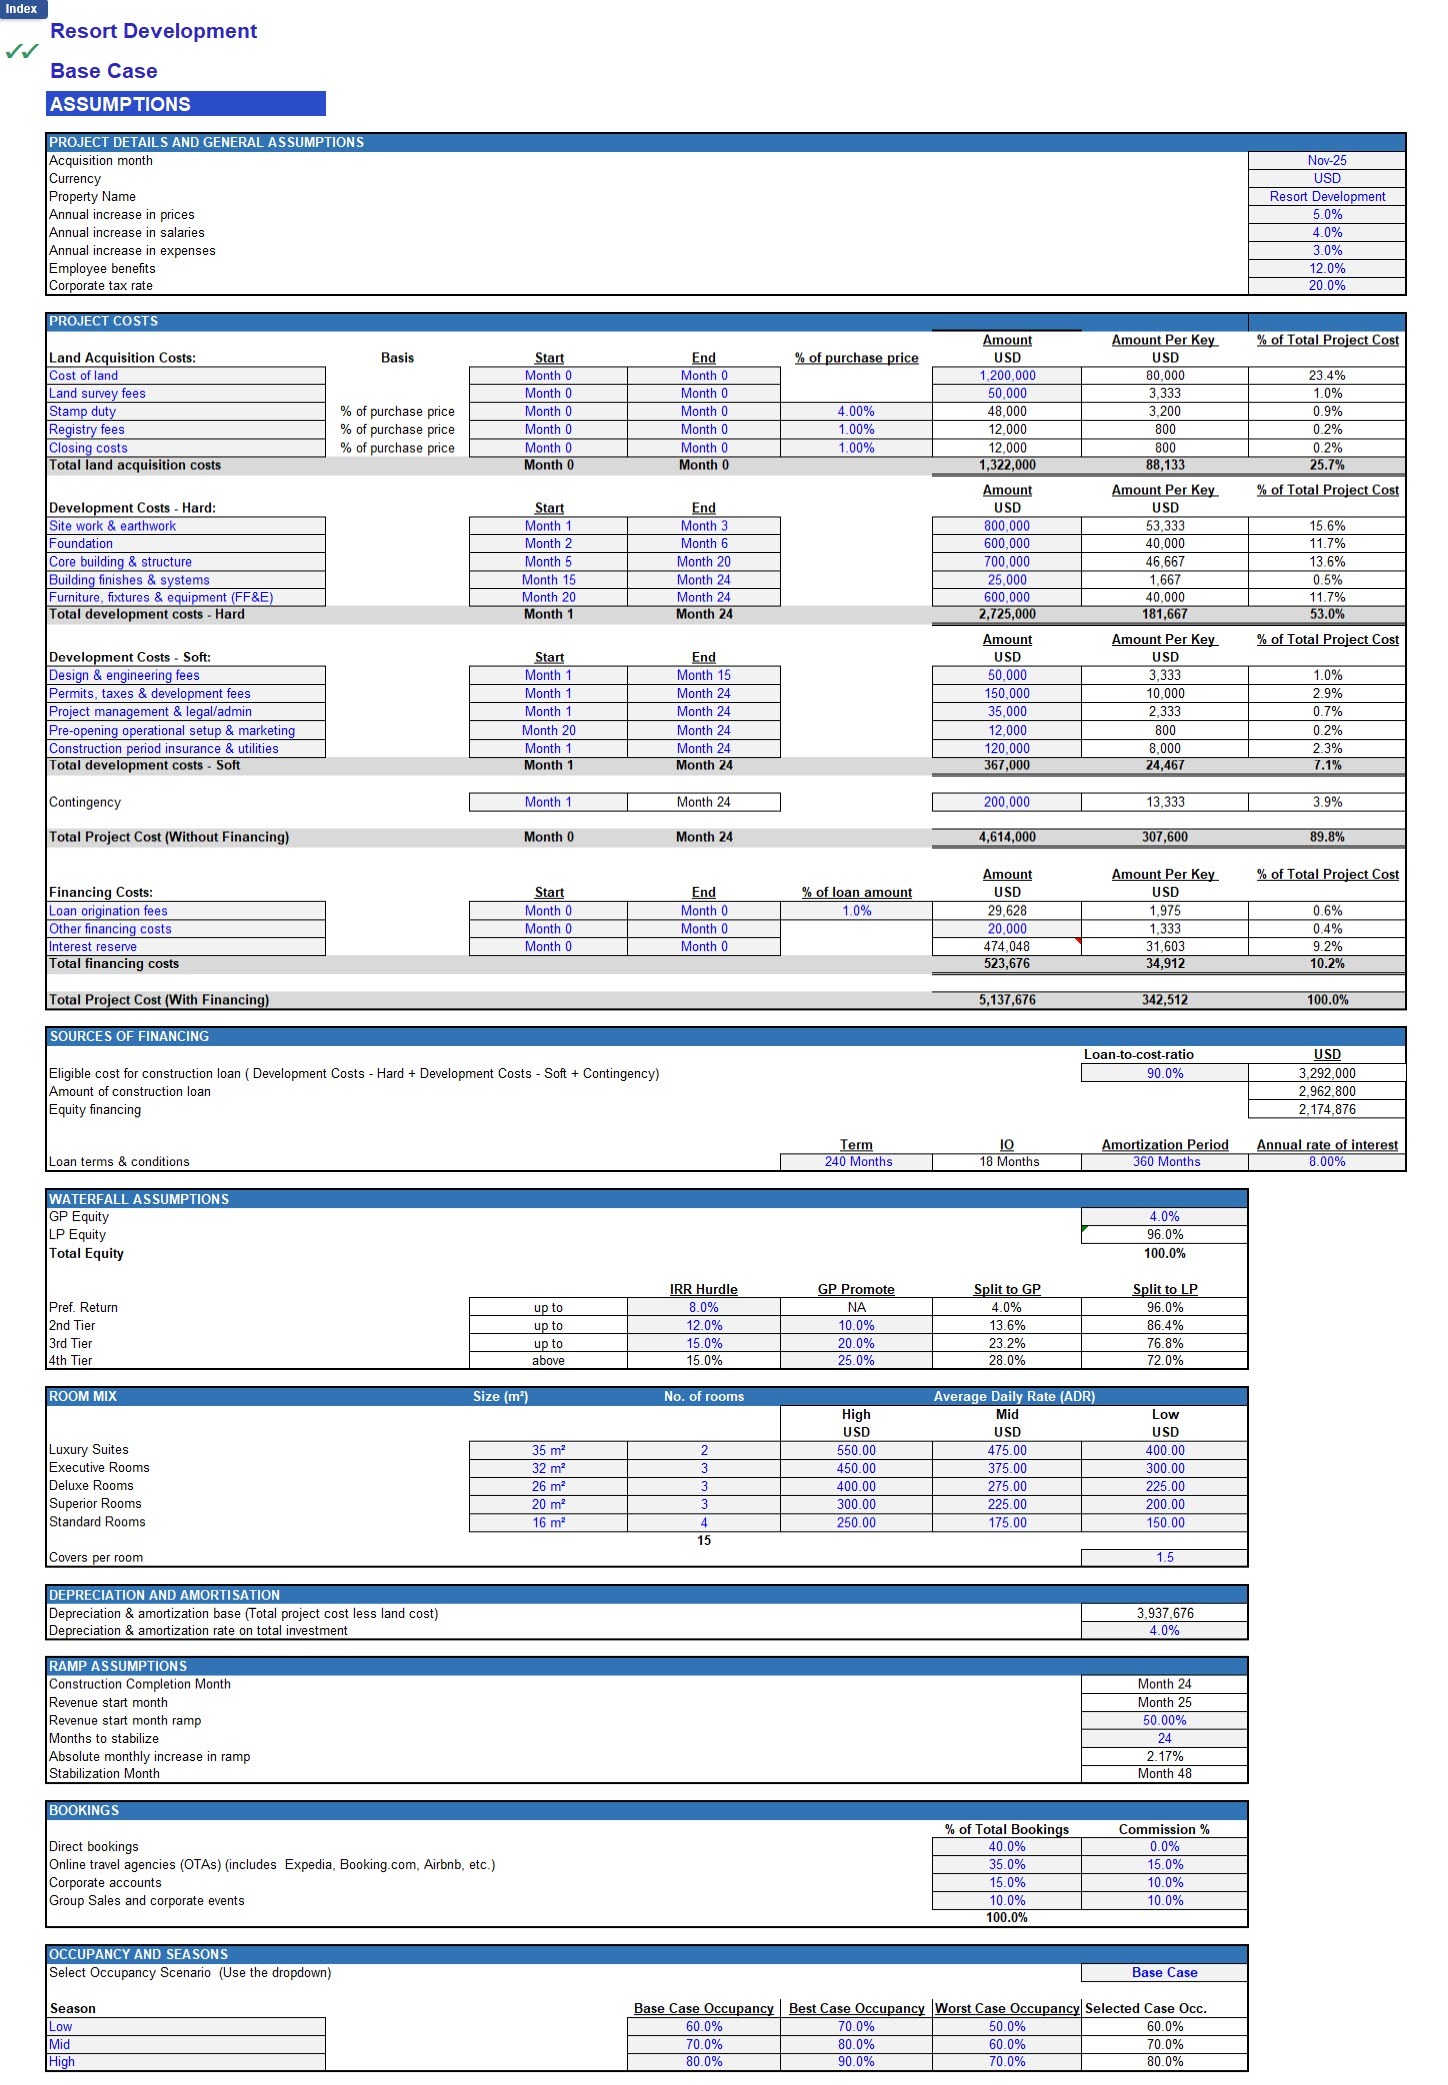
2. Assumptions Section
  • Core input area for all project and operating assumptions, structured for transparency and ease of use.
  • Key assumptions captured include:
    • Investment costs (land, hard, soft, and financing costs).
    • Sources of funding (equity and debt).
    • Depreciation policy and ramp-up schedule.
    • Room mix, tariff, and occupancy assumptions across different seasons with up to 3 scenarios.
    • Season-wise occupancy
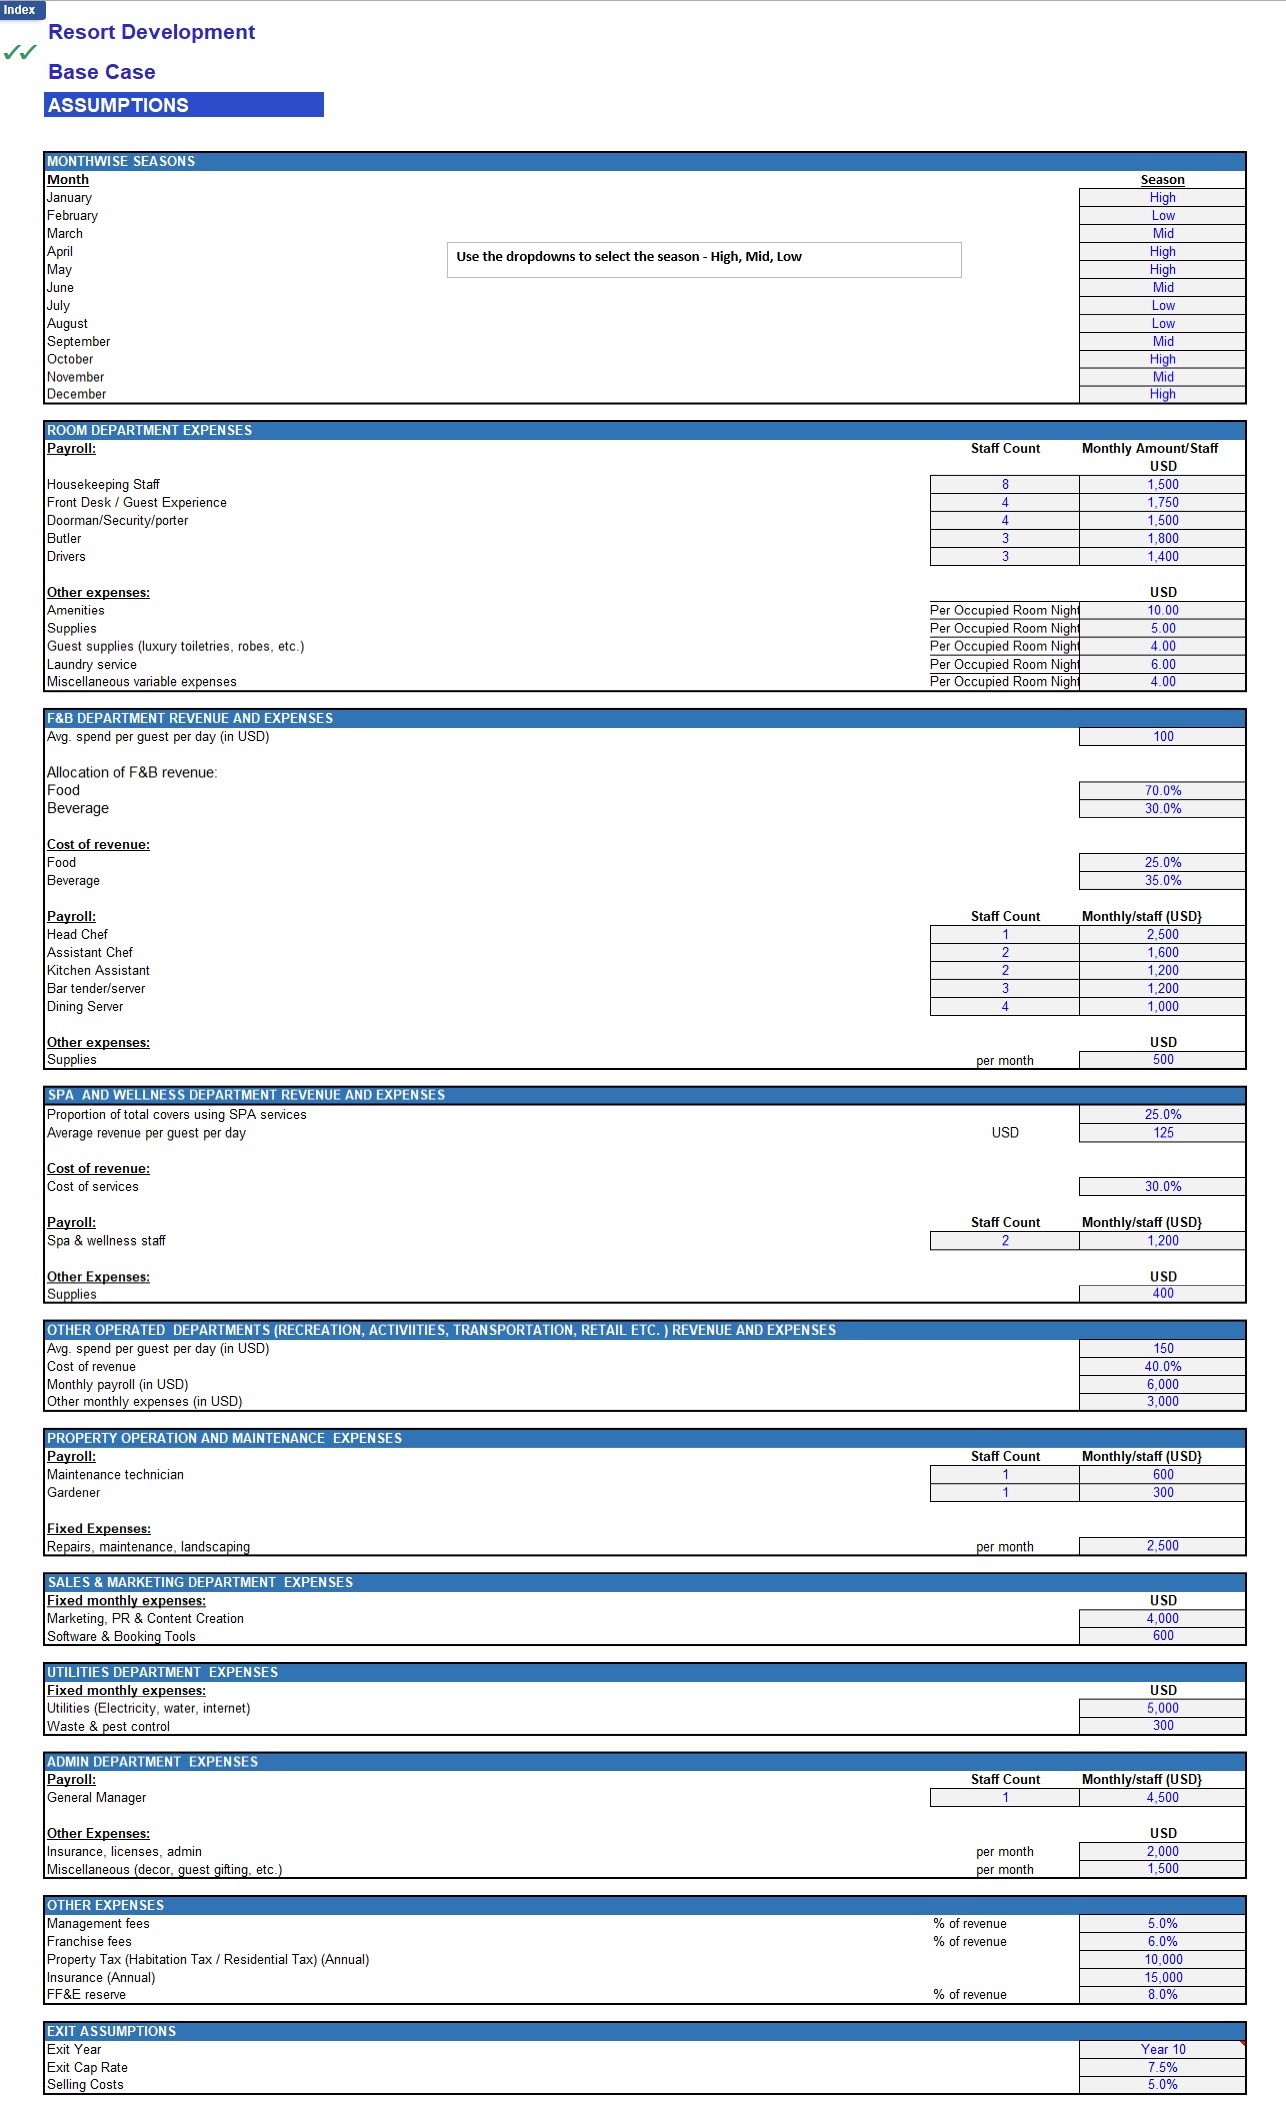
    • Departmental assumptions:
      • F&B (food vs. beverage split, costs, payroll).
      • Spa & Wellness (treatments, revenues, costs, payroll).
      • Other Operated Departments (recreation, retail, transportation, and ancillary services).
    • Overheads and other costs: repairs, sales & marketing, utilities, admin, management fees, property taxes, insurance, and FF&E reserve.
o Inputs for waterfall distribution (preferred return, hurdle rates, promote structure etc.).


3. Output Section
  • Presents the key financial results in both tabular and graphical form.
  • Includes:
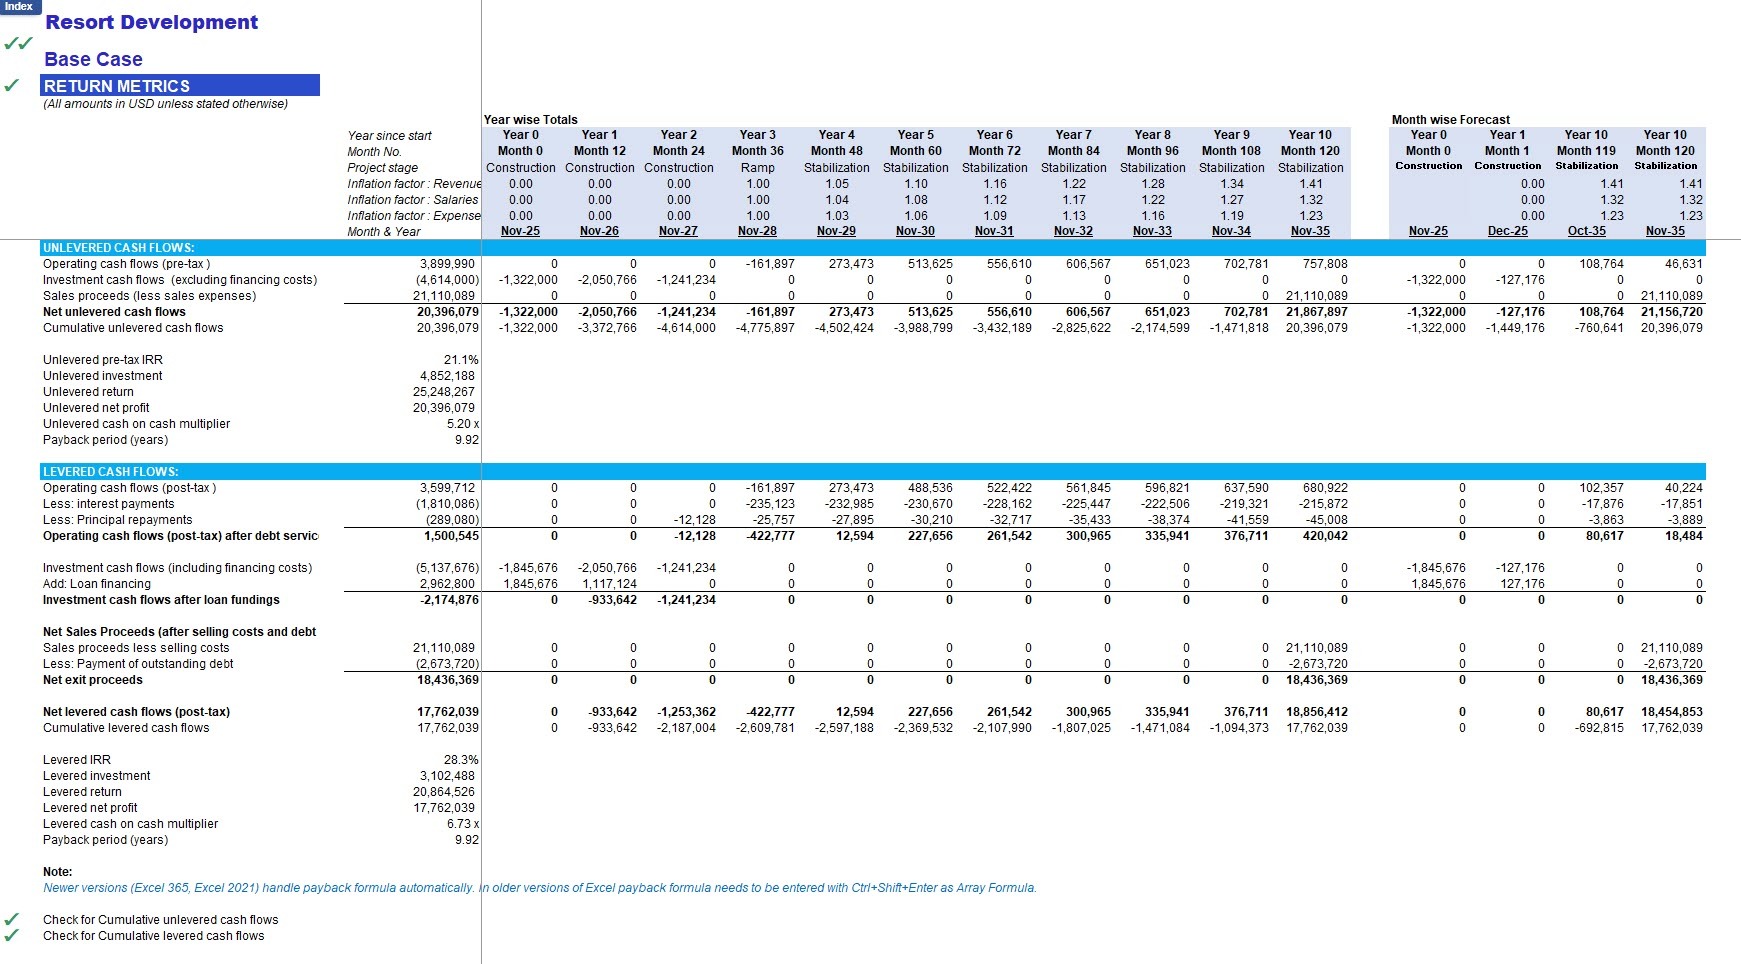
    • Return Metrics Tab: Unlevered IRR, Levered IRR, cash-on-cash multiples, payback period.
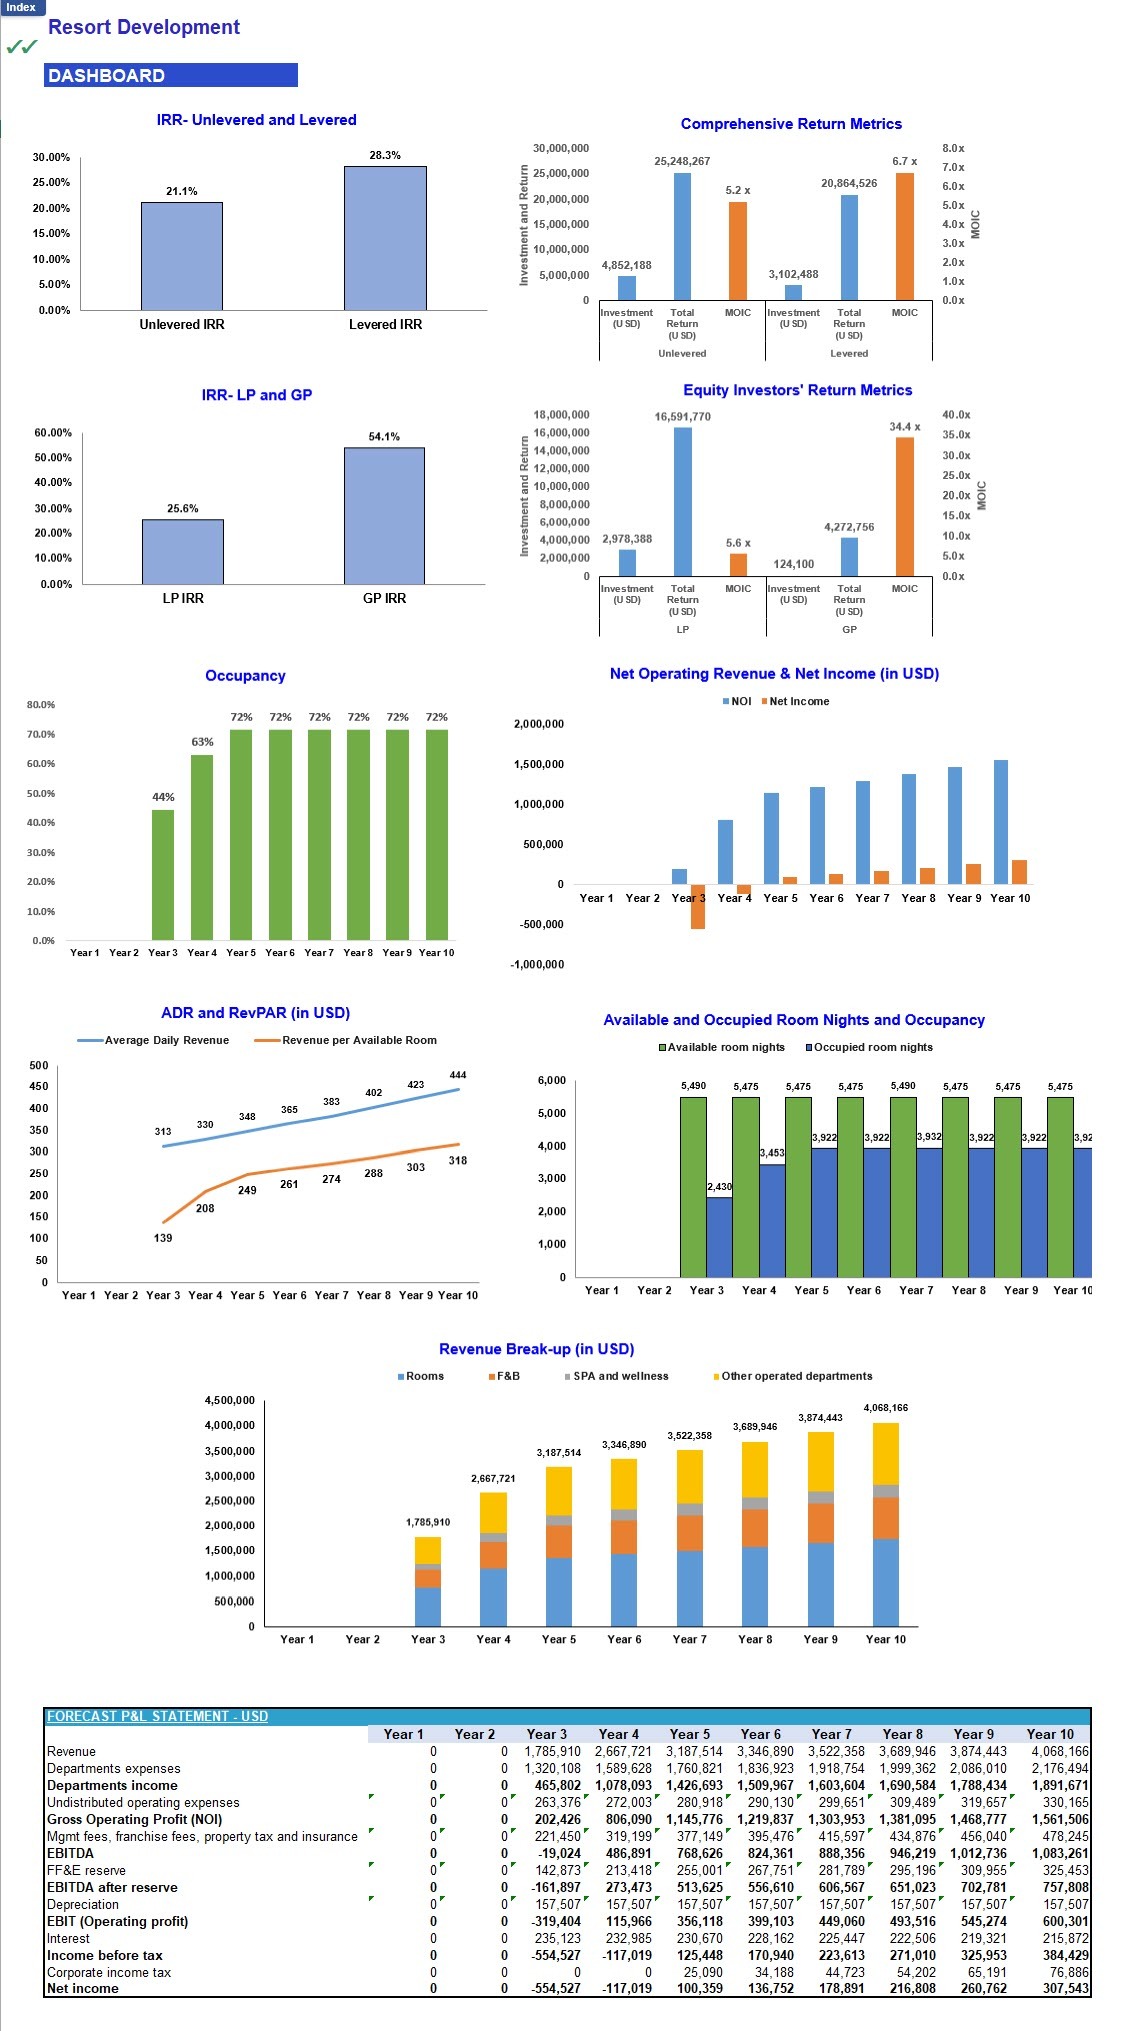
    • Dashboard Tab: Charts and summary tables for quick review.
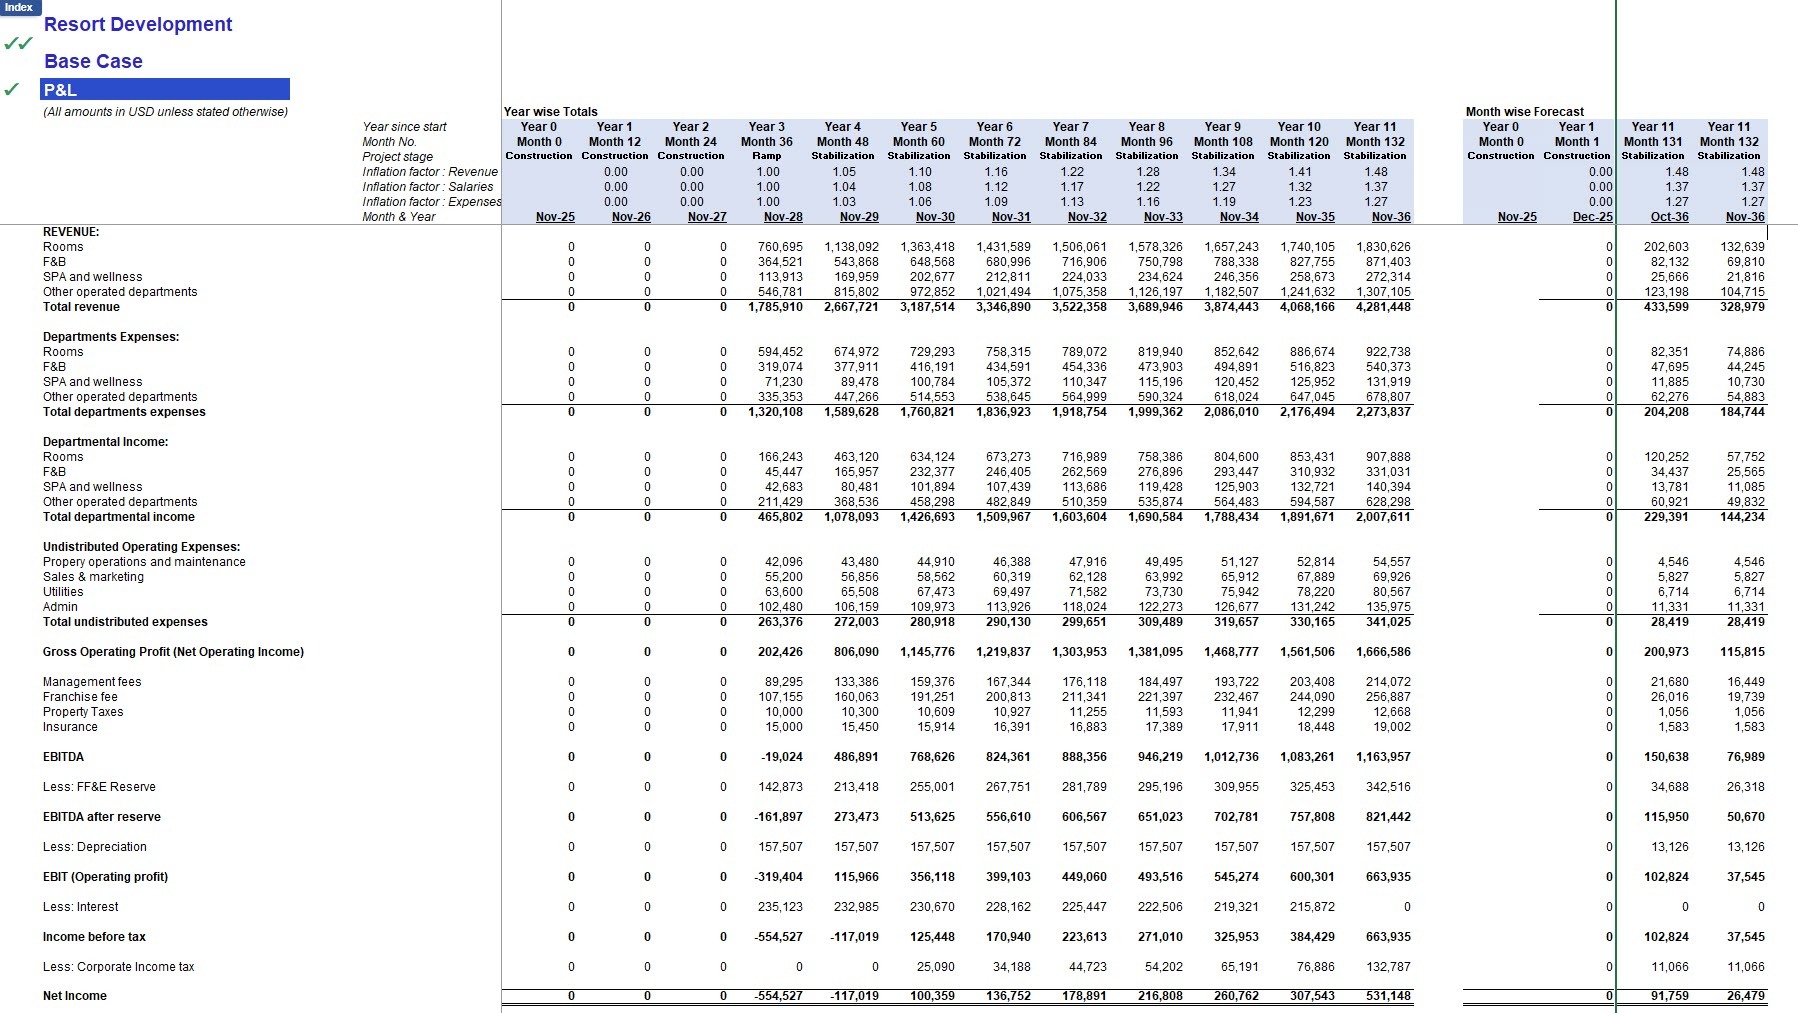
    • P&L Tab: Projected profit & loss statement — fully monthly for 10 years with the option to roll into annualized summaries.
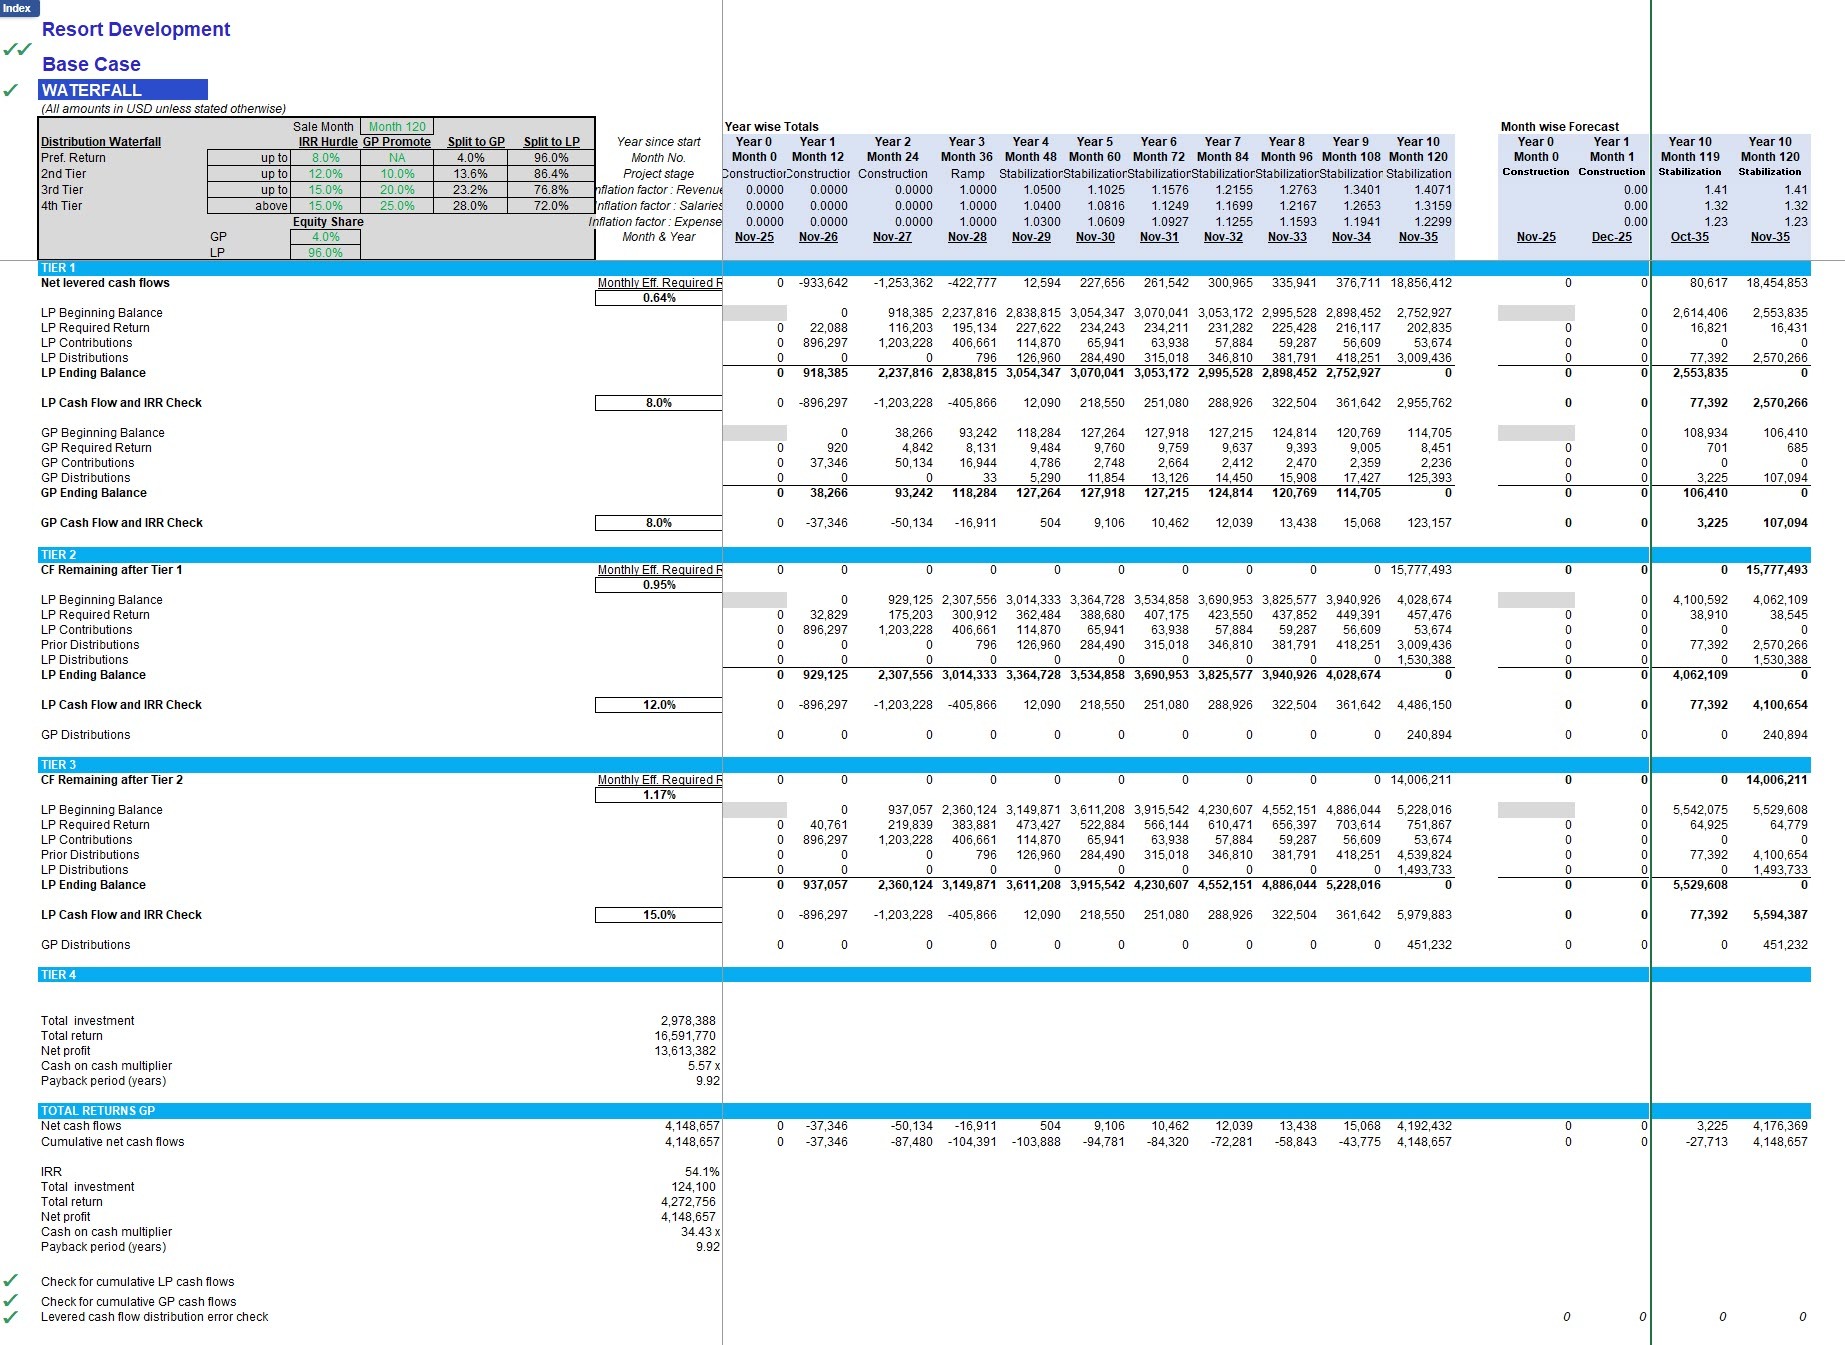
o Waterfall Distribution Tab: Detailed LP/GP distributions across hurdles, with IRR splits and promote allocation.


4. Department Section
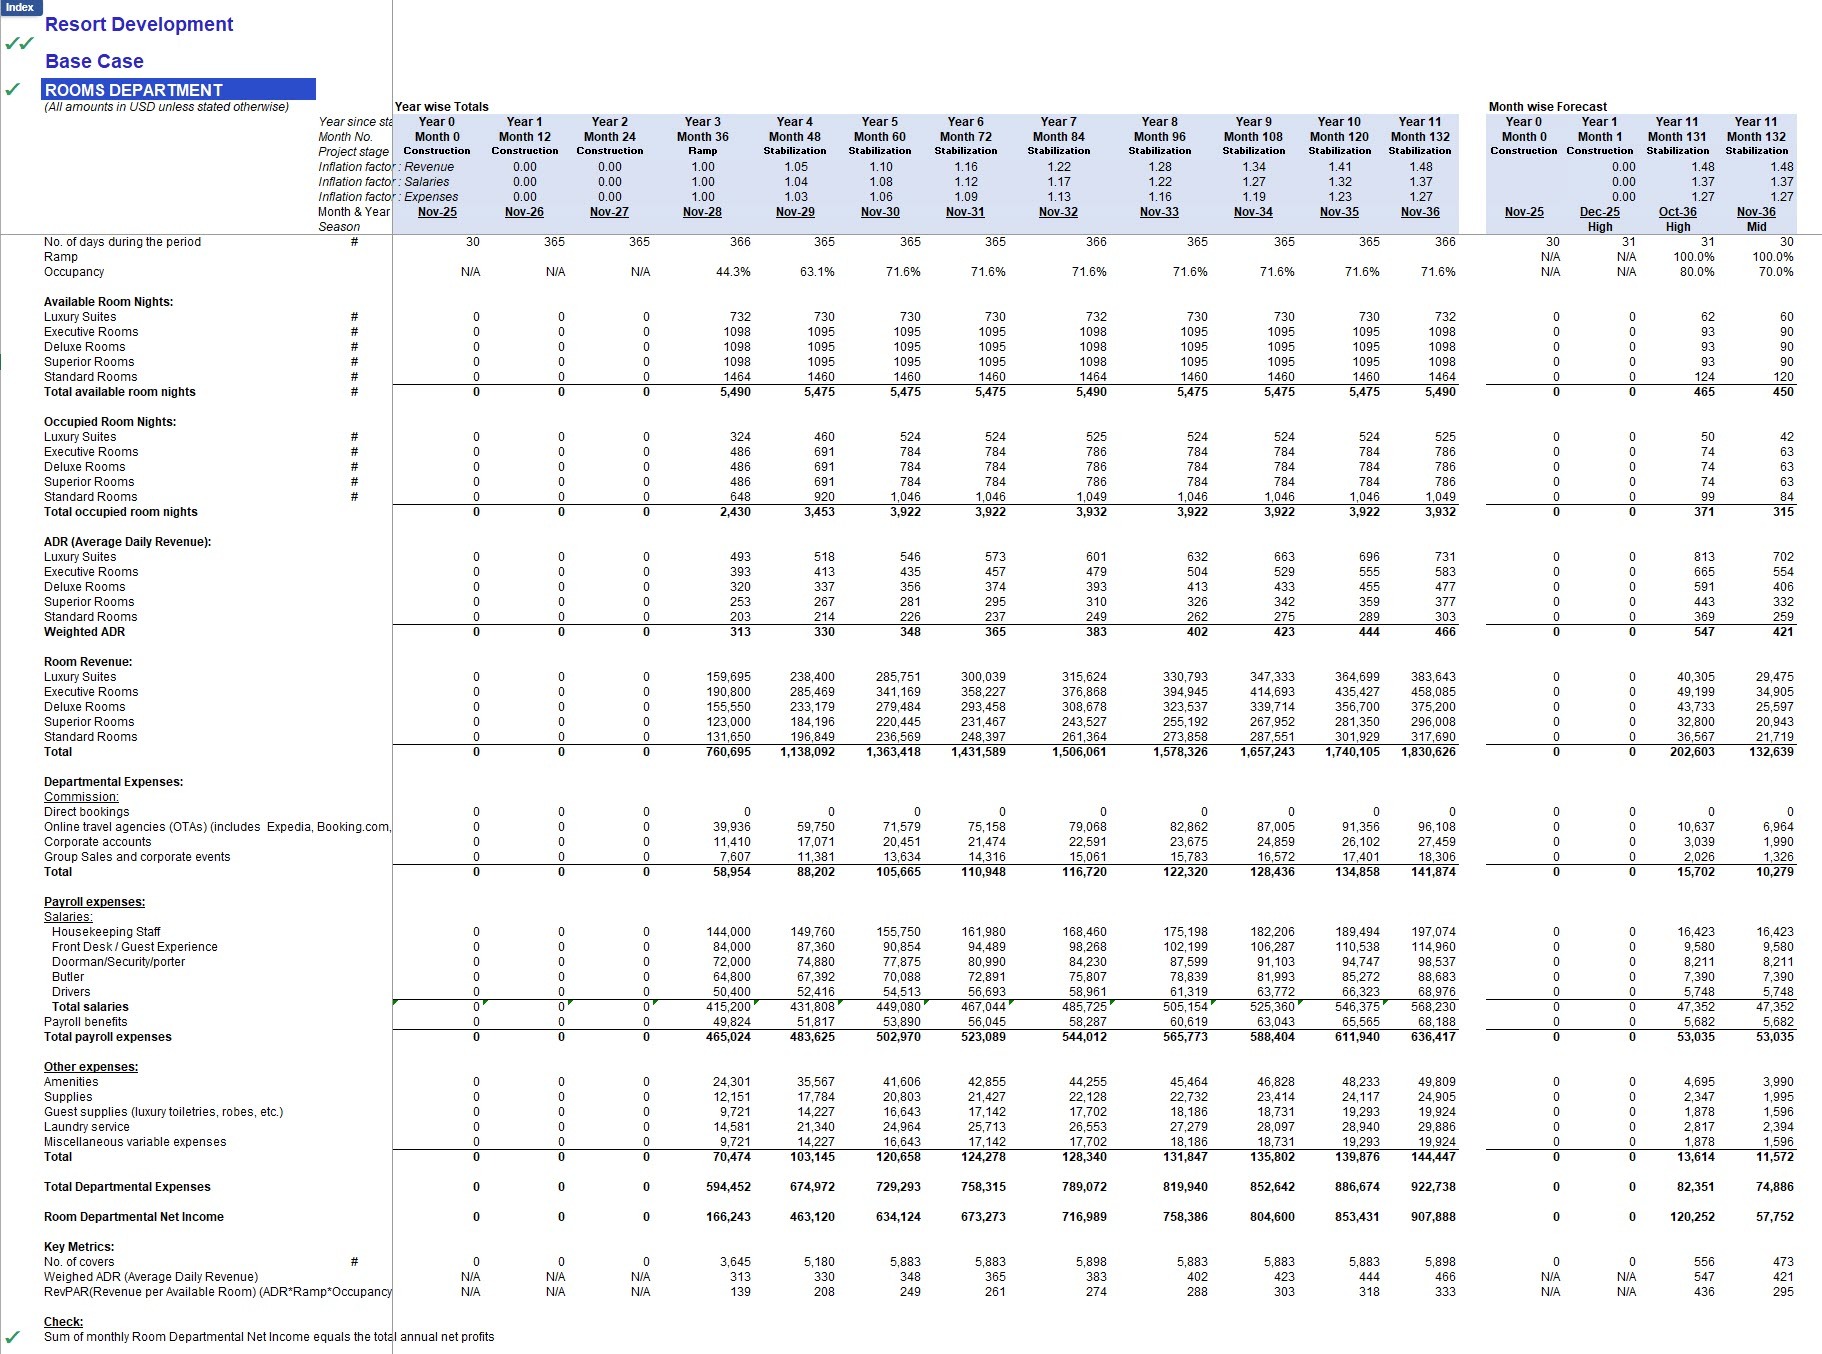
  • Rooms Department Tab:
    • Calculates available room nights, occupied room nights, ADR, and room revenues.
    • Includes departmental expenses, payroll, and allocable costs.
    • Produces key resort metrics such as ADR and RevPAR
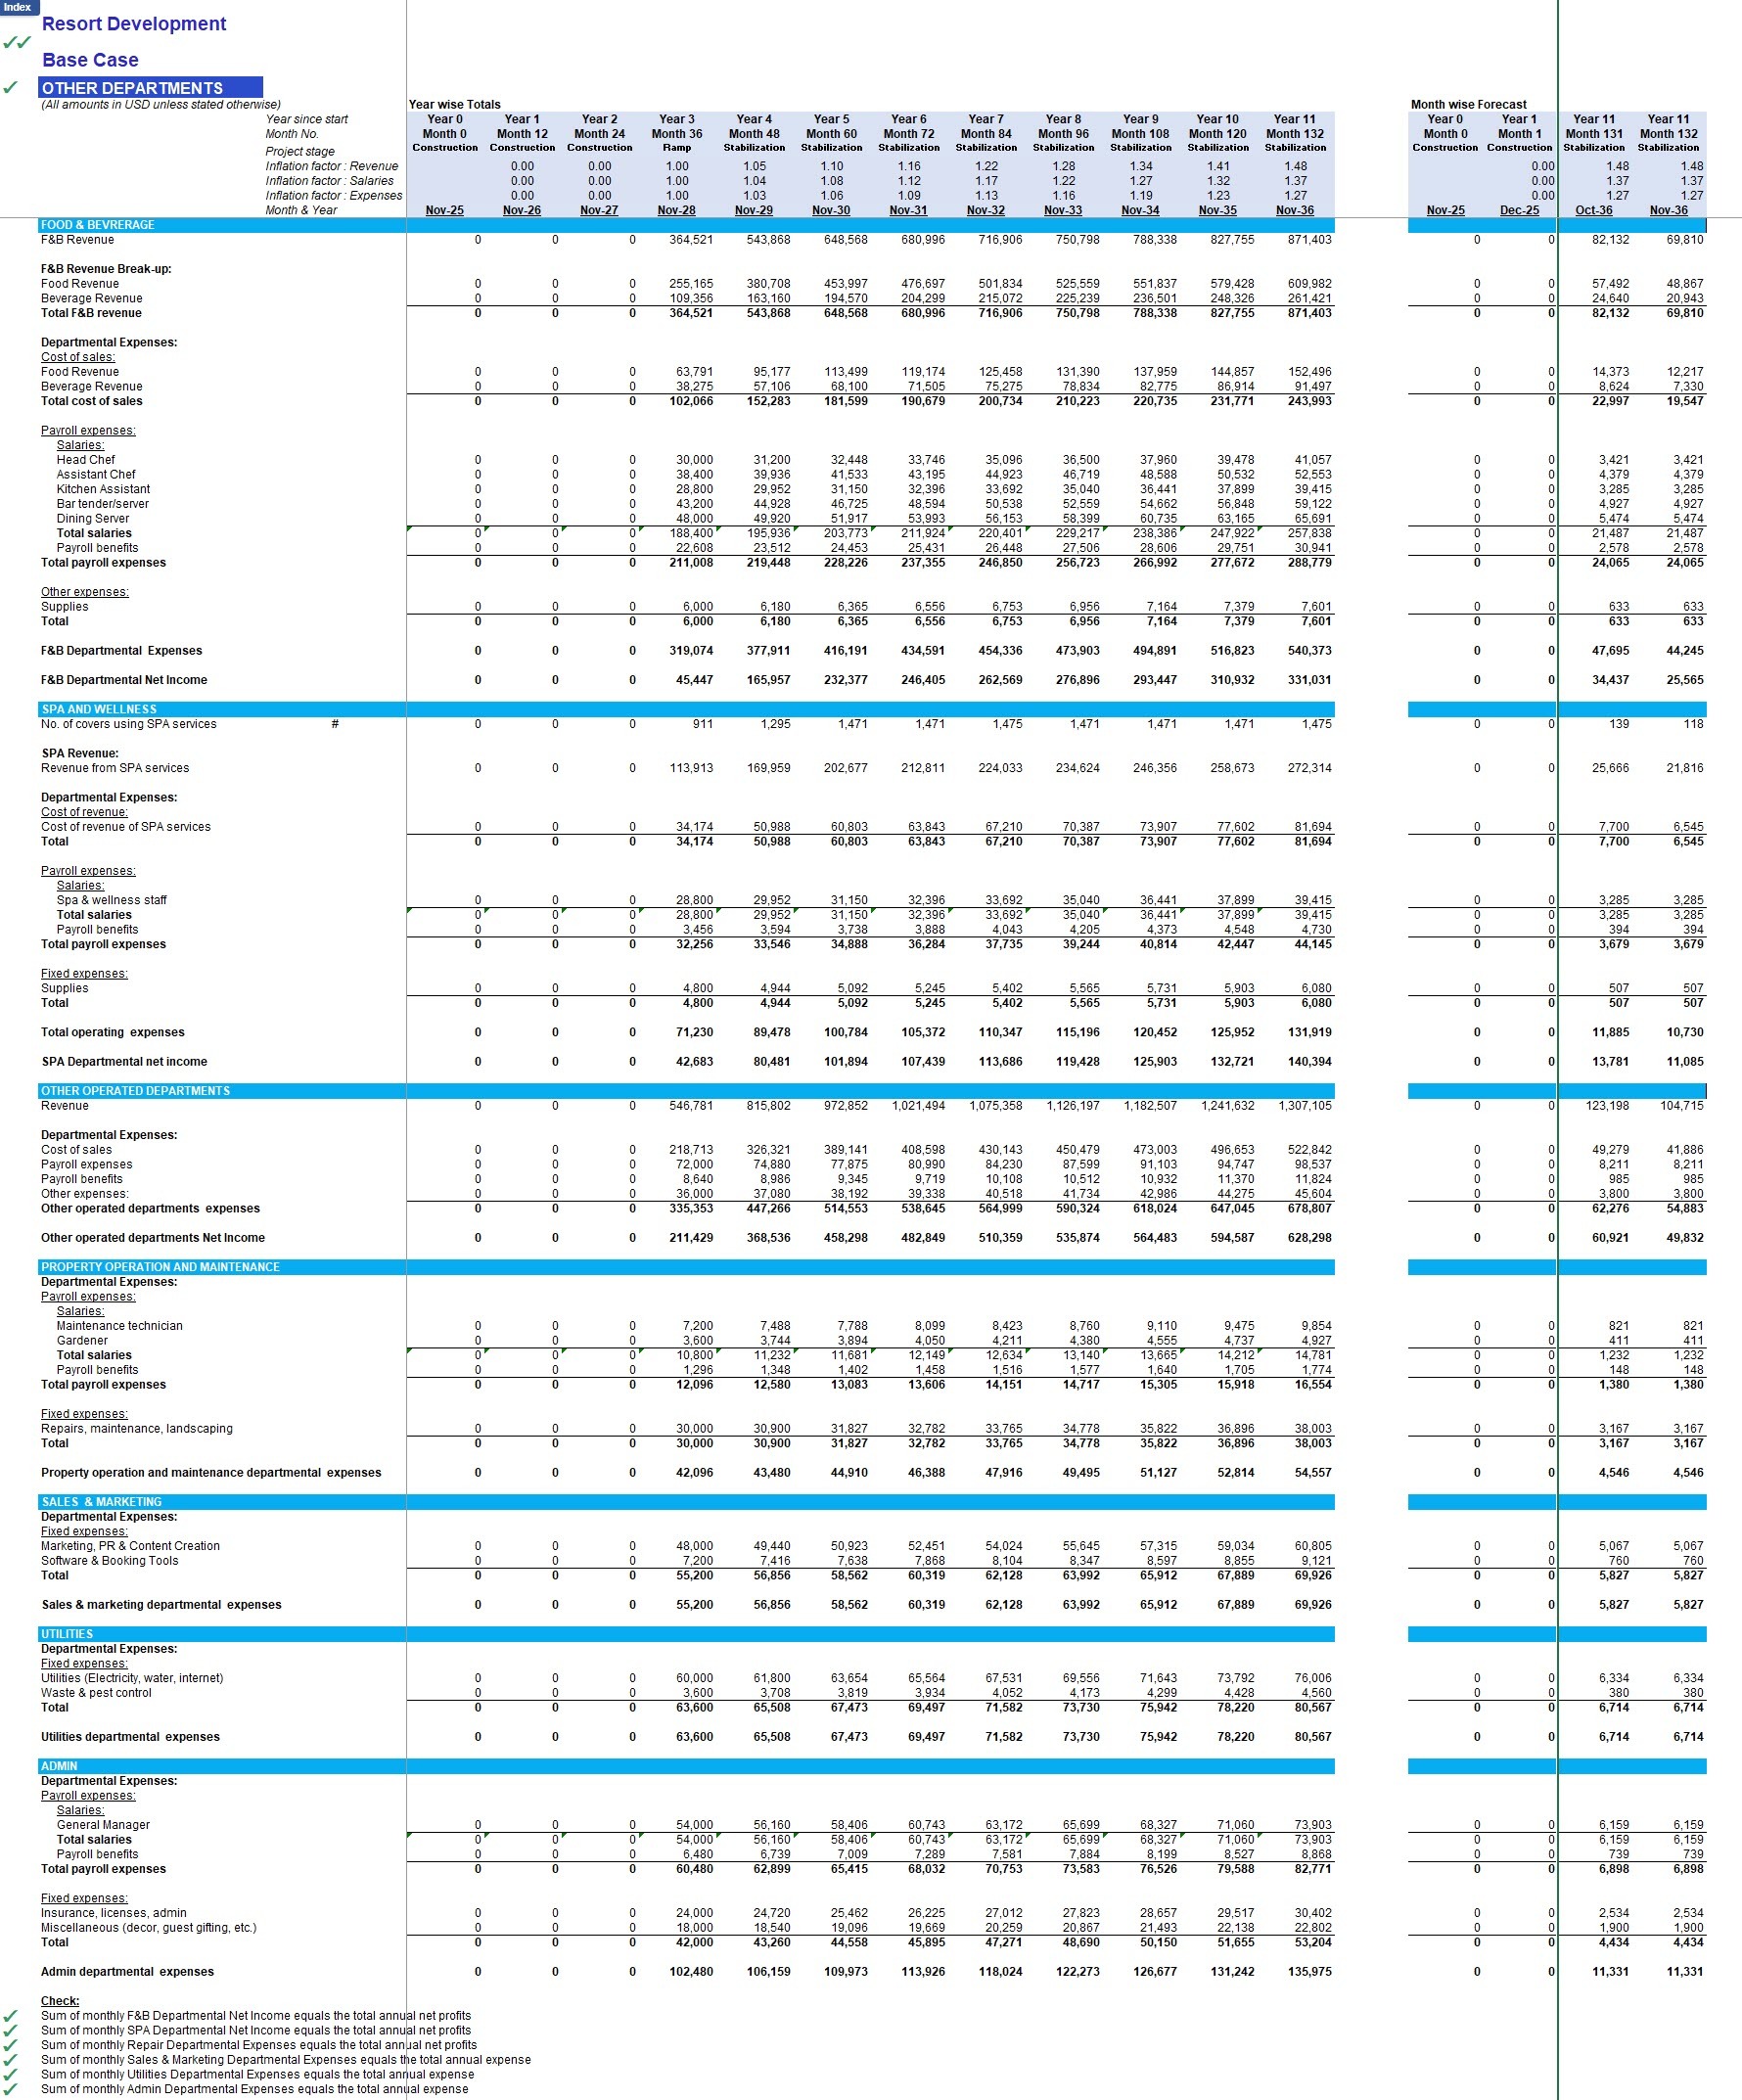
  • Other Departments Tab:
    • Summarizes revenues and expenses of supporting departments such as F&B, Spa & Wellness, Recreation & Activities, Retail, and other ancillary services.
    • Includes payroll, direct costs, and allocated overheads such as admin, repairs & maintenance, utilities, and sales & marketing.
5. Calculations Section
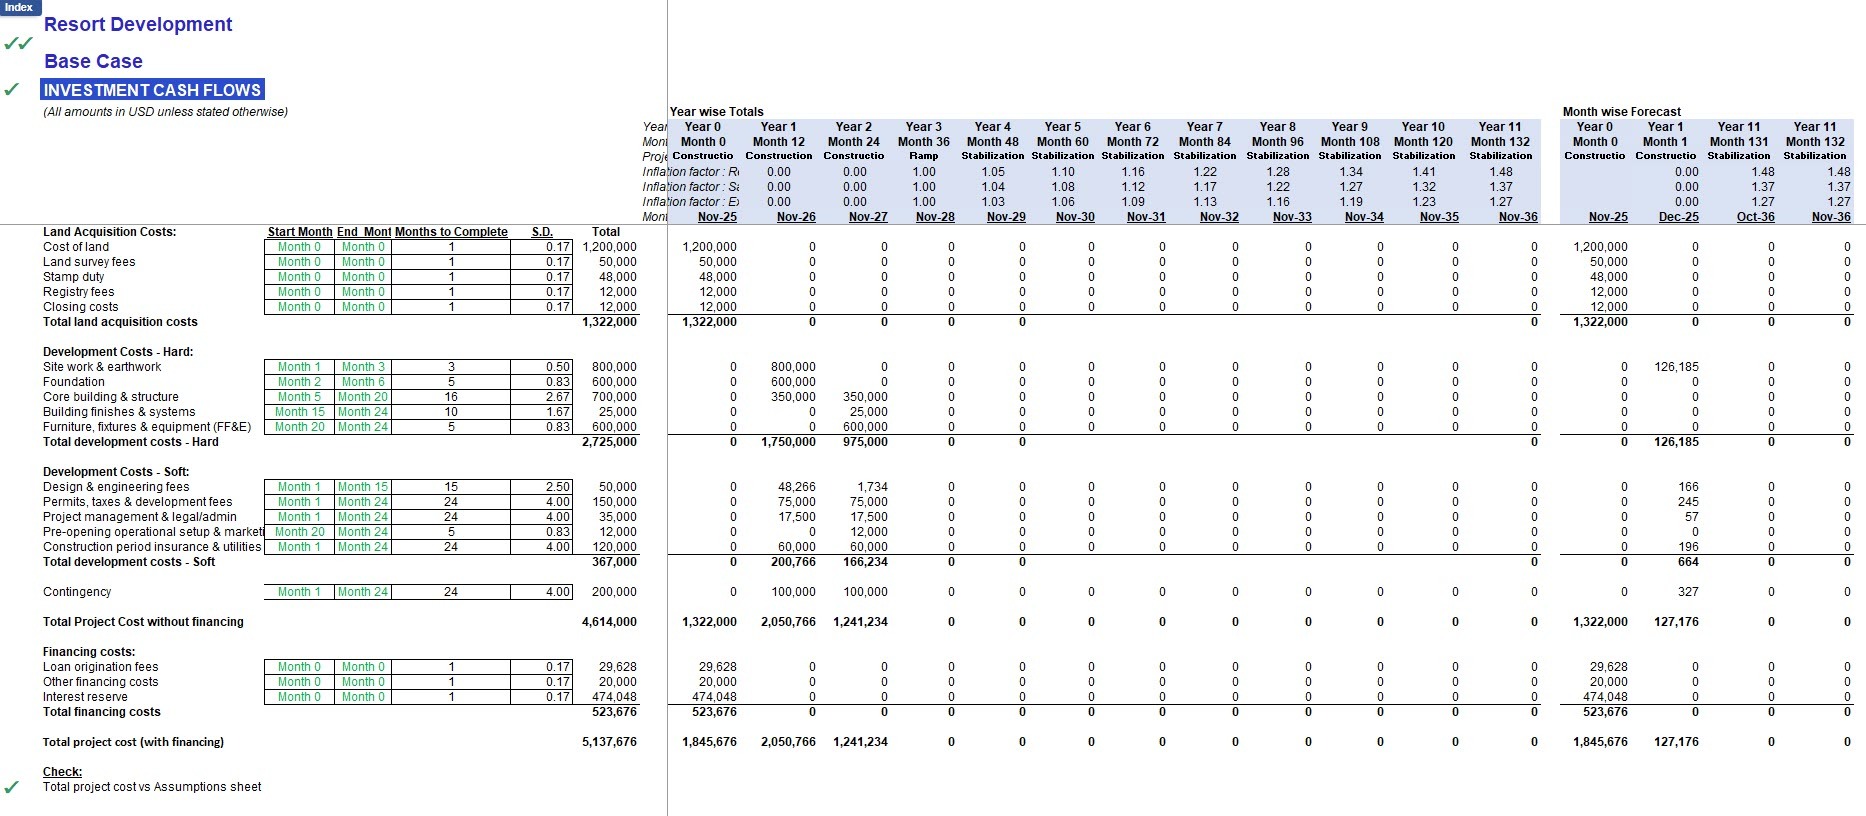
  • Investments Tab: Tracks monthly investment outlays across cost heads, using an S-curve to reflect realistic phasing.
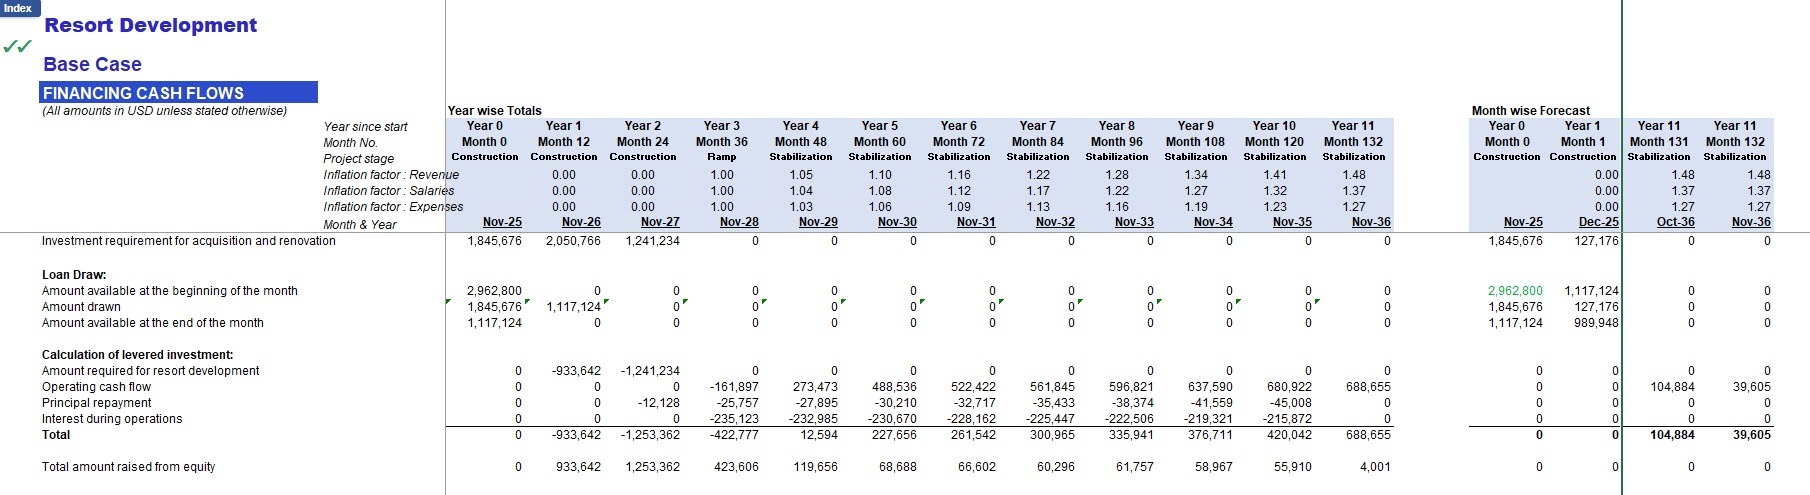
  • Financing Tab: Records monthly sources of equity and debt funding, aligned with investment cash flows and operating shortfalls.
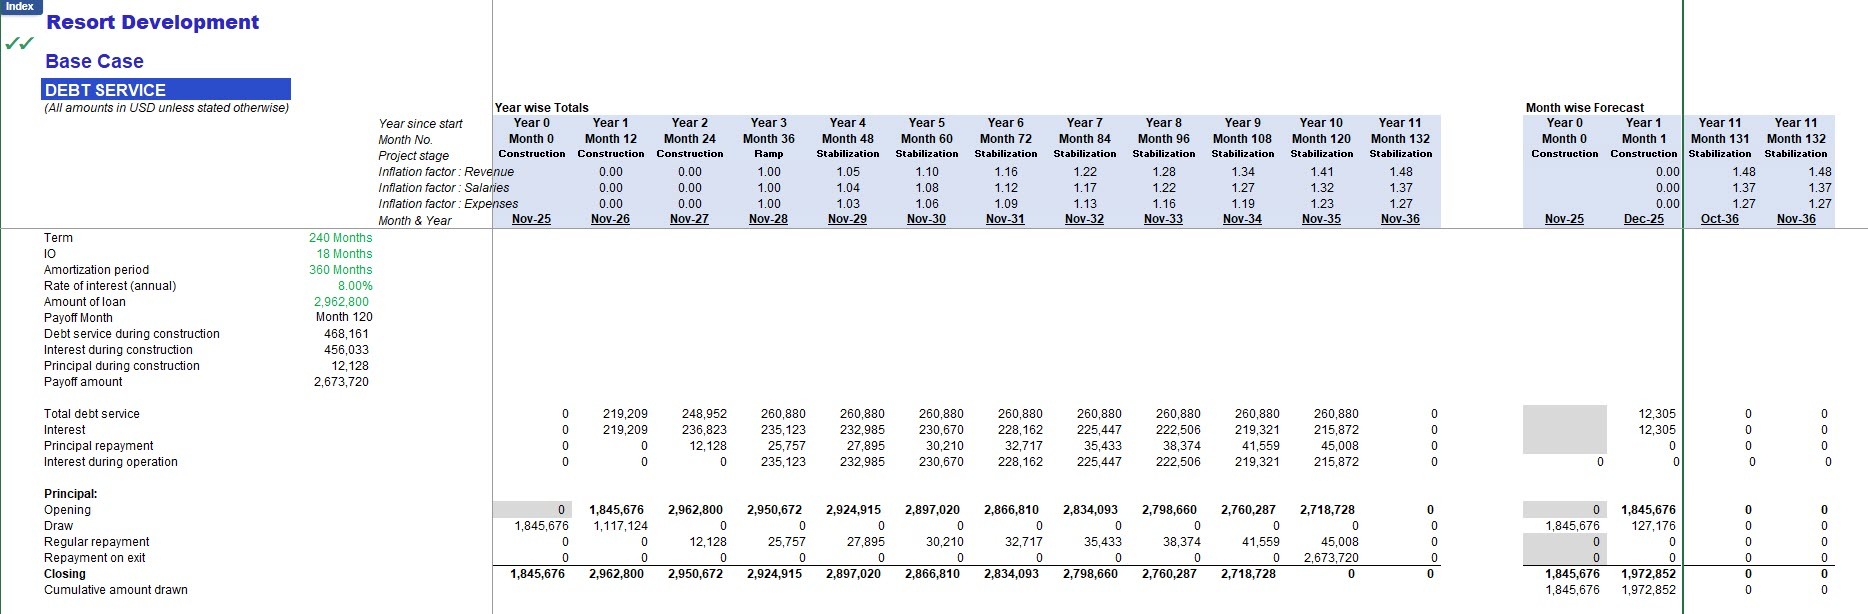
  • Debt Service Tab: Calculates interest expense, principal repayments, amortization schedules, and outstanding balances including payoff.
Other Features
  • Error-checking framework:
    • Cell A6 in each tab checks for tab-level errors.
    • Cell A3 in each tab checks for model-wide consistency errors.
    • Indicators display a green tick (✔) for no errors or a red X (✘) if issues are detected.
  • Navigation aid: Cell A1 on every tab links back to the Index tab.
  • Compatibility: Fully functional in Excel 2010 and later versions.
Why Choose This Model?

This model is purpose-built for resort development and investment projects. It balances clarity, flexibility, and investor-readiness, making it ideal for both internal feasibility analysis and external fundraising efforts. The structure provides 10 years of monthly forecasting with roll-up to annual summaries, ensuring detailed operational tracking and long-term efficiency. It incorporates S-curve investment phasing, departmental revenues and costs (Rooms, F&B, Spa & Wellness, Other Operated Departments), and comprehensive return metrics such as levered/unlevered IRR, MOIC, and payback period. 


Whether you’re evaluating a new resort project, securing financing, or preparing investor presentations, this model adapts to your requirements and provides the analytical depth stakeholders expect.

This Best Practice includes
1 Excel Sheet

Acquire business license for $139.00

Add to cart

Add to bookmarks

Discuss

Further information

This best-practice financial model is designed to provide a clear framework for evaluating the feasibility, profitability, and financing of resort projects. It enables investors, developers, and advisors to analyze costs, revenues, and returns with accuracy, ensuring informed decision-making and effective fundraising.

This financial model is best suited for new resort development projects, feasibility studies requiring detailed 10-year projections, investment analysis, and preparing fundraising presentations. It is particularly effective for evaluating project costs, revenues, and financing structures under multiple scenarios.


0.0 / 5 (0 votes)

please wait...