
Originally published: 16/08/2024 11:26
Publication number: ELQ-47960-1
View all versions & Certificate
Publication number: ELQ-47960-1
View all versions & Certificate

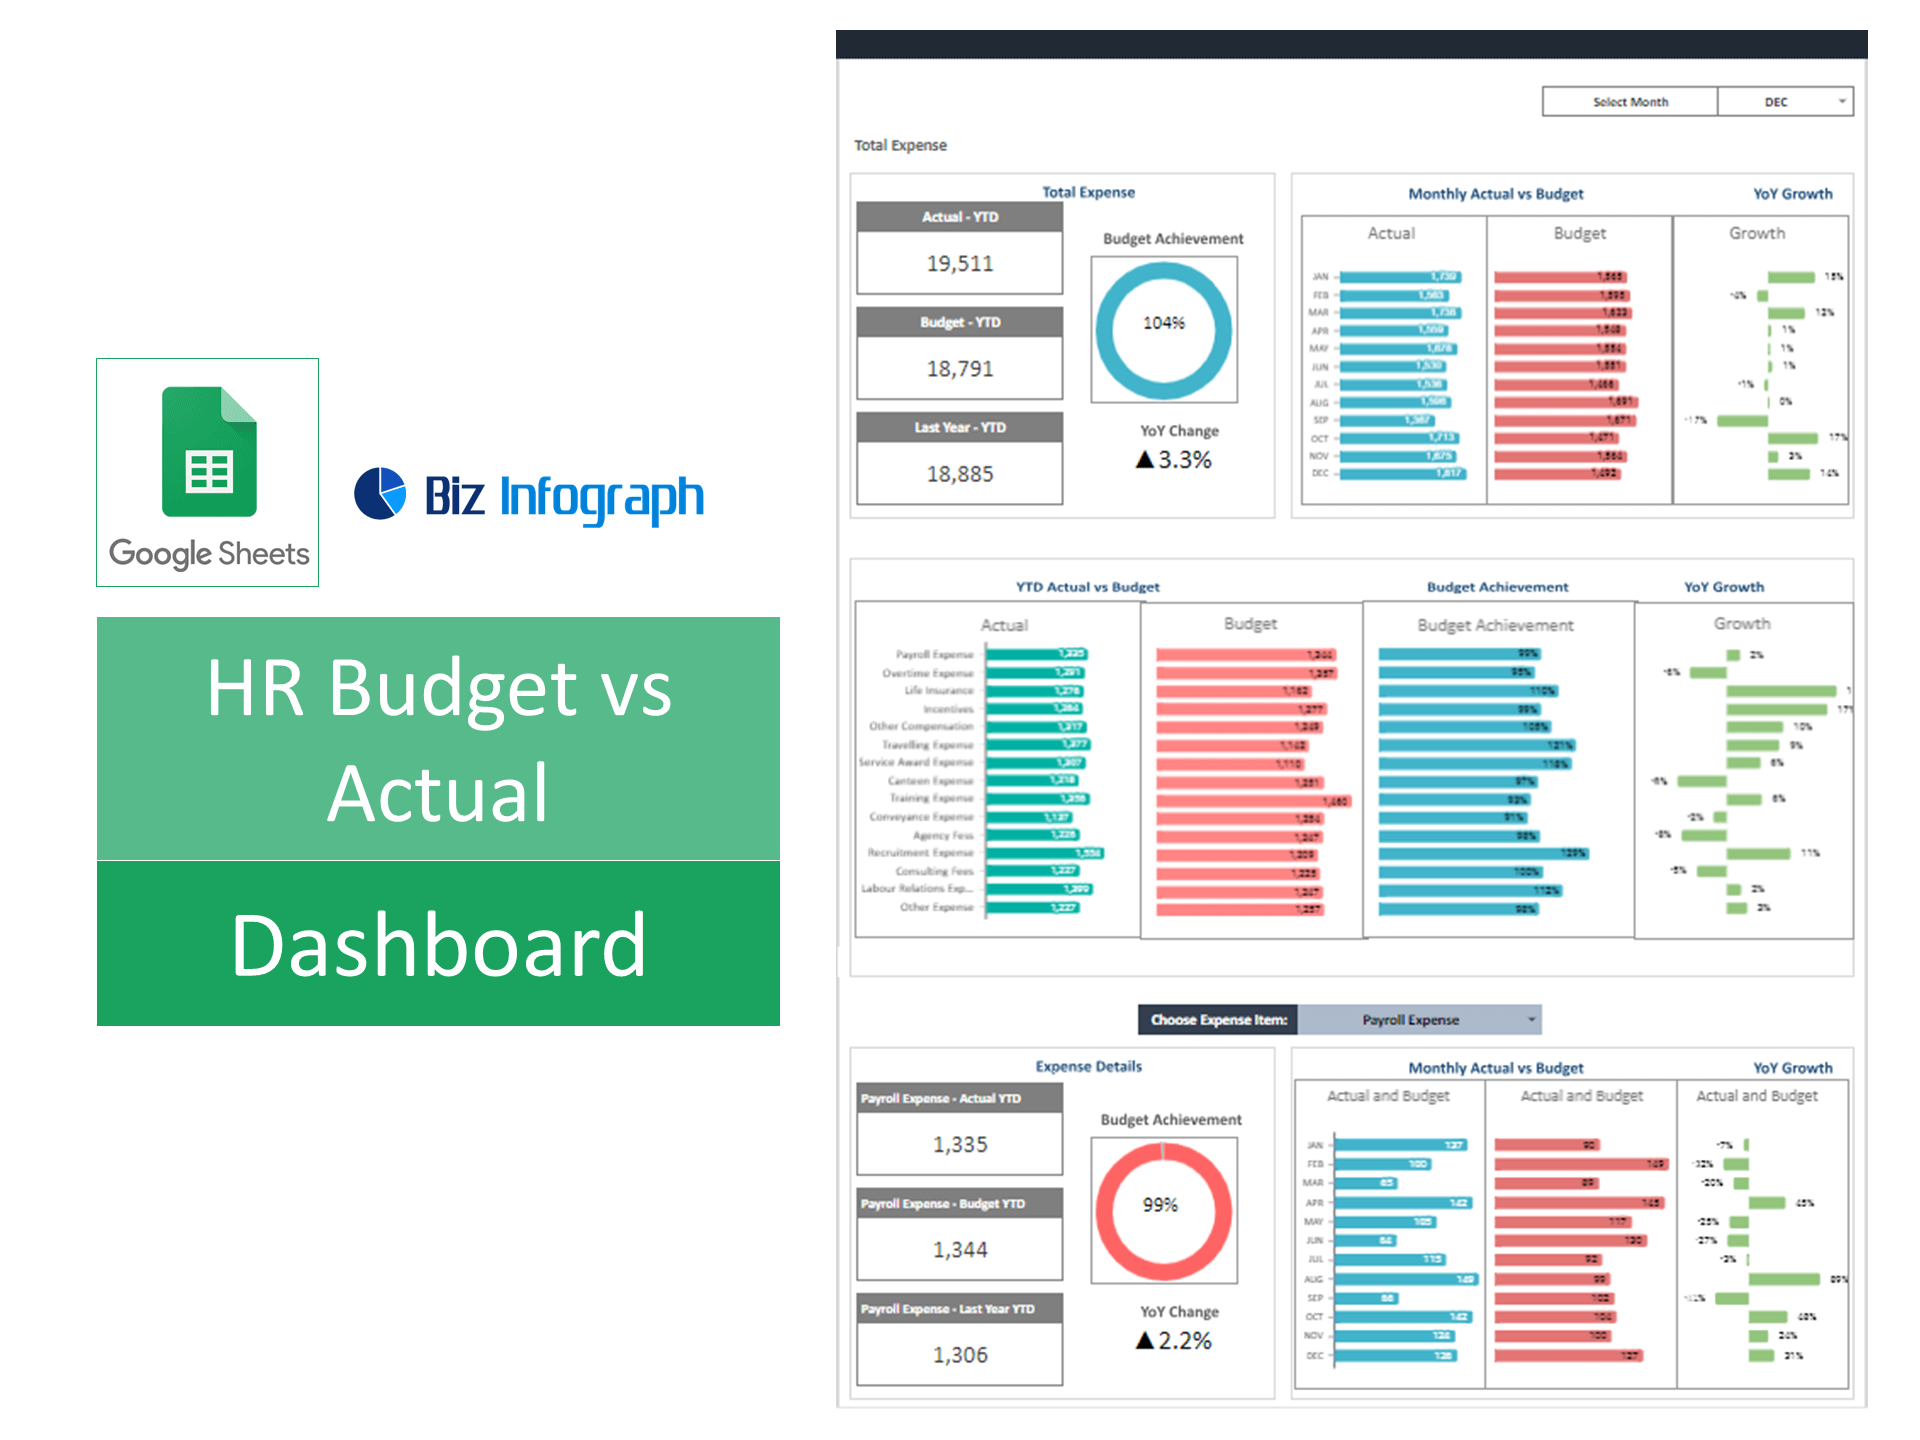
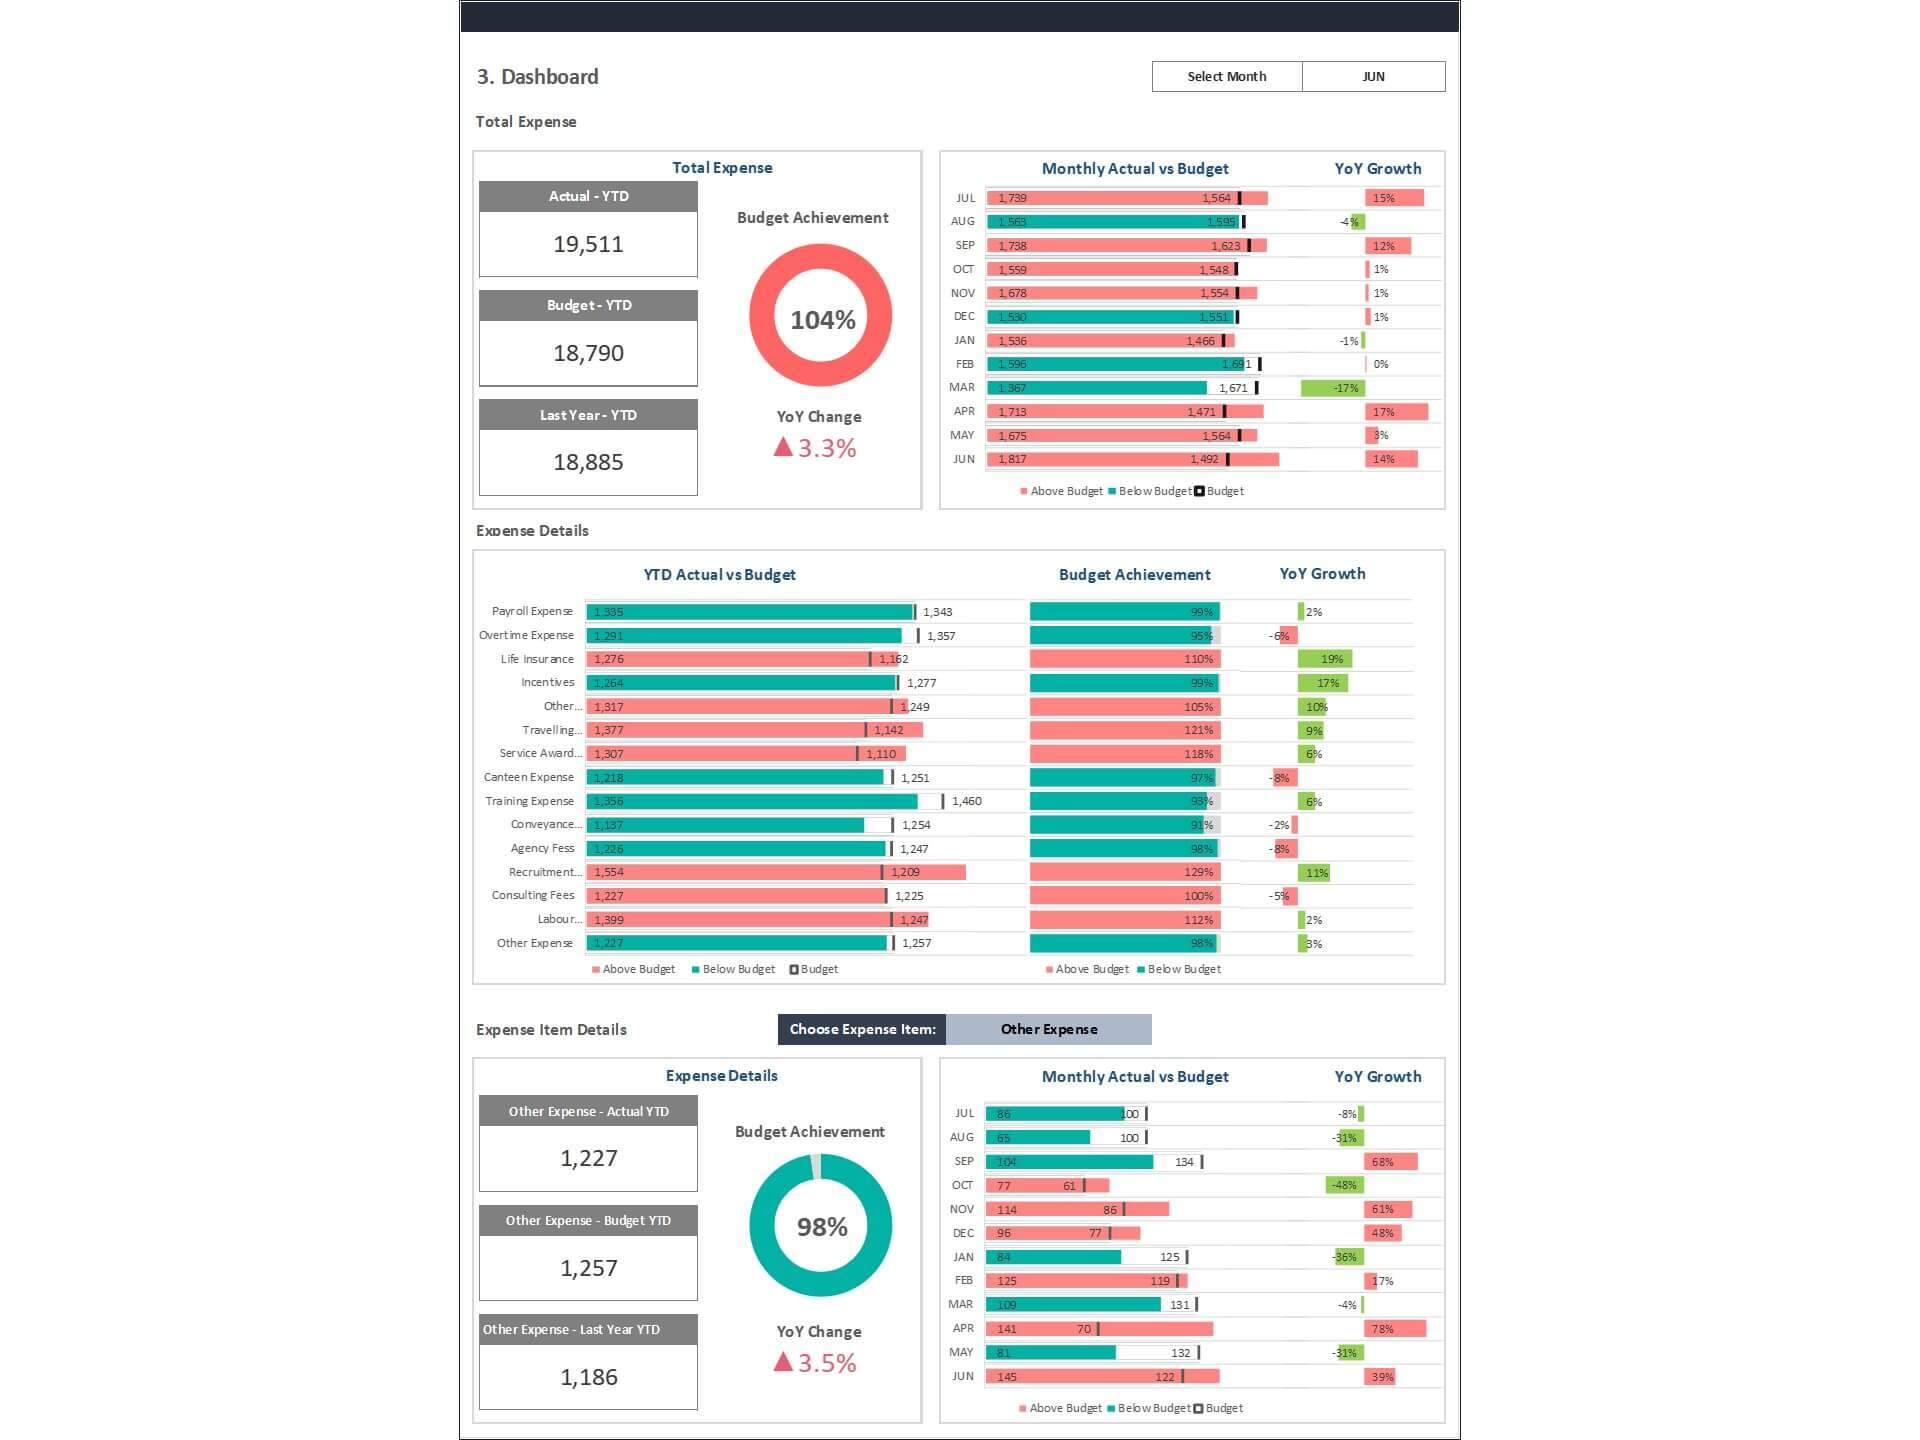
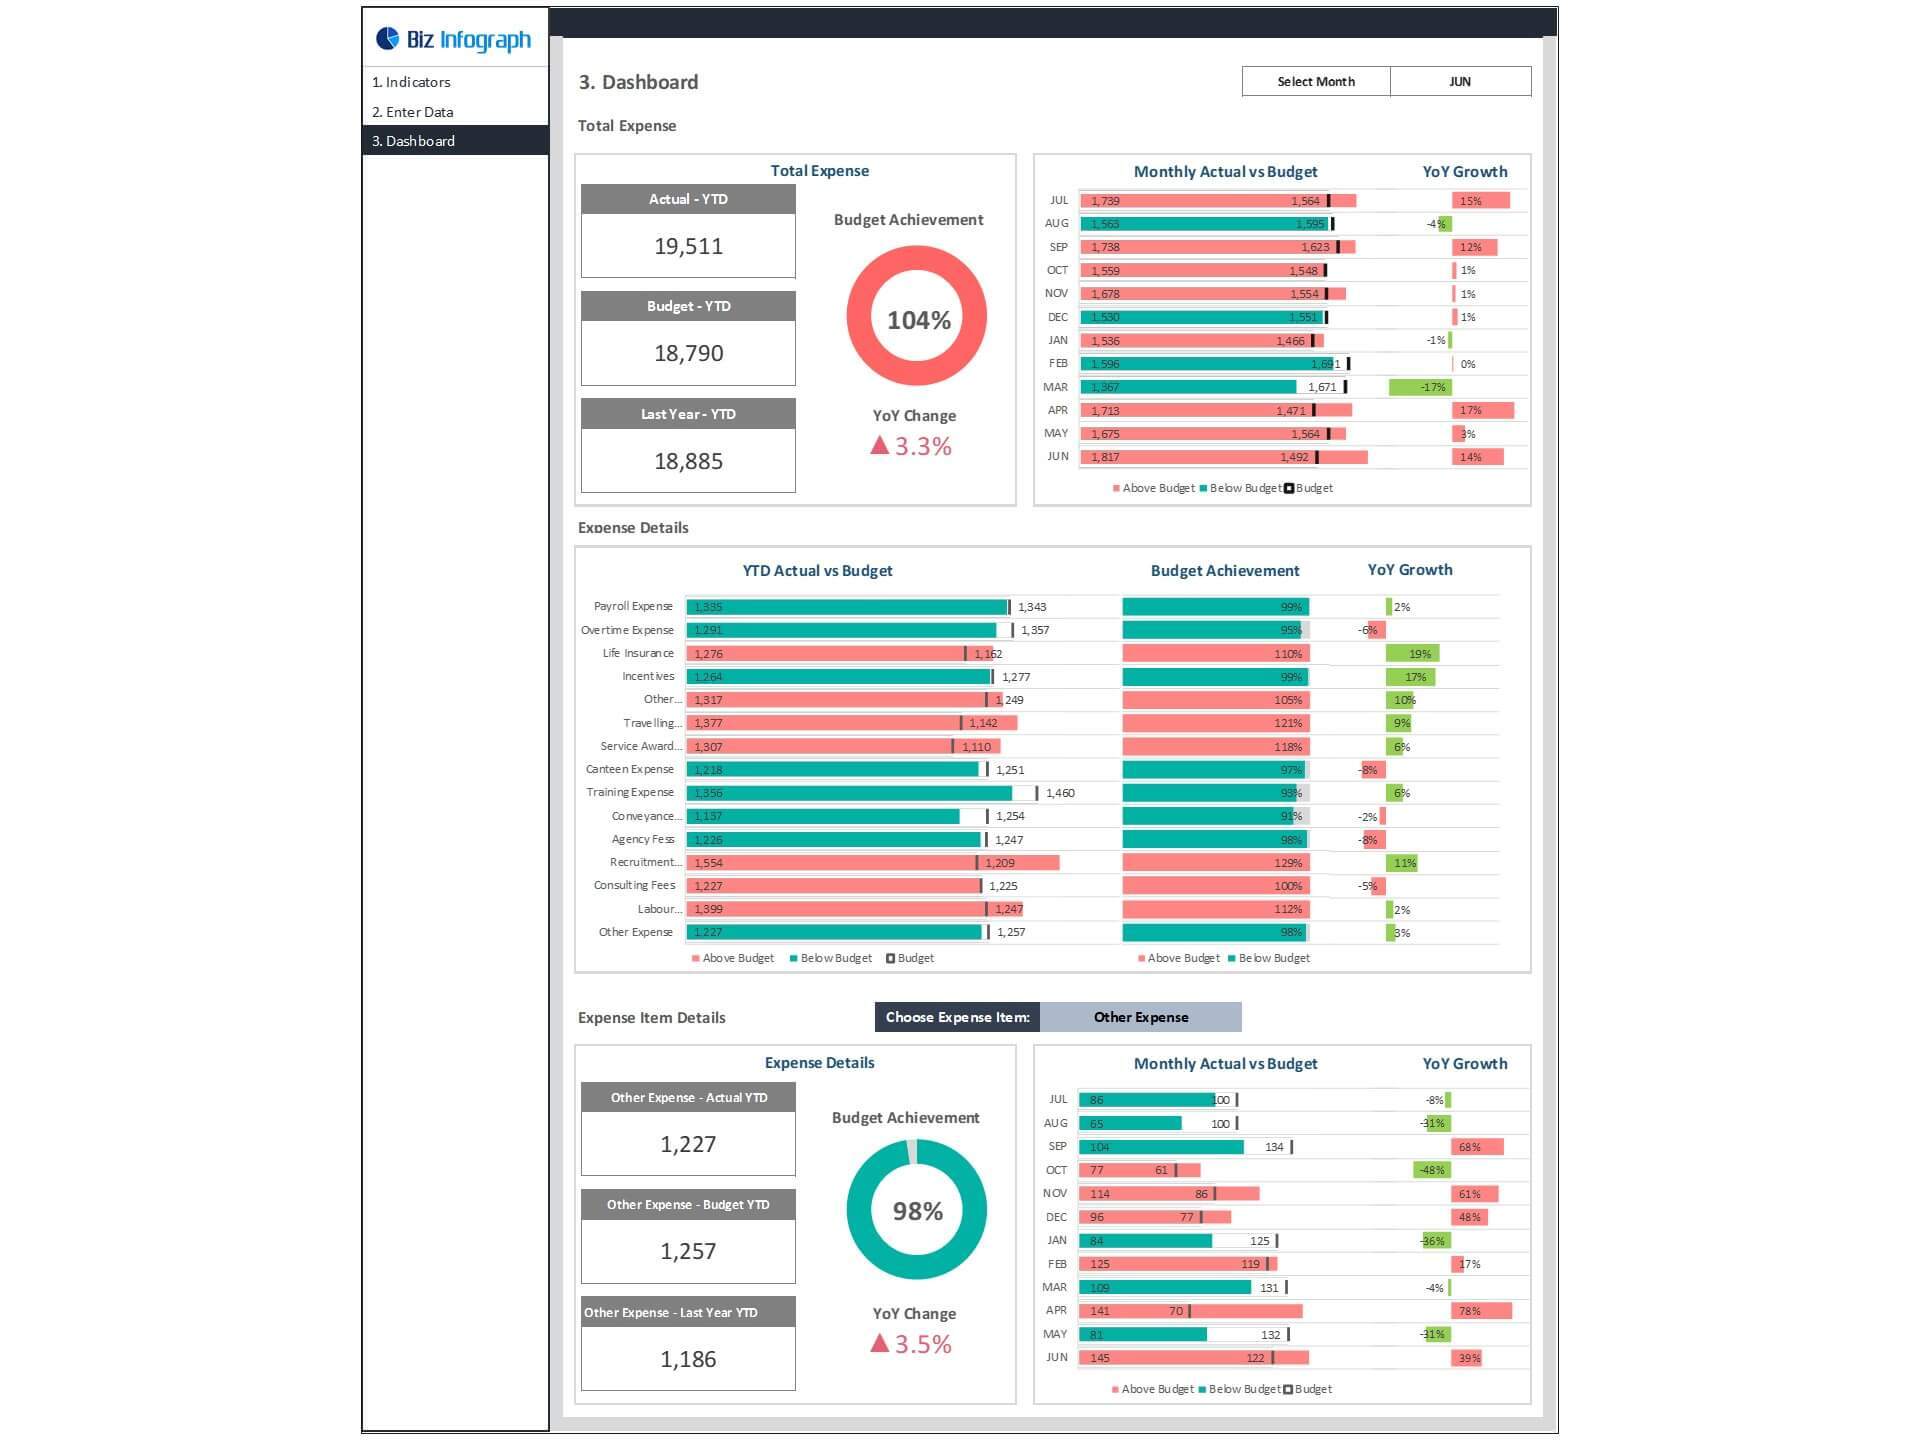
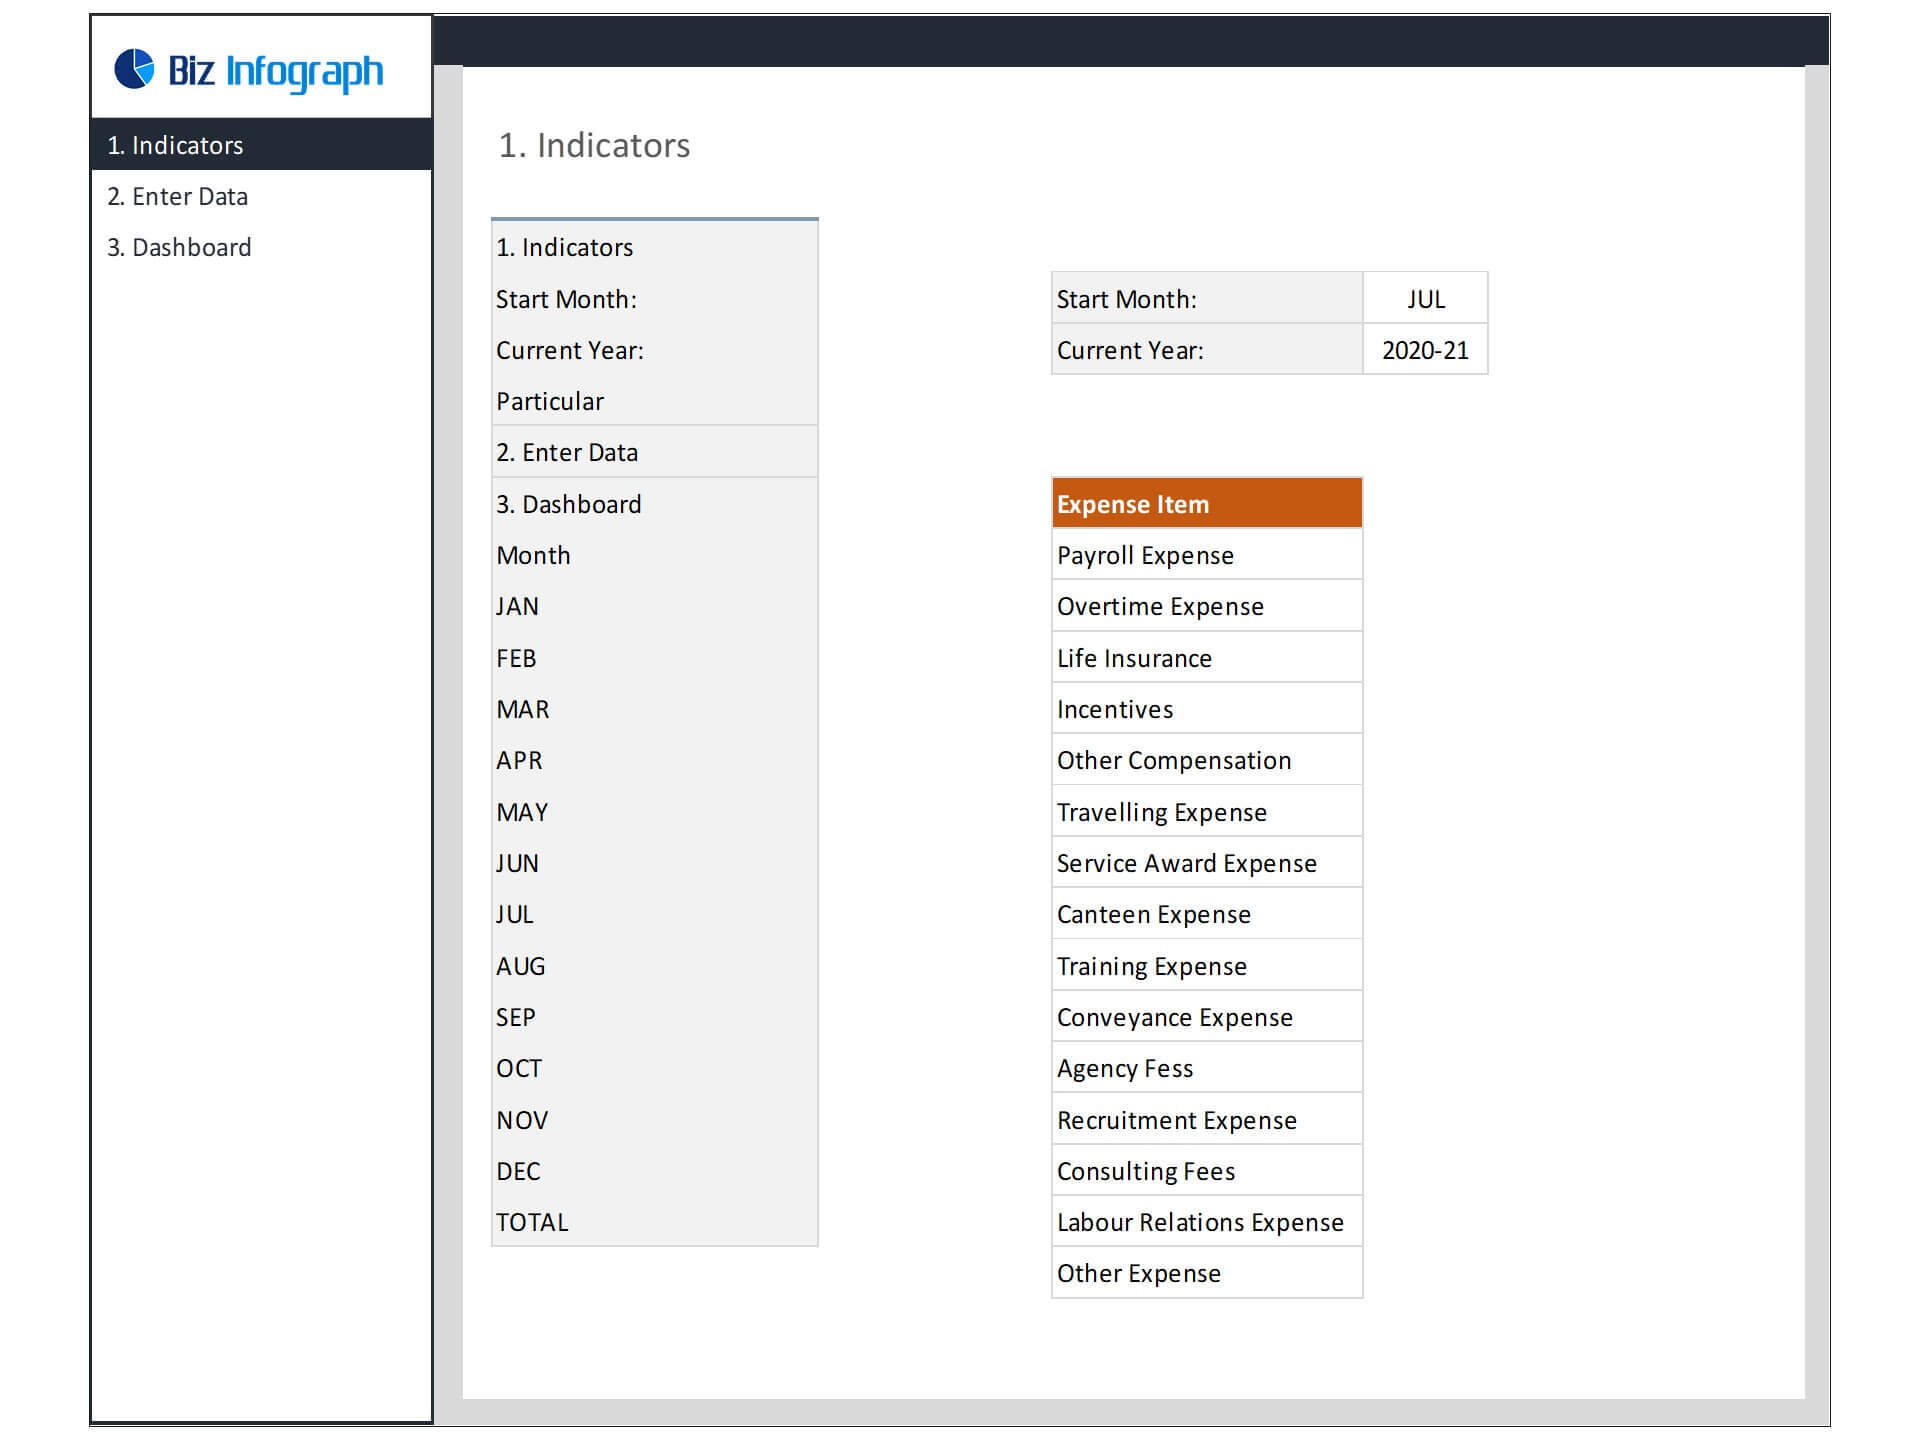
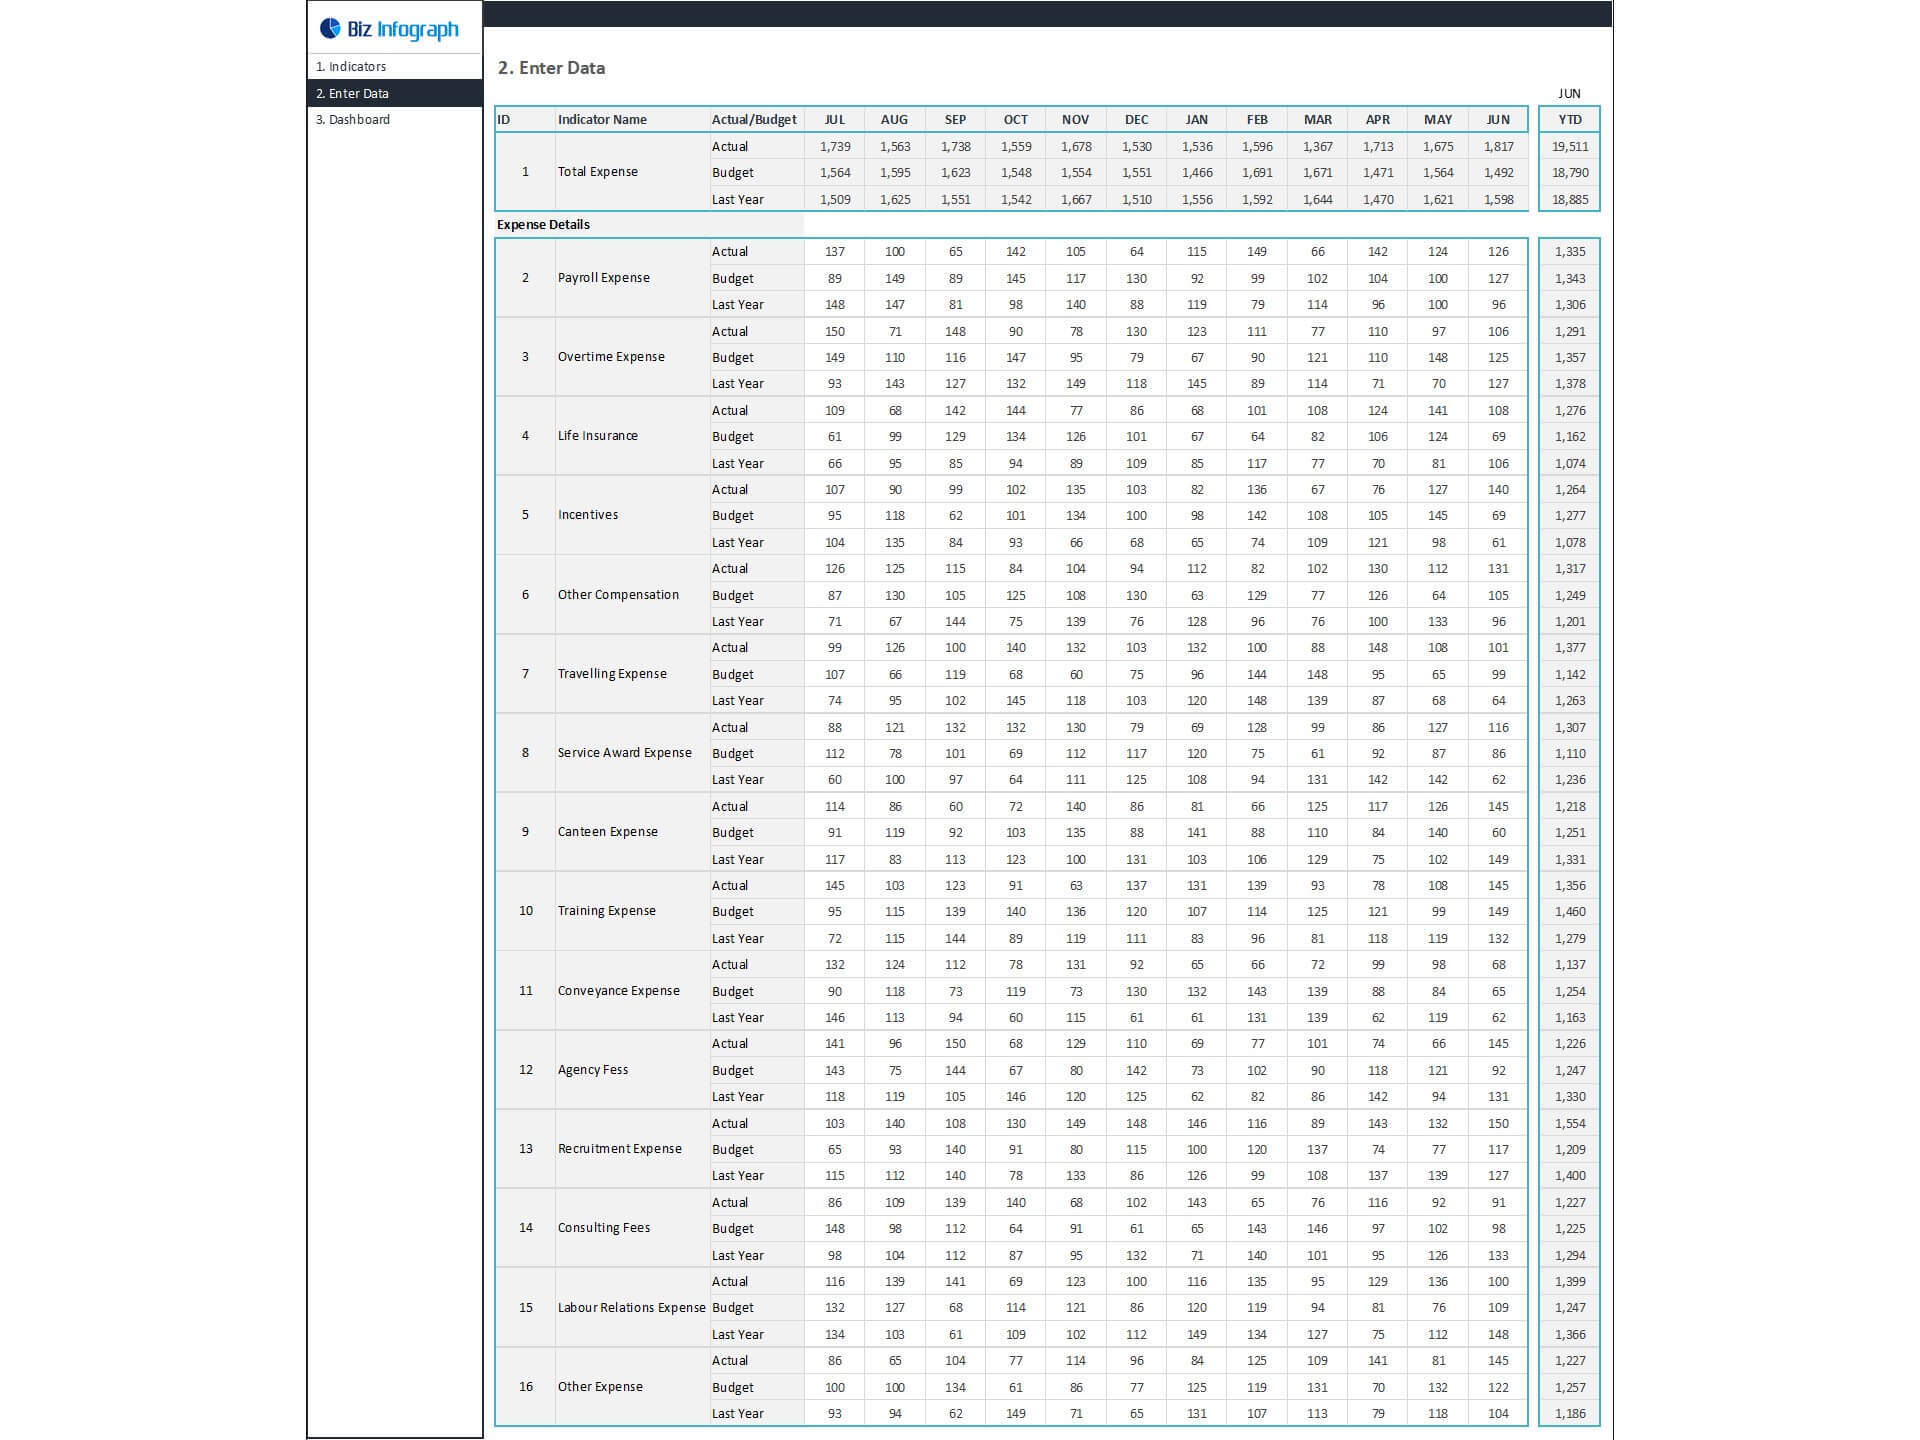
HR Budget vs Actual Dashboard
This HR Dashboard helps visualize the actual human resource expenditure compared to the target.
Biz Infograph is bringing clients a range of high-quality, well-designed, and easy-to-use professionally designed slides and dashboards.Follow 10
