DSO Tracker: Days Sales Outstanding Model and Dashboard (Monthly, Quarterly and Annual)
Originally published: 19/08/2026 16:04
Publication number: ELQ-43125-1
View all versions & Certificate
certified

DSO Tracker: Days Sales Outstanding Model and Dashboard (Monthly, Quarterly and Annual)

A plain English, industry agnostic Excel template for measuring, tracking and reporting Days Sales Outstanding. Two numbers a month is all it takes.

Description
What this is
Most DSO templates are built by finance people for finance people. They assume you already know what a countback calculation is, they bury the inputs across five tabs, and they break the moment you add a row. This one is built the other way round.

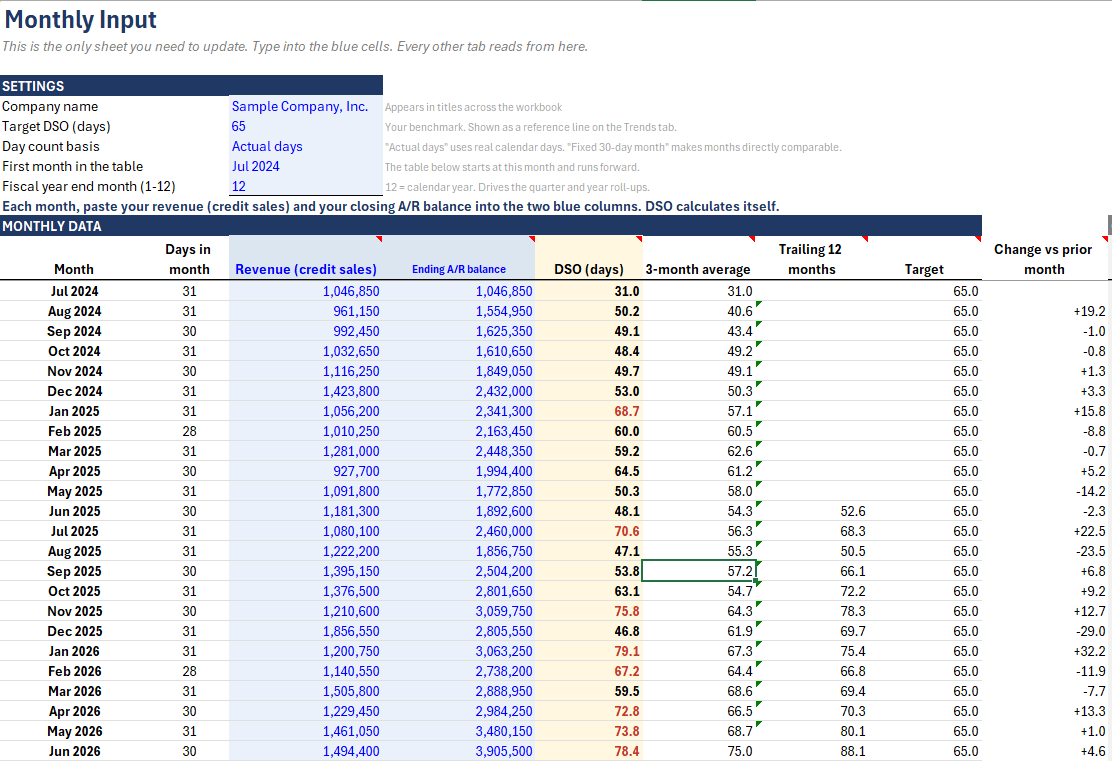
You fill in one sheet. Every month you type two numbers: revenue sold on credit, and your closing accounts receivable balance. That is the entire data requirement. From those two figures the model calculates your DSO, smooths it with a three month average, builds a trailing twelve month view, rolls everything up into fiscal quarters and fiscal years, and draws four charts. Nothing else in the workbook needs to be touched.

It works for any industry. There is no assumed revenue model, no sector specific logic, no hardcoded terms. A construction firm on 60 day terms, a SaaS business billing monthly, a wholesaler, a staffing agency and a healthcare provider can all use the same file without modification.

Who it is for
  • Business owners and managing directors who want to know how long their cash is tied up
  • Finance managers and controllers who need a clean monthly DSO pack without building one from scratch
  • Credit and collections teams tracking whether their efforts are actually working
  • Consultants and fractional CFOs who need a client ready deliverable on day one
  • Anyone preparing a board pack, lender report or investor update that needs a receivables metric
No accounting qualification required. Every column heading has a hover note explaining in plain English what the number means and where in your accounting system to find it.

What is inside

Start Here. A one page briefing. The three minute version of how to use the file, what DSO actually measures and why it matters, what good looks like, why monthly, quarterly and annual views tell you different things, and the five mistakes people most commonly make when calculating DSO.

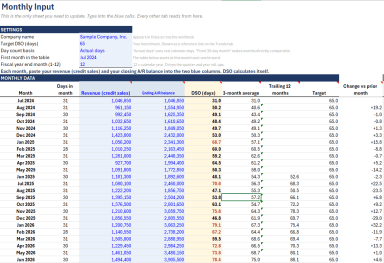
Input. The only sheet you fill in. A settings box at the top for your company name, target DSO, day count convention, start month and fiscal year end. Below it, a monthly grid pre-built with 36 rows. Type revenue and closing A/R; the model returns DSO, a three month moving average, a trailing twelve month figure, your target, and the month on month change. An optional aging split lets you enter the standard five buckets (current, 1 to 30, 31 to 60, 61 to 90, 90 plus) with a built in check confirming they add back to your A/R balance.

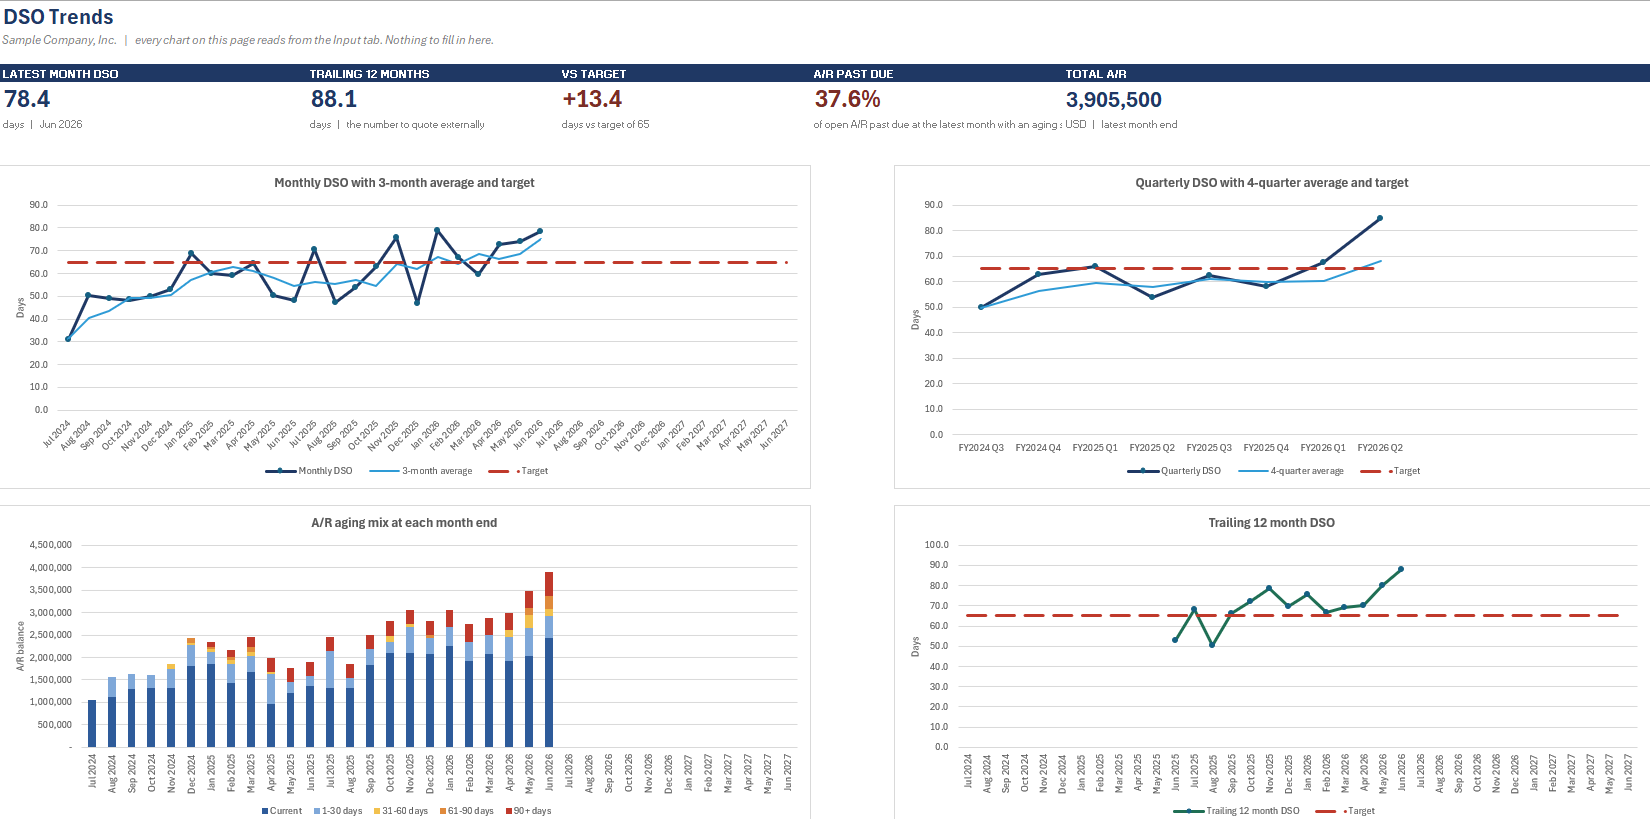
Trends. Five headline tiles and four charts: monthly DSO against its three month average and your target line; DSO by fiscal quarter against a four quarter average; the aging mix at every month end as a stacked column; and the trailing twelve month DSO trend. All four read the Input sheet directly, so adding a month extends every chart automatically.

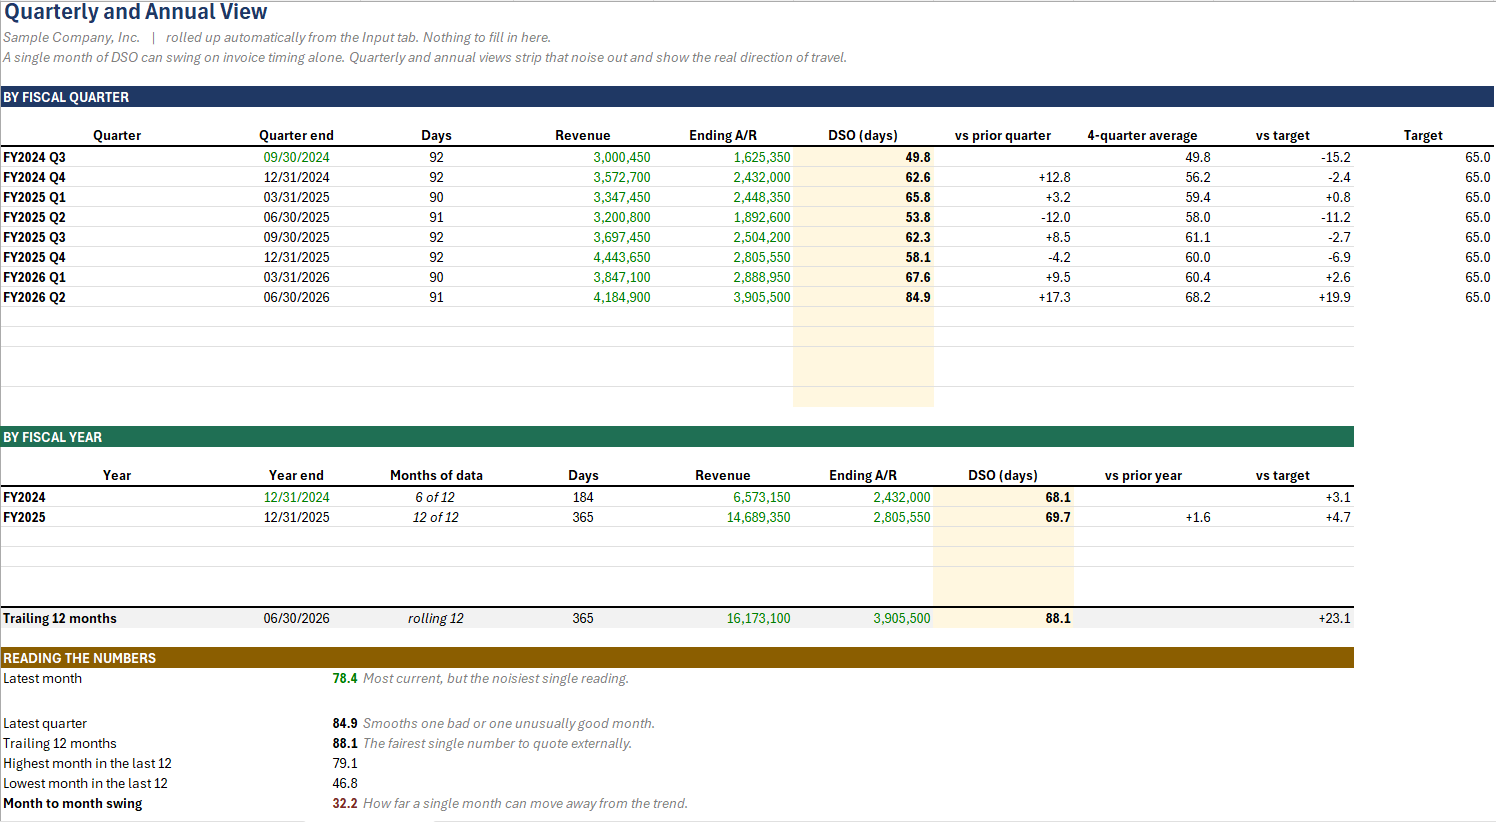
Quarter and Year. The same data rolled up to twelve fiscal quarters and four fiscal years, plus a rolling trailing twelve month row. A "Reading the numbers" panel compares your latest month, latest quarter and trailing twelve month figures side by side, shows the highest and lowest month of the last year, and writes a one sentence plain English summary that updates itself.

Two optional support tabs. A sample sales register of 306 invoices across twelve customers on mixed credit terms, and a worked A/R aging report built from it, including exposure by customer and a reconciliation check. These exist purely to demonstrate how invoice level data becomes the monthly figures. They are behind a grey divider and can be deleted at any point without affecting anything.

How it is built
  • Fiscal year aware. Set any fiscal year end month and the quarterly and annual roll ups follow it. Calendar year is the default.
  • Two day count conventions. Actual calendar days for precision, or a fixed 30 day month so periods are directly comparable. One dropdown.
  • Target driven. Set your benchmark once. It appears as a reference line on every chart and as a variance column on every table.
  • Colour coded. Blue means type here. Black means calculated. Green means pulled from another tab. Consistent throughout.
  • Self extending. Add a month and the tables, roll ups and charts all pick it up. No range editing, no chart surgery.
  • Clean when empty. Delete the sample data and you get blank tables and a prompt, not a screen of error codes.
  • No macros, no VBA, no add-ins. A plain workbook that opens anywhere and passes any security policy.
  • Print ready. The reporting tabs are pre-set to landscape and fit to one page wide.

Getting started
Open Start Here, read the four steps, then go to Input. Replace the sample company name, set your target DSO and fiscal year end, and start typing your monthly figures over the sample data. The dashboard populates as you go. Most users are up and running in under ten minutes.

Compatibility
Built and tested in Microsoft Excel for Microsoft 365. Excel 2021 or later is recommended, as the two optional support tabs use dynamic array functions. The four main tabs use standard Excel functions only. Works on Windows and Mac.

This Best Practice includes
1 Excel Workbook

Linh V Le offers you this Best Practice for free!

download for free

Add to bookmarks

Discuss

Further information

* Calculate monthly, quarterly, annual and trailing twelve month DSO from a simple set of monthly inputs.
* Give management a clear view of how quickly accounts receivable is being converted into cash.
* Track DSO against an internal target or benchmark and identify whether collections performance is improving or deteriorating.
* Smooth month-to-month volatility with a three month moving average and use trailing twelve month DSO to assess the longer-term trend.
* Understand how the composition of A/R is changing through optional aging analysis.
* Provide a repeatable, presentation-ready DSO reporting process without requiring a complex BI system or bespoke spreadsheet build.
* Reduce the time and spreadsheet maintenance normally required to prepare a monthly DSO report.
* Give finance teams, consultants and management a common reporting framework that can be updated each month with minimal effort.

This model works best when:

* Your business has a meaningful accounts receivable balance generated from sales made on credit.
* Revenue sold on credit and closing A/R can be obtained reliably from your accounting or ERP system for each month.
* You want to monitor DSO at the overall company level rather than calculate DSO separately for hundreds of individual customers or invoices.
* Your billing and revenue patterns are reasonably consistent from month to month, or you are comfortable using the three month and trailing twelve month views to smooth normal fluctuations.
* Your business has established payment terms and you want to compare actual collection performance against an internal DSO target.
* You need a lightweight reporting solution that sits alongside your existing accounting system rather than a full collections, credit-risk or cash forecasting platform.
* You want monthly management reporting that can be refreshed without rebuilding formulas, charts or reporting periods.
* You operate on a calendar or fiscal year and can define the appropriate fiscal year-end month.
* You need a practical DSO model for management reporting, board packs, lender reporting, investor updates, budgeting discussions or collections reviews.

This model may not be the best fit when:

* Your business has little or no accounts receivable because customers generally pay at the time of sale.
* Your A/R balance includes significant amounts unrelated to normal trade receivables, such as loans, employee advances, tax receivables or other non-trade balances, without being separated before input.
* Revenue sold on credit cannot be reliably identified or separated from cash sales.
* Your business experiences extremely large or irregular one-off billings where a simple month-end DSO calculation would be materially distorted by billing timing.
* Revenue recognition and invoicing occur on substantially different schedules and you need a metric specifically tied to contractual billing or invoice dates rather than recognized credit revenue.
* You need customer-level, invoice-level or collector-level performance analysis as the primary purpose of the model. The optional support tabs demonstrate invoice-to-monthly aggregation but are not intended to replace a dedicated collections or credit management system.
* You need a detailed cash collection forecast, probability-of-payment model, credit-risk assessment, or expected credit loss calculation. DSO is a receivables performance metric, not a complete cash forecasting or credit-risk model.
* Your organization requires highly specialized DSO methodology, such as customer-segment-specific calculations, contractual-term adjustments, weighted payment-term analysis, or industry-specific KPIs that go beyond the standard monthly DSO approach.
* Your accounting data is not reconciled or the monthly revenue and A/R figures are inconsistent in definition from one period to another. The model can calculate the metric accurately from its inputs, but it cannot correct an underlying accounting or data-definition problem.


0.0 / 5 (0 votes)

please wait...