Electronics Production & Sales Dashboard – Excel Workbook with Live KPIs, PivotCharts & One-Click Refresh
Originally published: 30/08/2026 12:50
Publication number: ELQ-39024-1
View all versions & Certificate
certified

Electronics Production & Sales Dashboard – Excel Workbook with Live KPIs, PivotCharts & One-Click Refresh

A combined production and sales dashboard for electronics businesses in Excel

Description
This Electronics Production & Sales Dashboard is a complete Excel workbook built for electronics manufacturers, assemblers, and distributors who need one place to see both how much they're producing and how much they're selling — without switching between separate production logs and sales spreadsheets. It brings manufacturing performance and commercial performance together into a single, connected view.

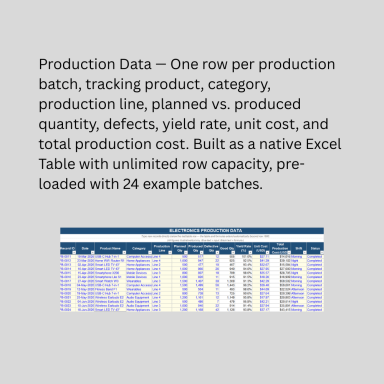
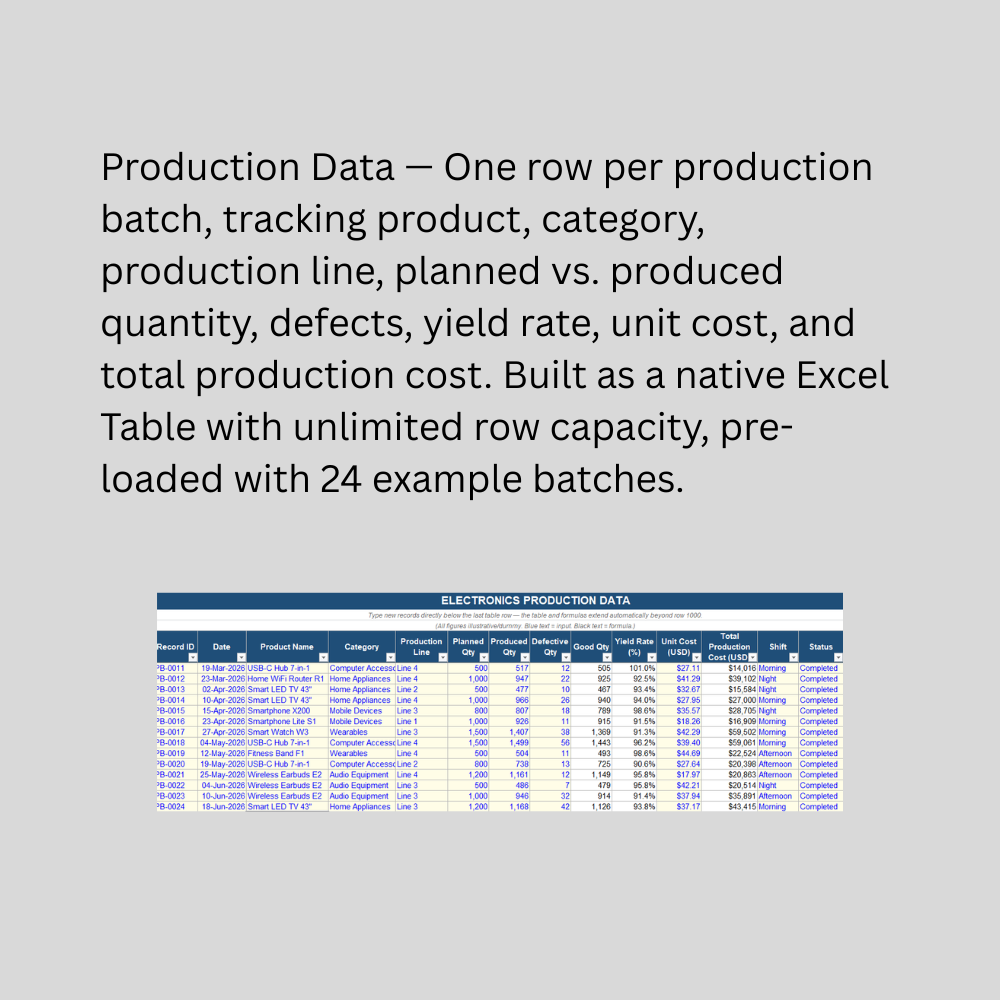
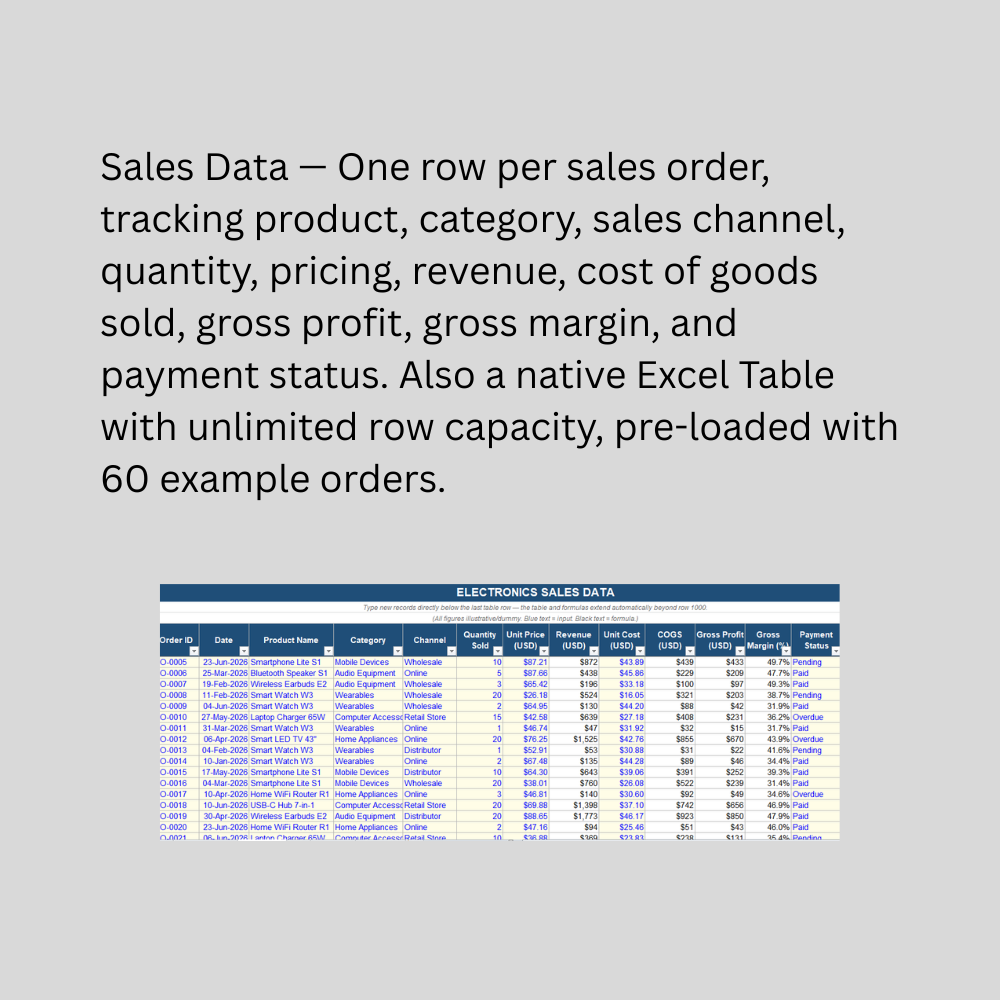
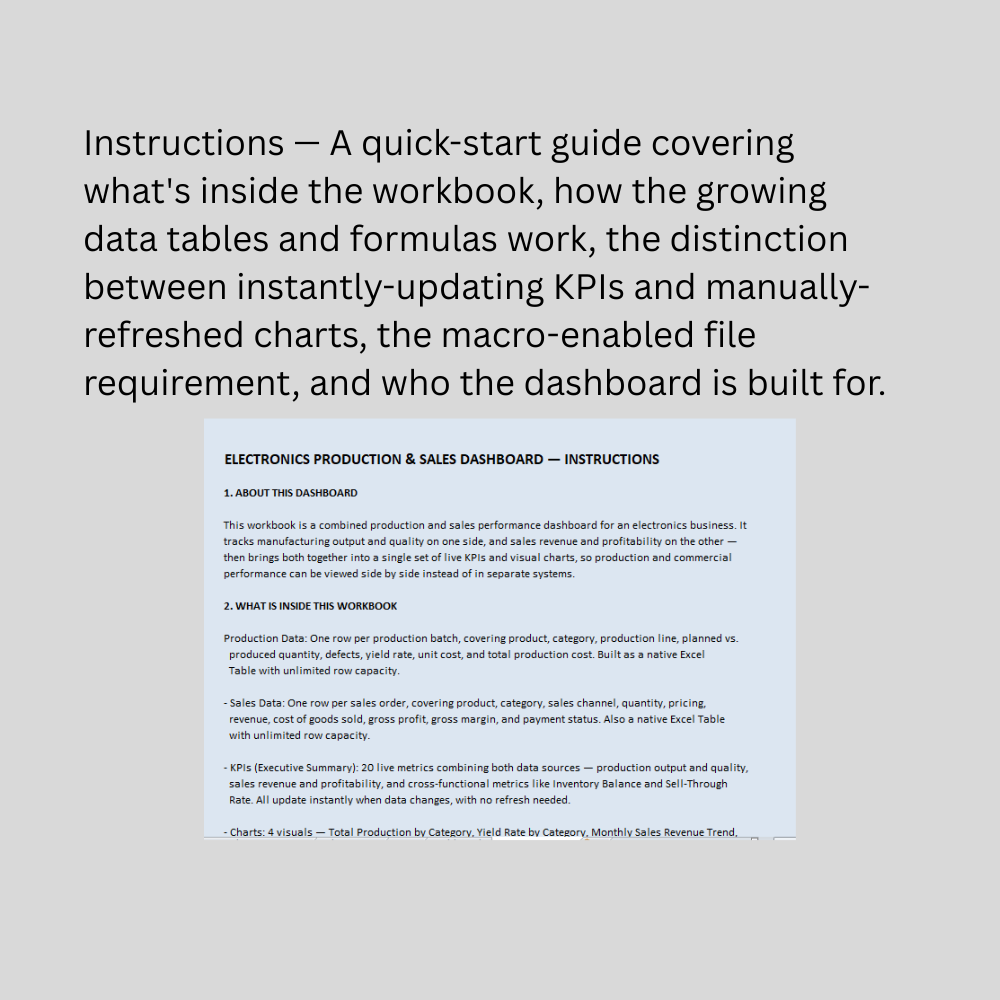
At its foundation are two native Excel Tables. Production Data captures one row per production batch — product, category, production line, planned vs. produced quantity, defects, and unit cost — with Good Quantity, Yield Rate, and Total Production Cost calculated automatically. Sales Data captures one row per sales order — product, category, sales channel, quantity, and pricing — with Revenue, Cost of Goods Sold, Gross Profit, and Gross Margin calculated automatically. Both tables grow without limit: add new batches or orders simply by typing into the row below the last one, with formulas and dropdown validation extending automatically.

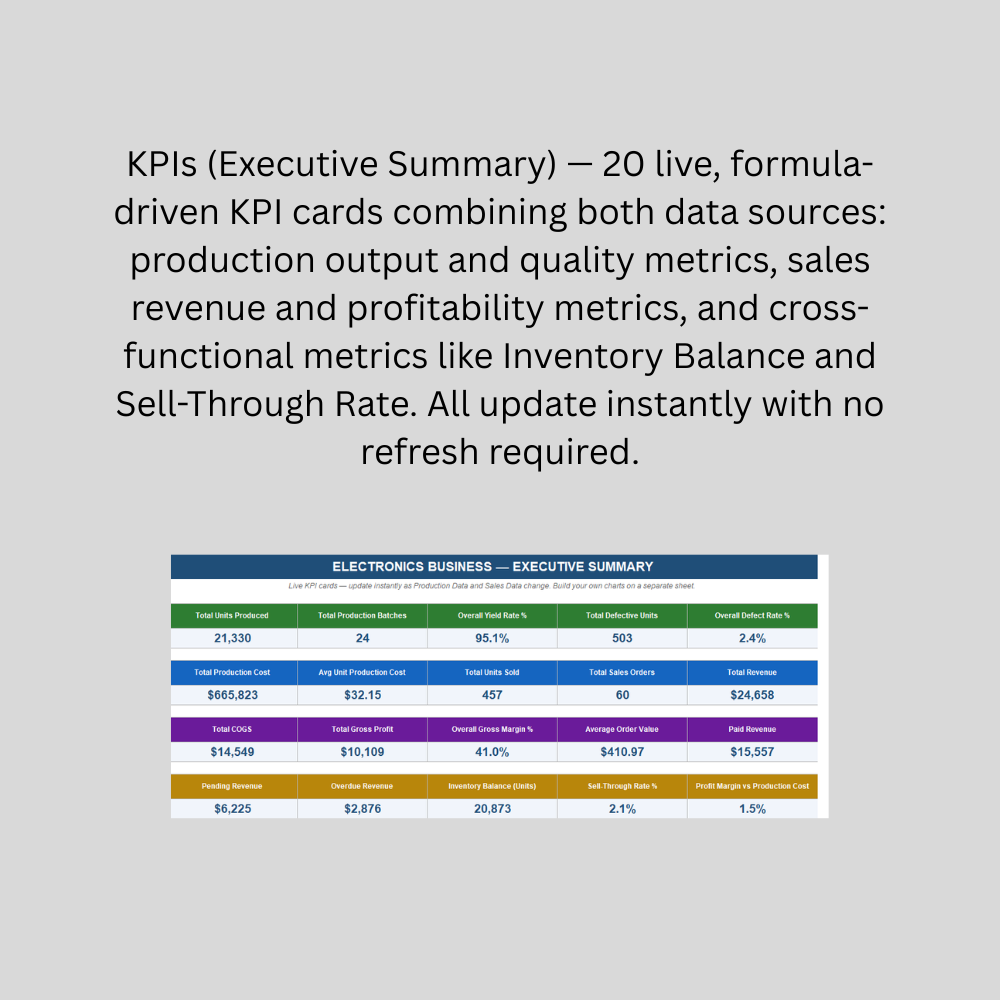
On top of this sits a 20-KPI Executive Summary combining both sides of the business: total units produced, yield rate, defect rate, and production cost on one side; total revenue, gross margin, average order value, and payment status breakdown on the other; and cross-functional metrics like Inventory Balance (produced minus sold) and Sell-Through Rate that only make sense when production and sales data are viewed together. Every KPI uses SUMIFS/AVERAGEIFS formulas referencing the tables directly, updating instantly with zero manual steps.

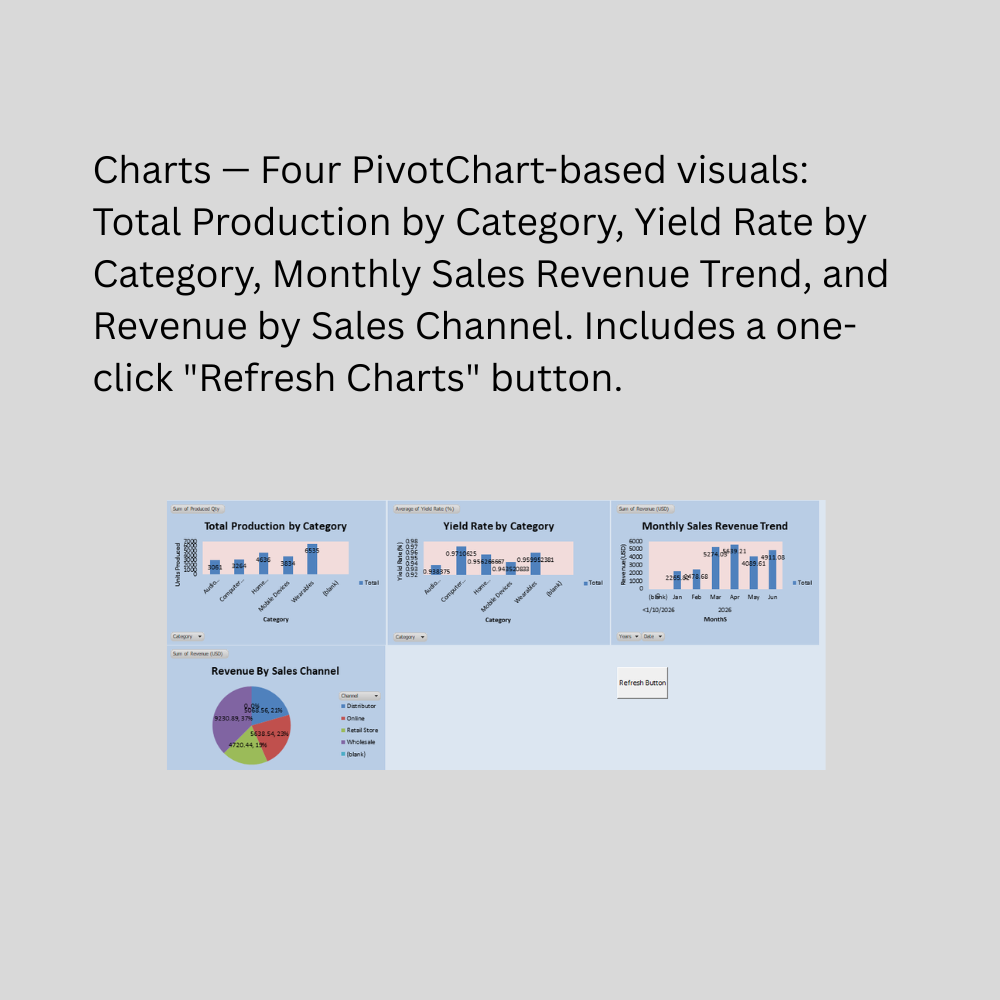
Four PivotChart-based visuals — Total Production by Category, Yield Rate by Category, Monthly Sales Revenue Trend, and Revenue by Sales Channel — sit on a dedicated Charts sheet, with a one-click "Refresh Charts" button (built with a simple macro) that updates all four at once and confirms completion with an on-screen message. The workbook is macro-enabled (.xlsm) to support this button.

This Best Practice includes
1 excel dashboard file (xlsm) with instruction set

Acquire business license for $25.00

Add to cart

Add to bookmarks

Discuss

Further information

Provide unlimited-growth data tables for both production batches and sales orders in one workbook
Deliver instant, formula-driven KPIs spanning production quality, cost, sales revenue, and profitability
Combine production and sales data into cross-functional metrics like Inventory Balance and Sell-Through Rate
Visualize performance by category, by month, and by sales channel through PivotCharts
Enable one-click refresh of all charts, avoiding the risk of viewing stale data
Help electronics businesses spot quality issues, slow-moving inventory, and underperforming channels quickly

Electronics manufacturers, assemblers, or distributors tracking both production and sales in one place
Small to mid-sized businesses wanting a lightweight, offline alternative to ERP/MES software
Businesses selling through multiple channels (retail, online, distributor, wholesale) wanting channel-level visibility
Users comfortable with Excel PivotTables/PivotCharts and enabling macros (.xlsm files)
Operations with a standard batch-based production process and order-based sales process
Monthly or periodic review cycles rather than real-time production floor monitoring

Real-time production line monitoring or MES/SCADA integration
Multi-warehouse or multi-location inventory tracking with location-specific stock levels
Businesses needing direct integration with accounting or ERP software
Complex bill-of-materials (BOM) costing or component-level inventory management
Multi-currency or multi-country consolidated reporting across international operations
Businesses unable or unwilling to enable macros, since the Refresh Charts button requires this
Situations requiring certified financial reporting or audit-ready records — this is an operational visibility tool, not a substitute for professional accounting or ERP systems


0.0 / 5 (0 votes)

please wait...