
Originally published: 21/09/2018 15:36
Last version published: 17/06/2020 07:27
Publication number: ELQ-57578-4
View all versions & Certificate
Last version published: 17/06/2020 07:27
Publication number: ELQ-57578-4
View all versions & Certificate

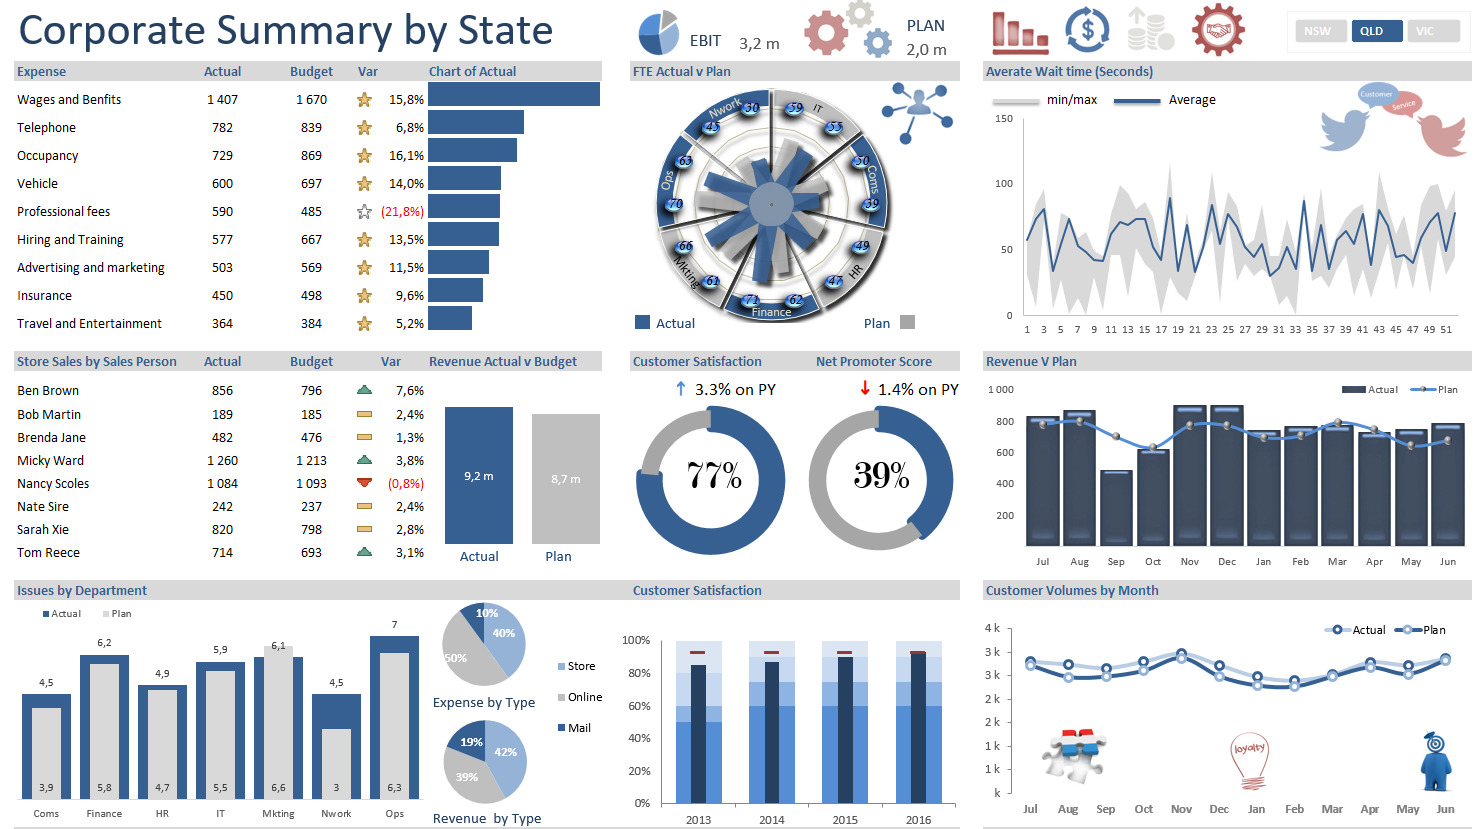
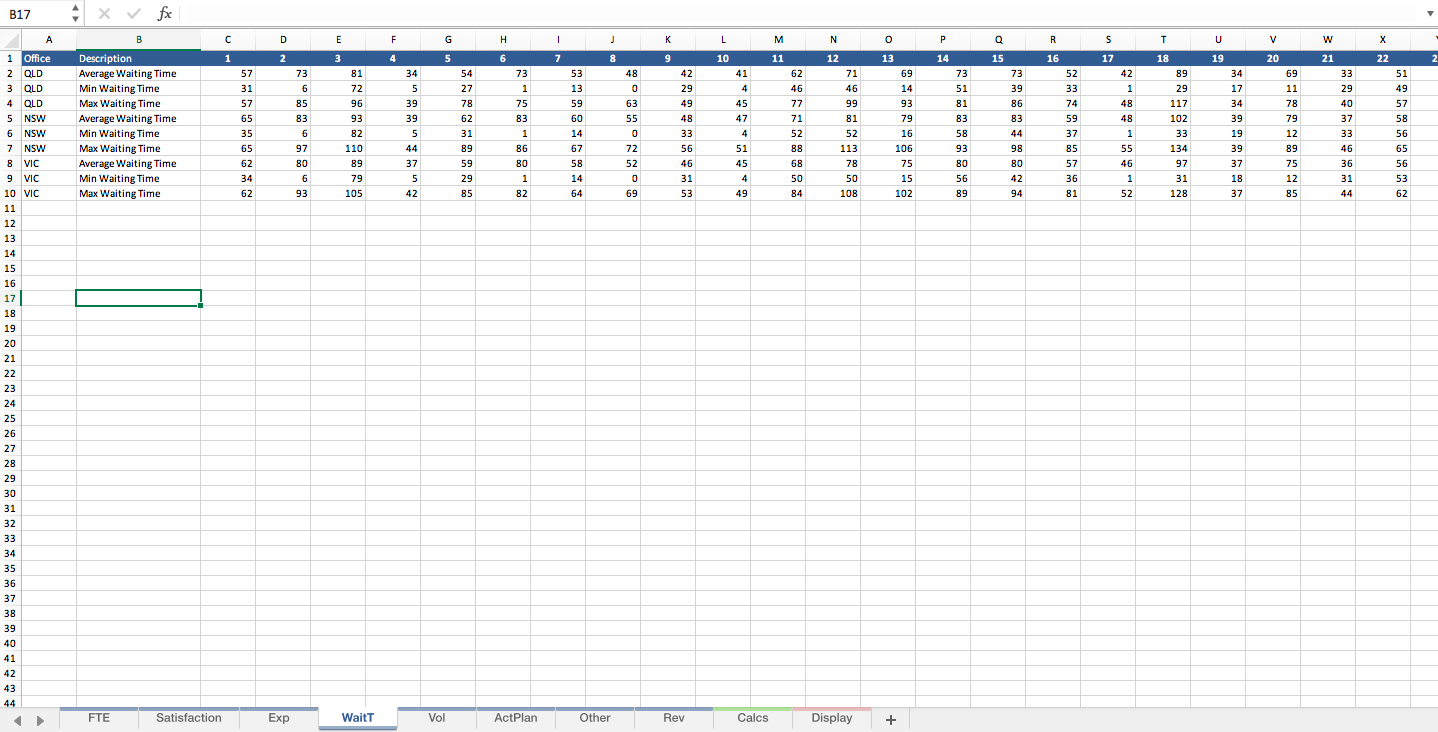
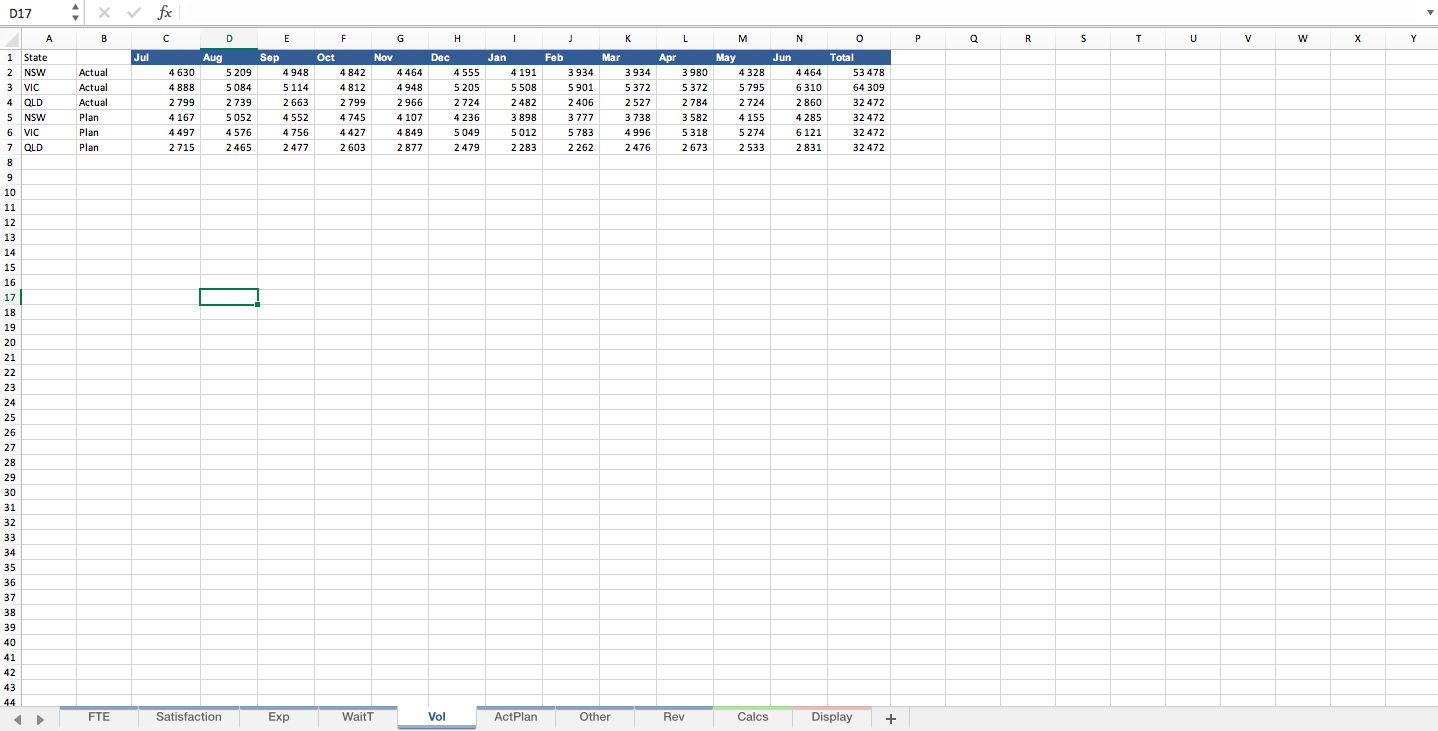
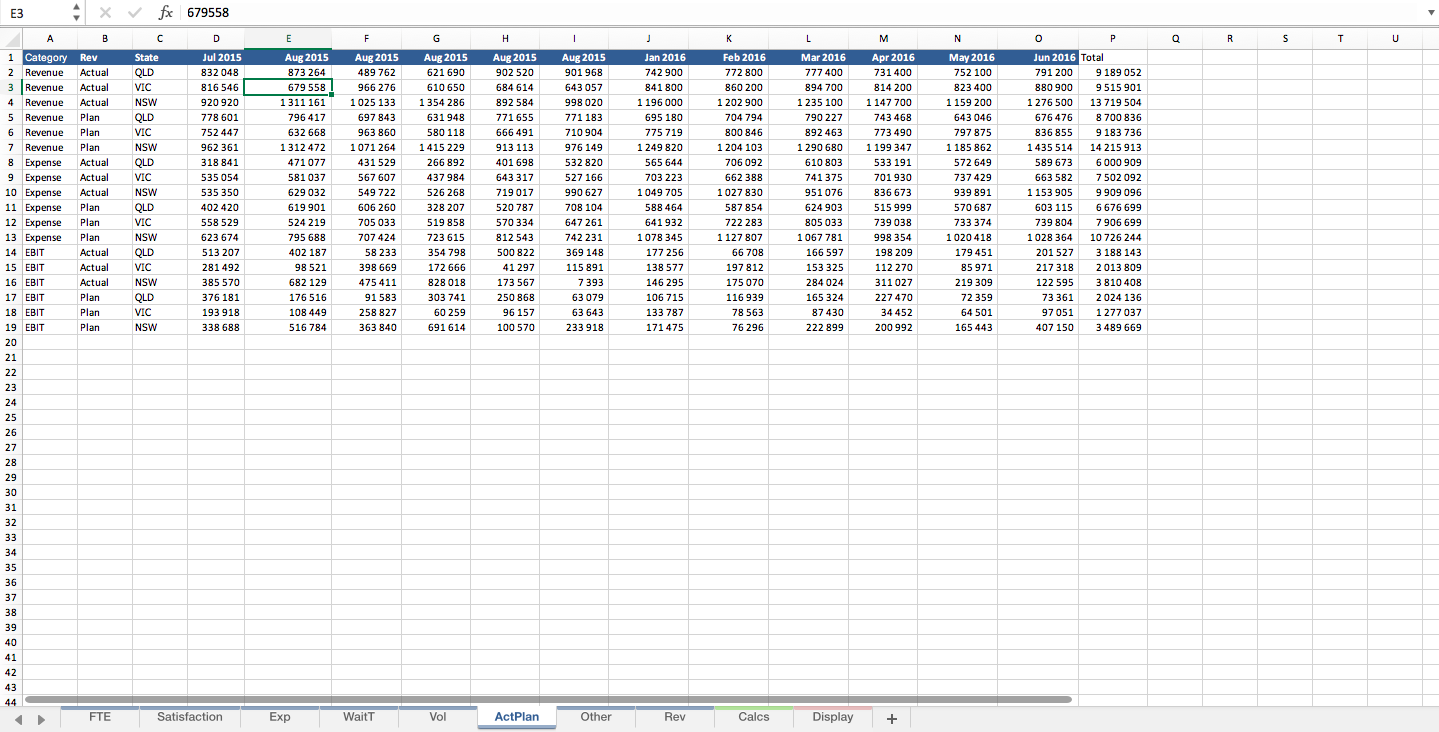
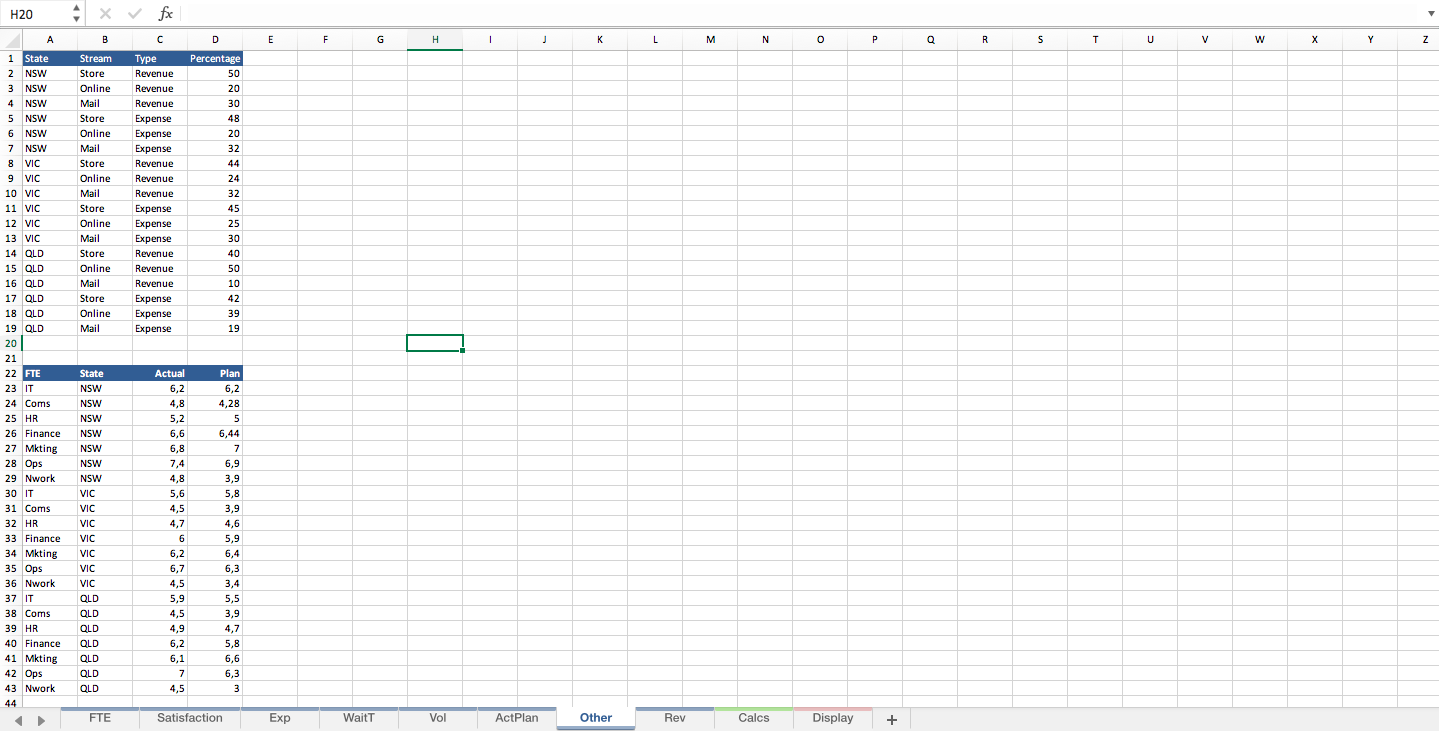
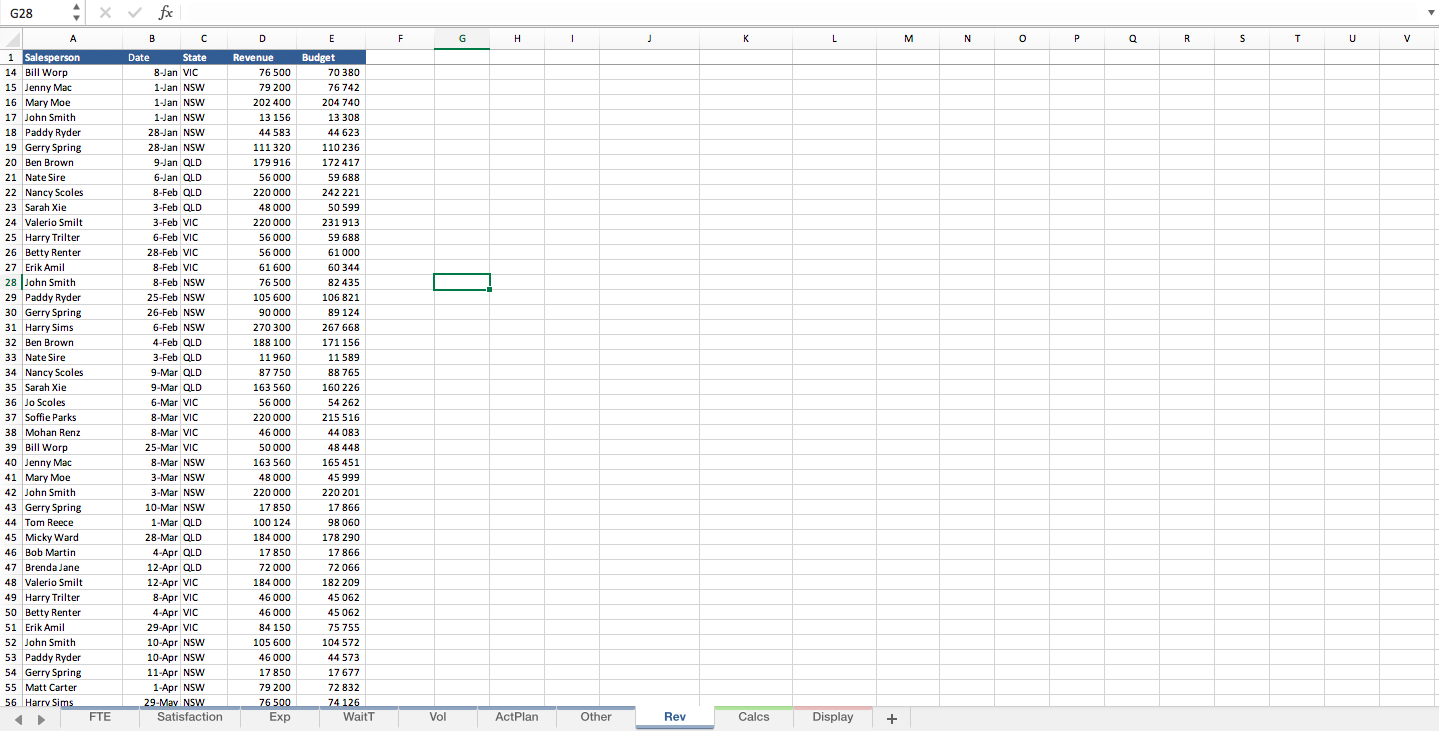
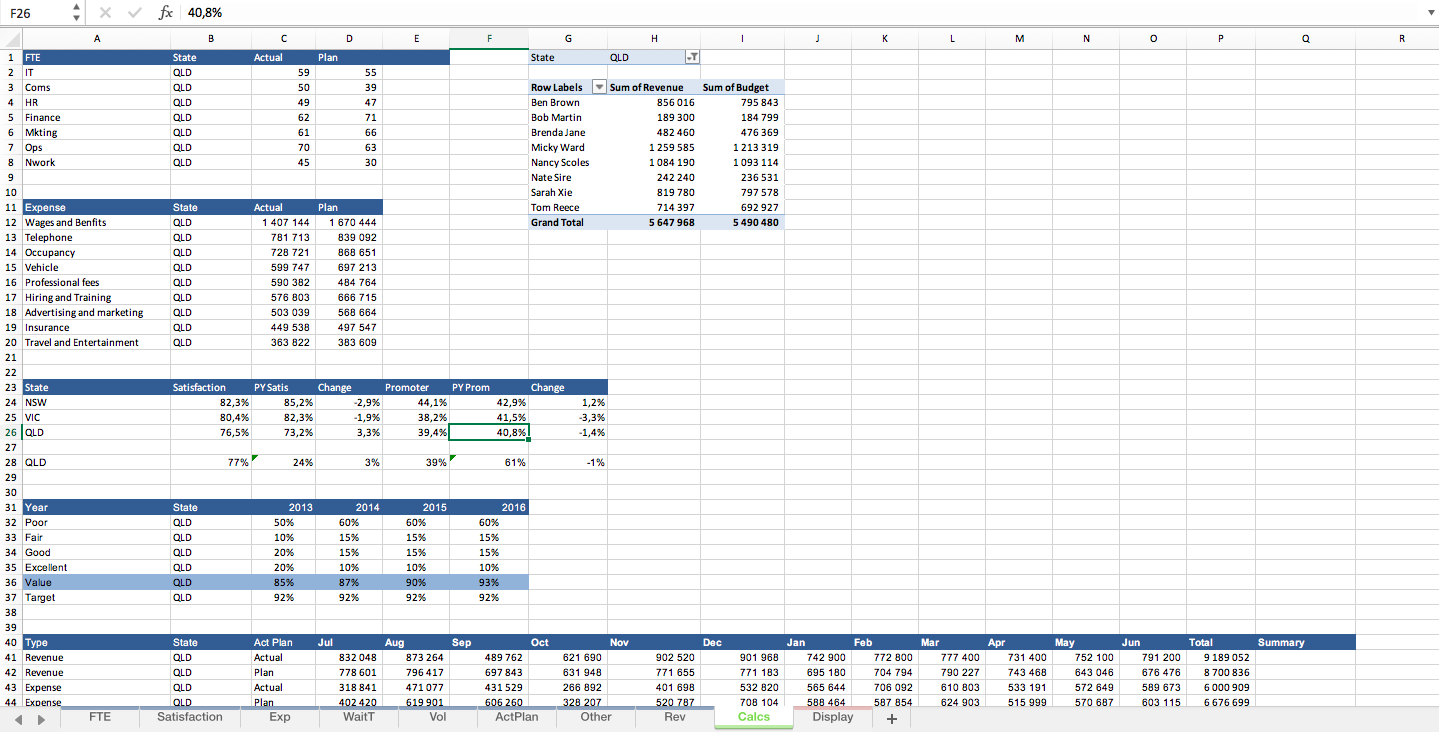
Corporate Summary Excel Dashboard
A succinct Corporate Summary Excel dashboard report which displays a range of organisational metrics (actual vs plan).
Further information
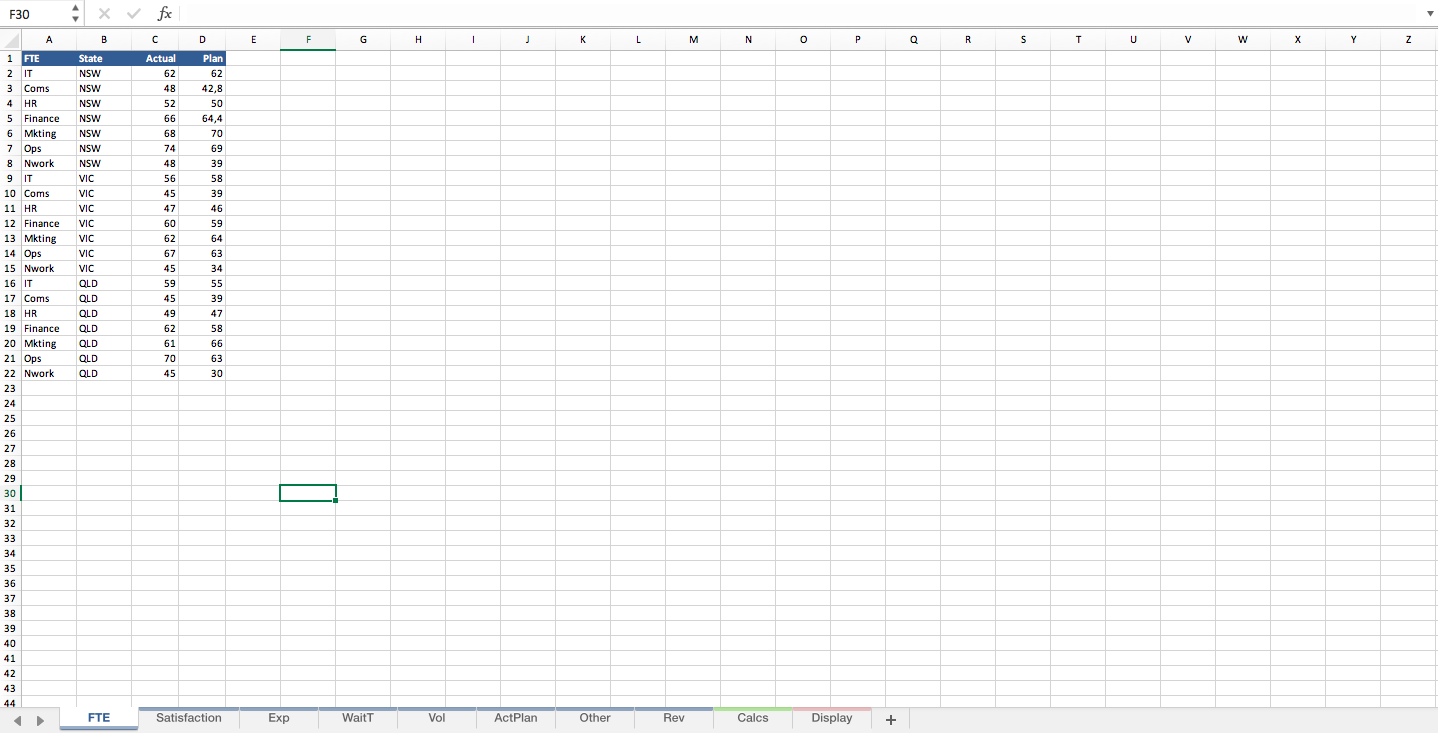
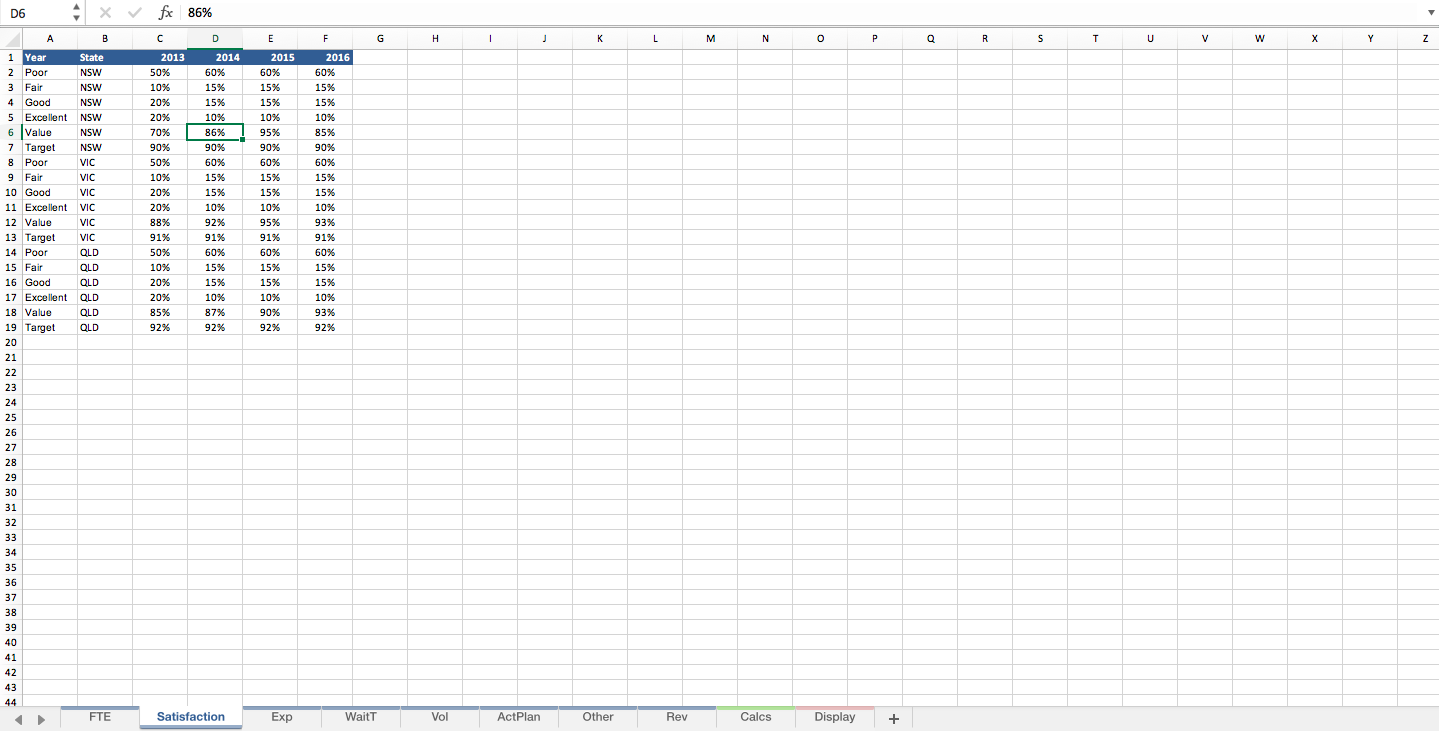
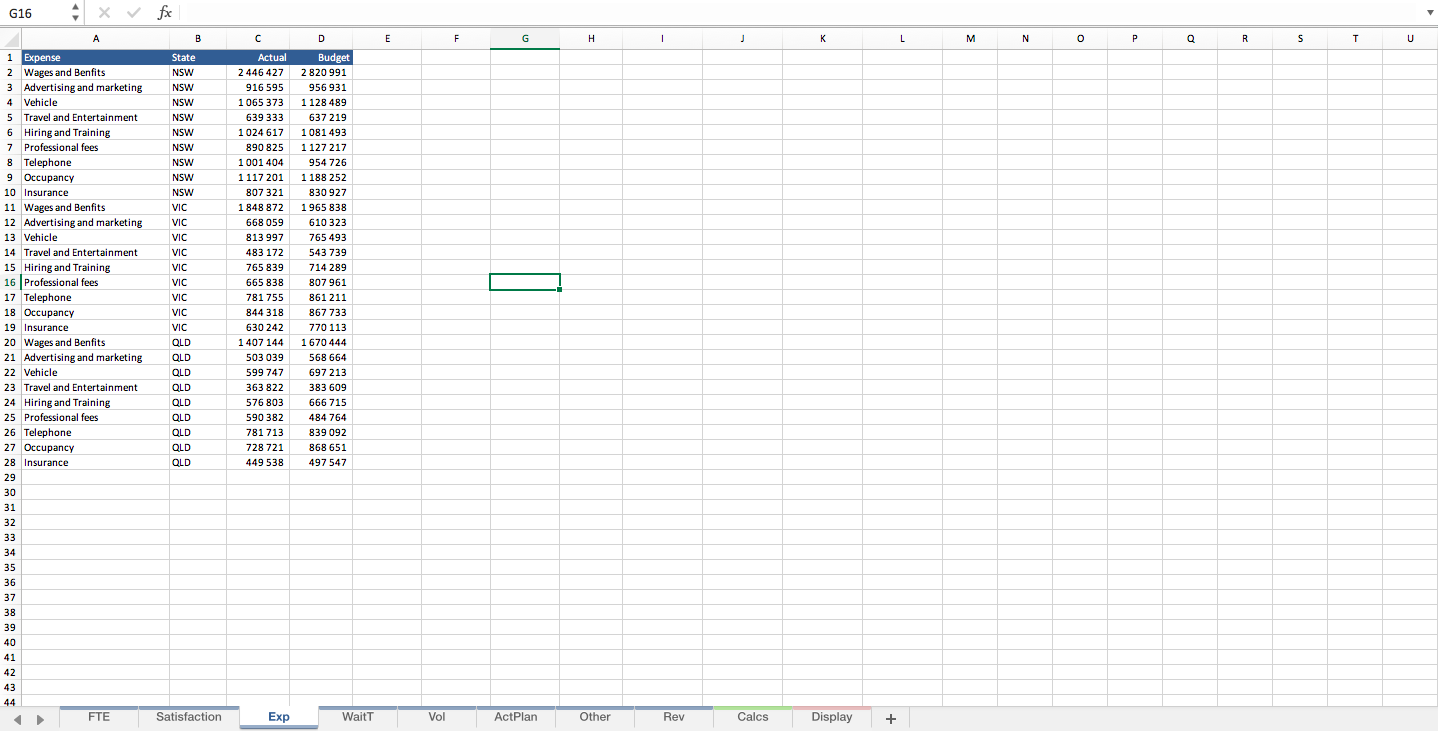
To give people a starting point for a model - a general idea about layout and how a model can be presented in a clean clear way.
