Originally published: 26/11/2018 15:06
Publication number: ELQ-11946-1
View all versions & Certificate
Publication number: ELQ-11946-1
View all versions & Certificate

How to Use Student's T Distribution
Learn everything you need to know about Student's T Distribution.
- Step n°1 |
Student’s t distribution
William Gosset was an English statistician who worked for the brewery of Guinness. He developed different methods for the selection of the best yielding varieties of barley – an important ingredient when making beer. Gosset found big samples tedious, so he was trying to develop a way to extract small samples but still come up with meaningful predictions.
He was a curious and productive researcher and published a number of papers that are still relevant today. However, due to the Guinness company policy, he was not allowed to sign the papers with his own name. Therefore, all of his work was under the pen name: Student.
Later on, a friend of his and a famous statistician, Ronald Fisher, stepping on the findings of Gosset, introduced the t-statistic, and the name that stuck with the corresponding distribution even today is Student’s t.
The Student’s t distribution is one of the biggest breakthroughs in statistics. It allowed inference through small samples with an unknown population variance. This setting can be applied to a big part of the statistical problems we face today and is an important part of this course.
Alright.
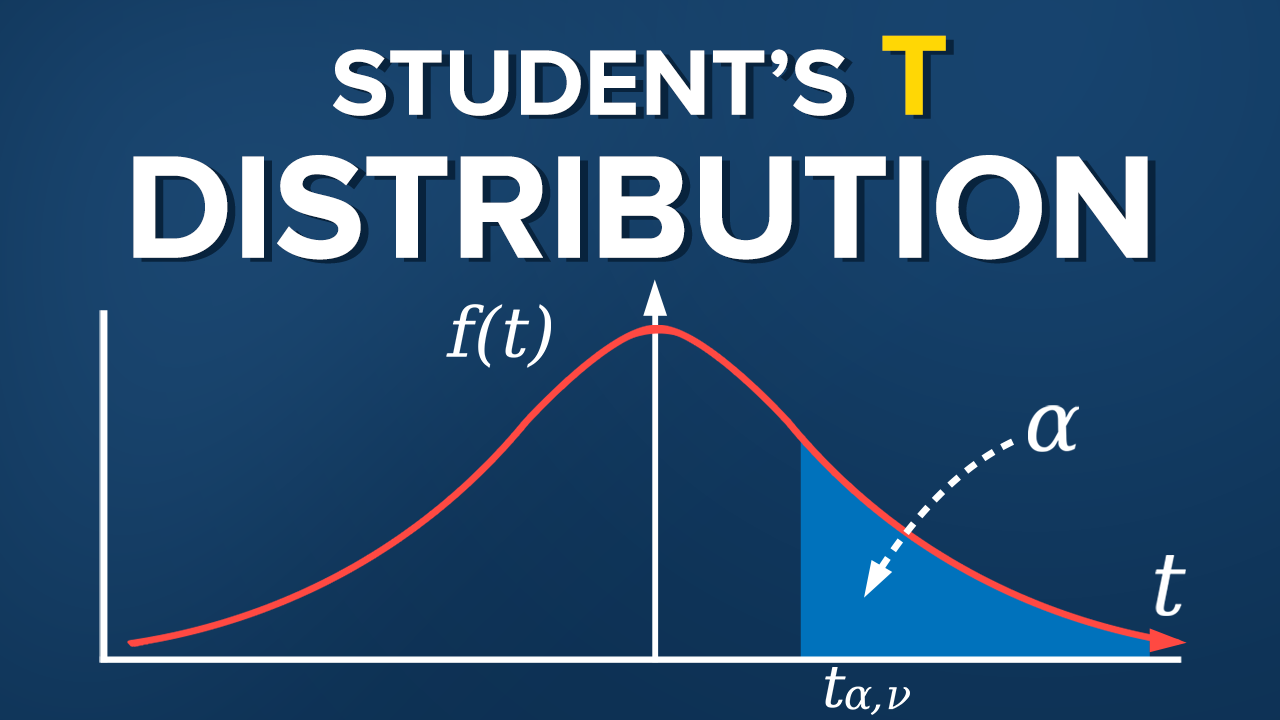
Visually, the Student’s t distribution looks much like a normal distribution but generally has fatter tails. Fatter tails as you may remember allows for a higher dispersion of variables, as there is more uncertainty.
In the same way that the z-statistic is related to the standard normal distribution, the t-statistic is related to the Student’s t distribution. The formula that allows us to calculate it is: t with n-1 degrees of freedom and a significance level of alpha equals the sample mean minus the population mean, divided by the standard error of the sample.
As you can see, it is very similar to the z-statistic; after all, this is an approximation of the normal distribution.
The last characteristic of the Student’s t-statistic is that there are degrees of freedom. Usually, for a sample of n, we have n-1 degrees of freedom. So, for a sample of 20 observations, the degrees of freedom are 19.
Much like the standard normal distribution table, we also have a Student’s t table. Here it is. The rows indicate different degrees of freedom, abbreviated as d.f., while the columns – common alphas.
Please note that after the 30th row, the numbers don’t vary that much. Actually, after 30 degrees of freedom, the t-statistic table becomes almost the same as the z-statistic. As the degrees of freedom depend on the sample, in essence, the bigger the sample, the closer we get to the actual numbers. A common rule of thumb is that for a sample containing more than 50 observations, we use the z-table instead of the t-table.
